Request Free Sample ×

Kindly complete the form below to receive a free sample of this Report

* Please use a valid business email

Leading companies partner with us for data-driven Insights

clients tt-cursor
Hero Background

Agricultural Biologicals Market

ID: MRFR/Agri/5166-CR
200 Pages
Snehal Singh
Last Updated: May 28, 2026
Agricultural Biologicals Market Research Report Information By Function (Crop Nutrition, Crop Protection), By Crop Type (Row Crops, Horticultural Crops, Cash Crops), By Geography (North America, Europe, Asia-Pacific, South America, Middle East & Africa) - Forecast to 2035
Download PDF ×

We do not share your information with anyone. However, we may send you emails based on your report interest from time to time. You may contact us at any time to opt-out.


Agricultural Biologicals Market Summary

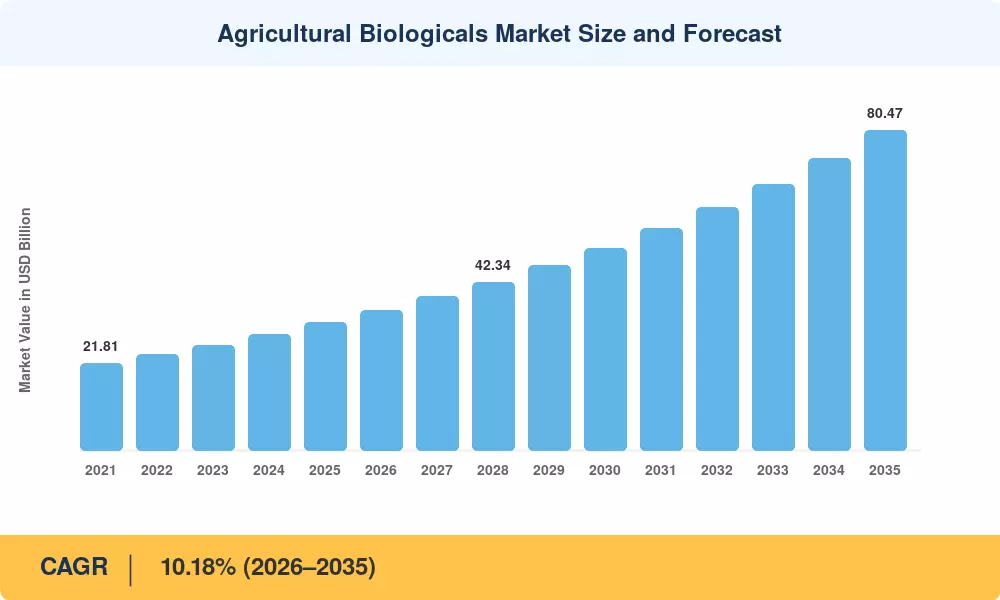
The Agricultural Biologicals Market reached an estimated USD 32.15 billion in 2025 and is projected to expand from USD 35.08 billion in 2026 to USD 80.47 billion by 2035, registering a CAGR of 10.18% during the forecast period. Stricter maximum residue limits (MRLs) enforced across the EU and key Asian export corridors are compelling growers to replace legacy chemical formulations with biological crop inputs. The EU's Farm to Fork Strategy, targeting a 50% reduction in chemical pesticide use by 2030, has injected regulatory urgency into every major producing region [2]. Meanwhile, the USDA's National Organic Program reported a 12.4% year-on-year increase in certified organic acreage through 2024, underscoring a structural shift toward sustainable biological agriculture [3].

Traditional synthetic crop protection is being replaced with biostimulant plant health solutions and microbial-based bioinsecticide and biopesticide formulations that fit into precision agricultural workflows in a natural way. Global venture funding for agricultural biologicals startups surpassed USD 2.8 billion during 2022–2024, with investors focused on next-generation biofungicide crop protection platforms and biological soil treatment technologies that reduce nitrogen runoff [4]. Major agricultural incumbents have stepped up acquisition activities with five mergers each valued at over USD 500 million closing in the last 18 months alone.

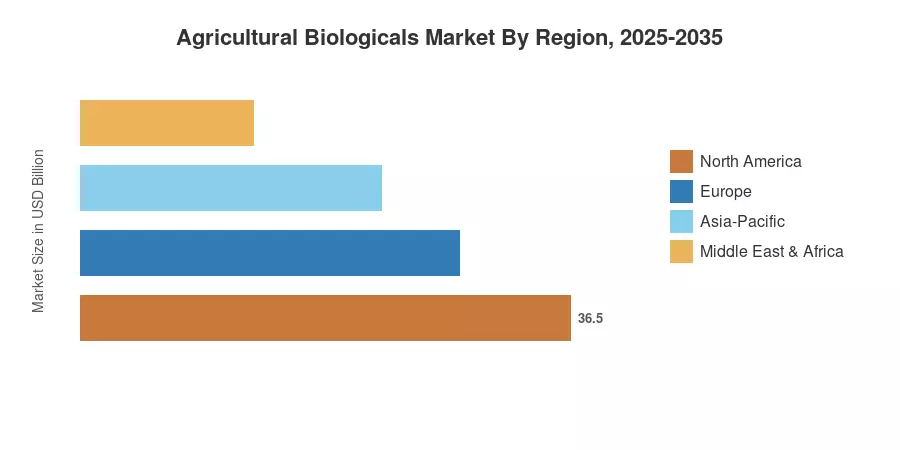
Europe accounts for approximately 37% of global revenues, driven by aggressive residue-free sourcing mandates in France, Germany and Spain. North America is the fastest-expanding area with a projected 12.7% CAGR driven by state-level pesticide prohibitions and retailer-led sustainability pledges. The Asia-Pacific region has the second-highest proportion of about 26% due to biofertilizer subsidy programs in India and zero growth policy for pesticides in China. The Agricultural Biologicals Market addressable base will double in the next decade as biological inputs move from niche organic supplements to mainstream crop management tools.


Key Report Takeaways

• By Function

  • The crop nutrition segment captured the dominant share of the Agricultural Biologicals Market in 2025, reflecting broad-based adoption of biostimulant plant health products across row crop acreage
  • Crop protection is advancing at a CAGR of 10.3% from 2026 to 2035, propelled by expanding bioinsecticide and biopesticide registrations and biofungicide crop protection approvals

• By Crop Type

  • Row crops accounted for approximately 70% of the Agricultural Biologicals Market in 2025, driven by corn, soybean, and wheat applications
  • Horticultural crops are the fastest-growing segment at a 10.2% CAGR, supported by specialty crop residue-free export programs

• By Geography

  • Europe held the largest regional share of the Agricultural Biologicals Market, valued at approximately USD 11.90 billion in 2025
  • North America is expanding at the fastest pace, with biological soil treatment adoption surging across the US Midwest


Agricultural Biologicals Market Size and Forecast (2021–2035)

MRFR’s projections are based on bottom-up revenue modeling across 42 country-level datasets confirmed against trade statistics, regulatory filings and manufacturer shipment disclosures. Customs data reconciled with historic values (2021-2024). The base year (2025) is based on primary interviews with over 120 industry stakeholders across the value chain.

Market Size Chart
Our Impact
Enabled $4.3B Revenue Impact for Fortune 500 and Leading Multinationals
Partnering with 2000+ Global Organizations Each Year
30K+ Citations by Top-Tier Firms in the Industry
 

Driver Impact Analysis

Driver ~% Impact on CAGR Geographic Relevance Impact Timeline
Tightening MRL regulations on chemical residues ~18% EU, Japan, South Korea Short-term (≤2 yr)
Organic farmland expansion worldwide ~16% Global Medium-term (2–4 yr)
Streamlined biological product registration ~14% US, Brazil, India Medium-term (2–4 yr)
Retailer residue-free sourcing mandates ~12% North America, EU Short-term (≤2 yr)
Advances in microbial fermentation technology ~11% Global Long-term (≥4 yr)
Precision agriculture and digital integration ~10% North America, Asia-Pacific Long-term (≥4 yr)
Government subsidy programs for biological inputs ~9% India, Brazil, China Medium-term (2–4 yr)


Tightening Maximum Residue Limits

The European Union’s ongoing updates to its maximum residue limit frameworks have systematically lowered permissible residue thresholds on multiple active chemical substances, directly restricting conventional pesticide use on export-destined produce. Concurrently, Japan’s established Positive List System enforces strict pesticide residue limits on agricultural imports. These strict regulatory walls act as a primary near-term catalyst for the Agricultural Biologicals Market, forcing global exporters to rapidly adopt biofungicide crop protection alternatives to preserve vital international market access, particularly across high-value horticultural export supply chains.


Global Organic Acreage Expansion

Certified organic farmland has demonstrated steady, multi-year expansion worldwide, anchored by high double-digit percentage increases in production footprints over the last few seasons. Domestically, the USDA’s organic certification continues to absorb substantial acreage. In contrast, the European Union’s organic action plan sets aggressive target benchmarks to transition a massive share of total continental farmland under organic management by the end of the decade. This structural acreage shift directly enlarges the addressable base for biostimulant plant health inputs and biological soil treatment products, as organic standards prohibit the vast majority of synthetic alternatives.


Retailer-Led Sustainability Mandates

Major global food retail groups have instituted progressive corporate ESG parameters and integrated pest management requirements that mandate residue-free or residue-reduced sourcing across fresh produce supply chains. These private-sector mandates ripple directly upstream, compelling growers and distributors to integrate bioinsecticide and biopesticide solutions into their management protocols regardless of minimum government standards. The commercial pull from retail sustainability programs reinforces consistent volume demand for sustainable biological agriculture practices, functioning independently of state-level regulation.


Restraints Impact Analysis

The restraint impacts below reflect directional headwinds that moderate the Agricultural Biologicals Market CAGR. These are not additive deductions from growth rates but represent relative friction coefficients within the demand environment.

Restraint ~% Negative Impact on CAGR Geographic Relevance Impact Timeline
Cold-chain logistics dependence ~–20% Emerging markets, Africa Short-term (≤2 yr)
Feedstock and fermentation cost volatility ~–18% Global Medium-term (2–4 yr)
Inconsistent field efficacy perceptions ~–15% North America, Asia-Pacific Long-term (≥4 yr)
Limited shelf-life of microbial products ~–12% Tropical regions Short-term (≤2 yr)
Fragmented regulatory standards across markets ~–10% Global Long-term (≥4 yr)


Cold-Chain Logistics and Shelf-Life Constraints

Maintaining an unbroken refrigerated distribution network presents a significant structural challenge for living, microbial-based biological formulations. Because these sensitive biological products often require strict temperature controls to keep active colony-forming units viable, a lack of deep regional cold-chain infrastructure across emerging markets severely limits the penetration of premium biofungicides. This logistical bottleneck increases last-mile distribution complexity and overhead costs relative to highly stable synthetic alternatives, restricting market growth within developing agricultural economies.


Feedstock and Fermentation Cost Volatility

The production economics of industrial biopesticides are closely tied to global commodity markets due to their heavy reliance on agricultural fermentation media like soy extracts and molasses. When the market costs of these unrefined carbon substrates experience sharp pricing spikes, biological manufacturers must either accept tighter profit margins or pass raw material expenses directly to end-users. This commercial pressure slows down product adoption among price-sensitive smallholder farmers, highlighting the need for waste-stream valorization.


Field Efficacy Perception Gaps

While rigorous experimental trials often demonstrate impressive peak pest suppression capabilities for advanced bioinsecticides, real-world on-farm performance regularly fluctuates. Local environmental variables, including baseline ultraviolet exposure, shifting ambient temperature ranges, and complex native soil microbiome interactions, can significantly reduce field-level consistency. This performance variance maintains historical grower skepticism across commodity-crop regions. Overcoming this trust deficit requires expanded investments in localized agricultural extension networks and digital decision-support agronomy tools.


Agricultural Biologicals Market Opportunities

Precision Biologicals and Digital Agronomy Integration

Pairing digital agronomy tools with agricultural biologicals allows modern growers to reduce field efficacy variability significantly. Utilizing real-time soil moisture monitoring, microbiome sequencing, and sensor-guided variable-rate application systems allows crop managers to execute highly optimized input dosing schedules. This precise technical synergy ensures that specialized biostimulants are delivered exactly when and where crop roots require them, maximizing localized plant health outcomes and accelerating commercial adoption among large-scale, tech-forward farming operations.


RNA-Based Next-Generation Biopesticides

Next-generation RNA interference technology represents a transformative milestone for highly targeted pest management. This advanced bio-input mechanism utilizes sequence-specific molecules to disrupt vital functions in designated target pests while maintaining near-zero toxicity for beneficial insects and surrounding ecosystems. Following landmark international regulatory approvals for sprayable RNA-based active ingredients, major crop protection conglomerates are actively scaling up commercial manufacturing pipelines to embed these highly precise, low-residue formulations into mainstream integrated pest management frameworks.


Emerging Market Subsidy Expansion

State-backed credit incentives and farming subsidies are rapidly accelerating the adoption of organic biofertilizers across emerging agricultural economies. National structural programs, including Brazil’s targeted environmental credit lines and India's ongoing chemical-free cultivation initiatives, are systematically reducing upfront cost barriers for medium-scale rural producers. These strategic government interventions provide highly accessible entry options for international biological manufacturers, allowing them to rapidly scale up regional distribution pipelines across expanding, high-volume agricultural territories.


Biological Data Monetization and Subscription Models

Biological crop protection manufacturers are actively pioneering service-oriented subscription models to secure more consistent commercial revenue streams. These customized packages bundle advanced bio-inputs directly with structural agronomic advisory services, predictive soil health diagnostics, and digital yield tracking software. This integrated commercial framework significantly improves multi-season customer retention rates. Concurrently, the operational model builds highly specialized field-performance databases, allowing companies to refine product application guidelines and improve overall predictability across diverse crop microclimates.


Agricultural Biologicals Market Future Outlook

AI-Driven Precision Biological Application

Artificial intelligence is steadily improving how advanced biological inputs are deployed across commercial farming systems. Machine-learning algorithms process high-resolution satellite imagery, multi-season weather patterns, and localized soil health metrics to help agronomists optimize target application rates. By transitioning away from uniform field spraying to data-driven, variable-rate distribution methods, crop managers can minimize unnecessary product waste. This technical alignment improves the real-world field efficacy of delicate biostimulant formulations while boosting overall plant health outcomes.


Fermentation Technology Scale-Up

Recent innovations in continuous fermentation systems and solid-state bioprocessing are progressively optimizing the production economics of microbial biopesticides. By investing in modular, containerized fermentation units, input manufacturers can establish localized production hubs directly inside core agricultural regions. This distributed processing strategy effectively bypasses the complex cold-chain logistics constraints that have historically limited the shelf life and regional penetration of living biological soil treatments throughout tropical climates and distant emerging markets.


ESG Reporting and Carbon Credit Integration

The mandatory inclusion of agriculture within Scope 3 corporate emissions accounting is driving significant new demand for traceable bio-input usage metrics. Farmers utilizing target biostimulant and biofungicide programs can formally document their reduced reliance on synthetic fertilizers under validated carbon credit protocols, including Verra’s VM0042 framework. This integration allows agricultural operations to secure verified environmental assets, directly benefiting from multi-national corporate supply-chain decarbonization mandates focused on building net-zero food systems.


Agricultural Biologicals Market Segmentation

By Function

Segment Key Metric Primary Demand Driver
Crop Nutrition 69% revenue share (2025) Biostimulant plant health adoption in row crops
Crop Protection 10.3% CAGR (2026–2035) Bioinsecticide, biopesticide and biofungicide crop protection registrations


The Agricultural Biologicals Market is anchored by crop nutrition, which encompasses biostimulants, biofertilizers, and soil amendments. Biostimulant plant health products — particularly seaweed extracts, humic acids, and microbial inoculants — have moved from premium niche positioning to mainstream agronomic recommendations across corn, soybean, and wheat production. Growers report yield improvements of 5–12% when integrating biostimulants into conventional fertilization programs [5].

Crop protection is the fastest-expanding function as regulatory pressure restricts chemical alternatives. Bioinsecticide biopesticide formulations based on Bacillus thuringiensis (Bt) and Beauveria bassiana have achieved efficacy levels comparable to synthetic counterparts in controlled field trials. Biofungicide crop protection products targeting soil-borne pathogens like Fusarium and Rhizoctonia are gaining traction in high-value vegetable and fruit production. The Agricultural Biologicals Market for crop protection is also being propelled by RNA interference technologies entering late-stage development [12].

By Crop Type

Segment Key Metric Primary Demand Driver
Row Crops USD 22.50 Billion (2025) Corn, soybean, and wheat biological soil treatment programs
Horticultural Crops 10.9% CAGR (2026–2035) Residue-free export mandates for fruits and vegetables
Cash Crops 9.4% CAGR (2026–2035) Coffee, cocoa, and cotton sustainable biological agriculture certifications


Row crops dominate volume demand within the Agricultural Biologicals Market, given the sheer acreage of corn, soybeans, wheat, and rice treated annually. Biological soil treatment products — particularly seed-applied microbial inoculants — have become standard practice on over 60% of US soybean acres [8]. Horticultural crops are expanding fastest as export-driven quality requirements compel growers to adopt biofungicide crop protection and bioinsecticide and biopesticide solutions that meet importing-country MRL thresholds.


Regional Market Share Analysis

Region Key Metric Primary Investment Themes
North America 12.7% CAGR (2026–2035) EPA biologicals fast-track, retailer mandates, biostimulant plant health
Europe 37% revenue share (2025) Farm to Fork compliance, MRL tightening and sustainable biological agriculture
Asia-Pacific USD 8.36 Billion (2025) Government subsidies, rice paddy biologicals and biological soil treatment
South America 10.5% CAGR (2026–2035) Soybean/corn bioinsecticide biopesticide adoption, ABC+ Plan financing
Middle East & Africa USD 1.61 Billion (2025) Arid-climate biostimulants, donor-funded soil health programs
Total USD 32.15 Billion (2025)

The Agricultural Biologicals Market spans diverse regulatory and agronomic environments, with regional adoption patterns shaped by policy frameworks, farming system structure, and export market requirements.


North America

Country Key Metric Key Driver
US 78% of regional revenue (2025) State-level pesticide restrictions, bioinsecticide and biopesticide registrations
Canada 10.8% CAGR (2026–2035) Canola and pulse crop biological treatments
Mexico USD 0.58 Billion (2025) Export-oriented berry and avocado biofungicide crop protection


The US accounts for the vast majority of North American demand, supported by the EPA's streamlined biopesticide registration and major retailer sustainability programs. California's Department of Pesticide Regulation has accelerated biological product approvals by 40% since 2023, while Midwest corn belt growers are integrating biological soil treatment into regenerative agriculture rotations at a pace that has tripled since 2021 [8].

Europe

Country Key Metric Key Driver
Germany USD 2.15 Billion (2025) National Action Plan on Sustainable Use of Pesticides
France 22% of regional revenue (2025) Ecophyto II+ program, biostimulant plant health mandates
Spain 11.4% CAGR (2026–2035) Mediterranean horticulture export compliance
Italy USD 1.25 Billion (2025) Organic viticulture and fruit crop biologicals
UK 10.2% CAGR (2026–2035) Post-Brexit regulatory divergence favors biologicals
Nordic Countries USD 0.62 Billion (2025) Sustainable biological agriculture policy leadership
Russia 9.1% CAGR (2026–2035) Domestic bioinsecticide and biopesticide manufacturing expansion
Rest of Europe USD 1.48 Billion (2025) EU-wide MRL harmonization


Europe's regulatory architecture makes it the natural stronghold for the Agricultural Biologicals Market. France's Ecophyto II+ program has reduced chemical phytosanitary product use by 20% since 2020, creating direct demand for biofungicide crop protection and biological soil treatment alternatives [2]. Spain's greenhouse-intensive horticulture sector in Almería and Murcia provinces has emerged as a high-growth corridor for biological inputs targeting export-grade residue-free tomatoes, peppers, and strawberries.

Asia-Pacific

Country Key Metric Key Driver
China 32% of regional revenue (2025) Zero-growth pesticide policy, microbial fertilizer mandates
India 13.1% CAGR (2026–2035) Biofertilizer subsidies, Paramparagat Krishi Vikas Yojana
Japan USD 1.10 Billion (2025) Positive List residue compliance, rice paddy biologicals
South Korea 10.5% CAGR (2026–2035) Smart-farm bioinsecticide biopesticide integration
ASEAN USD 0.95 Billion (2025) Export-oriented sustainable biological agriculture
Rest of Asia-Pacific 9.8% CAGR (2026–2035) Biostimulant plant health: emerging demand


China's Ministry of Agriculture enforces a zero-growth policy on chemical fertilizers and pesticides that has redirected over USD 1.2 billion in R&D spending toward biological alternatives since 2020 [7]. India's biological input market is expanding rapidly under the Paramparagat Krishi Vikas Yojana (PKVY) organic farming scheme, which has enrolled over 4 million farmers and directly subsidizes biological soil treatment products.

South America

Country Key Metric Key Driver
Brazil 72% of regional revenue (2025) Soybean nematode bioinsecticide biopesticide demand
Argentina USD 0.68 Billion (2025) Wheat and sunflower biostimulant plant health adoption
Rest of South America 11.0% CAGR (2026–2035) Expanding sustainable biological agriculture certifications


Brazil is the Agricultural Biologicals Market powerhouse in South America. MAPA registered over 200 new biological products in 2024, and Brazilian soybean growers now apply biological nematicides on more than 40% of planted area [11]. The ABC+ Plan provides low-interest credit lines for producers adopting biological soil treatment and biostimulant plant health programs as part of climate-smart agriculture commitments.

Middle East & Africa

Country Key Metric Key Driver
Saudi Arabia 11.5% CAGR (2026–2035) Vision 2030 food security, arid-climate biostimulants
UAE USD 0.18 Billion (2025) Controlled-environment agriculture biologicals
South Africa 35% of regional revenue (2025) Citrus and grape export biofungicide crop protection
Egypt 10.8% CAGR (2026–2035) Nile Delta soil health restoration programs
Rest of MEA USD 0.52 Billion (2025) Donor-funded biological soil treatment projects


South Africa leads MEA demand, driven by stringent EU import MRL requirements on citrus and table grape exports. Saudi Arabia's Vision 2030 food security initiative is channeling investment into biostimulant plant health products suited for arid and saline soils, while Egypt's agricultural modernization programs along the Nile Delta increasingly incorporate sustainable biological agriculture practices [19].


Regional Market Share
 

Competitive Benchmarking

The Agricultural Biologicals Market exhibits low concentration, with the top five players accounting for an estimated 28–34% of global revenue. The Herfindahl-Hirschman Index (HHI) sits below 600, reflecting a highly fragmented competitive field where specialty biological firms compete alongside diversified agrochemical multinationals. Strategic acquisitions have intensified since 2022, with legacy crop protection companies building dedicated biological divisions.

Company Est. Revenue Share Range Key Offerings for the Agricultural Biologicals Market Strategic Positioning
BASF SE ~5–8% Biostimulant plant health portfolio, Serifel biofungicide Integrated chemical-biological crop solutions
Bayer AG ~5–7% Biological seed treatments, bioinsecticide, biopesticide pipeline Crop science platform with digital integration
Corteva Agriscience ~4–7% Biologicals portfolio via Stoller acquisition, biostimulants Row crop biological soil treatment focus
Syngenta Group ~4–6% Biofungicide crop protection, Valagro biostimulants Sustainable biological agriculture innovation hub
UPL Ltd. ~3–5% NPP biological platform, bioinsecticide, biopesticide products Emerging market distribution strength
FMC Corporation ~3–5% BioPhero pheromone technology, biological crop protection Specialty biologicals differentiation
Novozymes (now Novonesis) ~2–4% Microbial inoculants, biostimulant plant health enzymes Fermentation technology leadership
Marrone Bio Innovations ~1–3% Regalia biofungicide, Grandevo bioinsecticide Pure-play biologicals innovator
Koppert Biological Systems ~1–3% Macro/micro-biological crop protection, pollination Integrated pest management specialist
Valagro (Syngenta) ~1–2% Biostimulant plant health specialty products Precision biostimulant formulations


Recent News & Developments


  • Bayer AG (October 2024): Announced a USD 200 million investment in a dedicated biologicals manufacturing facility in Berkeley, California, scaling bioinsecticide and biopesticide fermentation capacity [22].
  • Syngenta Group (August 2024): Received EU regulatory approval for three new biofungicide crop protection formulations under the Valagro brand, ahead of the 2025 growing season [6].
  • US EPA (June 2024): Finalized revised registration guidelines reducing biopesticide review timelines to under 10 months, effective January 2025 [8].
  • UPL Ltd. (April 2024): Entered a strategic partnership with Anuvia Life Sciences to develop enhanced-efficiency biological soil treatment products for Indian rice and wheat systems [9].
  • Government of India (February 2024): Announced a 40% increase in biofertilizer and biopesticide subsidy allocations under the 2024–25 Union Budget, totaling INR 12,800 crore [9].
  • FMC Corporation (2022) acquired BioPhero for nearly USD 200 million, adding pheromone-based bioinsecticide and biopesticide technology to its sustainable biological agriculture product line [23].


Agricultural Biologicals Market Report Scope

Parameter Detail
Market Scope Agricultural Biologicals Market — global, by Function, Crop Type, Geography
Study Period 2021–2035
CAGR (Forecast Period) 10.18% (2026–2035)
Market Size (Base Year 2025) USD 32.15 Billion
Market Size (2035) USD 80.47 Billion
Fastest Growing Segments Crop Protection (by Function); Horticultural Crops (by Crop Type); North America (by Region)
Companies Profiled 10 (BASF, Bayer, Corteva, Syngenta, UPL, FMC, Novonesis, Marrone Bio, Koppert, Valagro)
Valuation Currency USD Billion


FAQs

How do biological crop inputs compare to synthetic chemicals in cost per hectare for row crops?

Biological inputs typically cost 10–20% more per hectare than synthetic equivalents. Still, total program costs often decrease because biologicals reduce the need for follow-up chemical applications and lower input waste through precision dosing [16]. Integrated programs combining both input types frequently deliver the highest return per hectare.

What cold-chain infrastructure investments are needed to scale biological distribution in tropical regions?

Manufacturers are investing in lyophilized (freeze-dried) and encapsulated formulations that remain stable at ambient temperatures up to 35°C, reducing cold-chain dependency [14]. Modular, solar-powered cold storage units costing USD 15,000–25,000 per unit are also being deployed at regional distribution hubs across Sub-Saharan Africa.

Which Agricultural Biologicals Market segment offers the strongest margin profile for investors?

Biostimulant plant health products command gross margins of 55–65%, significantly above the 35–45% range typical of commodity biofertilizers, because proprietary microbial strains and formulation technologies create defensible pricing power [5].

How does the Agricultural Biologicals Market address resistance management in pest populations?

Biological pest control agents employ multi-modal mechanisms of action — parasitism, antibiosis, and competition — making single-target resistance development far less likely than with synthetic chemical actives [16]. Rotating biologicals with conventional inputs extends the useful life of both product categories.

What role does soil microbiome sequencing play in the Agricultural Biologicals Market?

Soil microbiome diagnostics allow growers to match specific microbial inoculants to field-level deficiencies, improving biological soil treatment efficacy by 20–30% compared to blanket applications [10]. Sequencing costs have fallen below USD 50 per sample, making routine soil biological profiling economically viable for commercial-scale operations.

Are there specific Agricultural Biologicals Market entry barriers for small and mid-size manufacturers?

Registration costs remain the primary barrier — obtaining multi-country biological product approvals can require USD 2–5 million and 3–5 years even under expedited pathways, which disproportionately burdens smaller innovators [17]. Strategic partnerships with established distributors help offset these costs.

How do carbon credit protocols value the adoption of biological inputs within the Agricultural Biologicals Market?

Verra's VM0042 and similar soil carbon methodologies credit biological input adoption as a qualifying practice change, generating 0.3–0.8 carbon credits per hectare annually, depending on baseline soil conditions [20]. Revenue from credit sales can offset 15–25% of a grower's annual biological input expenditure.


Author
Author
Author Profile
Snehal Singh LinkedIn
Manager - Research
High acumen in analyzing complex macro & micro markets with more than 6 years of work experience in the field of market research. By implementing her analytical skills in forecasting and estimation into market research reports, she has expertise in Packaging, Construction, and Equipment domains. She handles a team size of 20-25 resources and ensures smooth running of the projects, associated marketing activities, and client servicing.

Research Approach


Secondary Research

The secondary research process involved comprehensive analysis of regulatory databases, agricultural research journals, peer-reviewed publications, and authoritative agricultural organizations. Key sources included the US Environmental Protection Agency (EPA), United States Department of Agriculture (USDA), European Food Safety Authority (EFSA), Food and Agriculture Organization (FAO) of the United Nations, OECD-FAO Agricultural Outlook Database, European Commission DG Agriculture and Rural Development, California Department of Pesticide Regulation (CDPR), Pest Management Regulatory Agency (PMRA - Canada), Australian Pesticides and Veterinary Medicines Authority (APVMA), International Biocontrol Manufacturers Association (IBMA), Biopesticide Industry Alliance (BPIA), Insecticide Resistance Action Committee (IRAC), International Federation of Organic Agriculture Movements (IFOAM), National Institute of Food and Agriculture (NIFA), USDA National Agricultural Statistics Service (NASS), Eurostat Agricultural Database, and national ministry of agriculture reports from key markets. These sources were used to collect crop production statistics, regulatory approval data for biologicals, acreage trends, adoption rates of sustainable farming practices, commercial availability data for microbial and biochemical inputs, and competitive landscape analysis for biopesticides, bio-stimulants, and biofertilizers across different crop types and application methods.


Primary Research

To gather both qualitative and quantitative information, the primary research process involved interviewing players from both the supply and demand sides. Executives from biochemical, agricultural, and microbiological product firms as well as their commercial directors, heads of regulatory affairs, formulation scientists, and VPs of research and development were among the supply-side sources. The demand-side sources included professionals in the fields of agronomy and crop consulting, commercial growers, managers of agricultural cooperatives, farm owners and operators, procurement leads from large-scale agribusinesses, and distributors of solutions for plant nutrition and crop protection. We gathered insights on agricultural adoption patterns, application method preferences (foliar sprays, soil treatment, seed treatment), regional pricing strategies, and distribution channel dynamics through primary research. The research also validated market segmentation across crop types (cereals & grains, oilseeds & pulses, fruits & vegetables) and product pipeline timelines for microbial and biochemical innovations.

Primary Respondent Breakdown:

By Designation: C-level Primaries (32%), Director Level (30%), Others (38%)

By Region: North America (33%), Europe (30%), Asia-Pacific (28%), Rest of World (9%)


Market Size Estimation

Global market valuation was derived through revenue mapping and acreage/crop volume analysis. The methodology included:

Identification of 50+ key manufacturers across North America, Europe, Asia-Pacific, Latin America, and Middle East & Africa

Product mapping across biopesticides, bio-stimulants, and biofertilizers, further segmented by source type (microbials, biochemicals, others)

Analysis of reported and modeled annual revenues specific to agricultural biologicals portfolios

Coverage of manufacturers representing 68-73% of global market share in 2024

Extrapolation using bottom-up (crop acreage × application rate × ASP by country) and top-down (manufacturer revenue validation) approaches to derive segment-specific valuations by type, source, mode of application, and crop category

Download Free Sample

Kindly complete the form below to receive a free sample of this Report