Request Free Sample ×

Kindly complete the form below to receive a free sample of this Report

* Please use a valid business email

Leading companies partner with us for data-driven Insights

clients tt-cursor
Hero Background

Butter Market

ID: MRFR/FnB/2984-CR
163 Pages
Sakshi Gupta
Last Updated: May 28, 2026
Butter Market Size, Share, Industry Trend & Analysis Research Report Information By Product Type (Salted Butter, Unsalted Butter, Cultured/European-Style Butter, Clarified Butter/Ghee, Whipped/Spreadable Butter), By Distribution Channel (Supermarkets/Hypermarkets, Convenience Stores, Online/E-Commerce, Food Service/HoReCa, Specialty/Organic Stores), By End Use (Household/Retail, Bakery & Confectionery, Food Service, Food Processing/Industrial) - Forecast till 2035
Download PDF ×

We do not share your information with anyone. However, we may send you emails based on your report interest from time to time. You may contact us at any time to opt-out.


Butter Market Summary

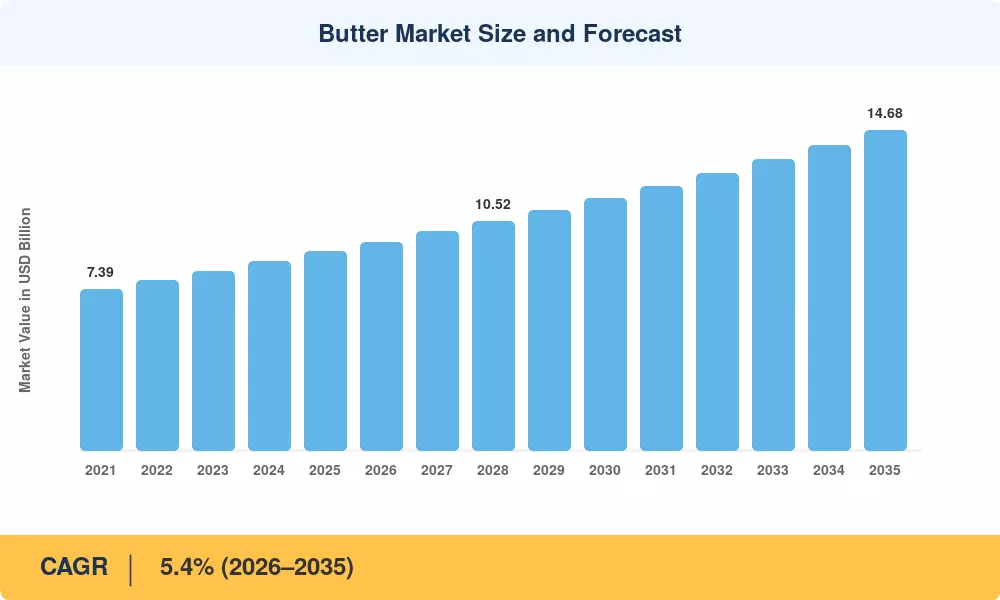
The global Butter Market reached an estimated USD 9.12 billion in 2025, with the forecast period beginning at USD 9.61 billion in 2026 and climbing to USD 14.68 billion by 2035 at a CAGR of 5.4%. Two forces anchor this trajectory: rising per-capita dairy fat consumption in developing economies and a decisive consumer pivot toward premium, minimally processed fats across North America and Western Europe. Government dairy-support programs — India's National Dairy Plan II alone allocated over USD 310 million for productivity upgrades — continue to underwrite supply-side expansion [2].

A quiet transformation is reshaping how butter reaches consumers. Industrial margarine and hydrogenated spreads, once dominant in food-service kitchens and retail shelves, are losing ground to cultured European-style butter, grass-fed organic butter, and clarified ghee butter product lines that command 20–40% price premiums. Retail private-label brands invested an estimated USD 1.4 billion globally in dairy-case reformulations between 2022 and 2024, accelerating the shift toward clean-label butter spreads food service channels now demand [3].

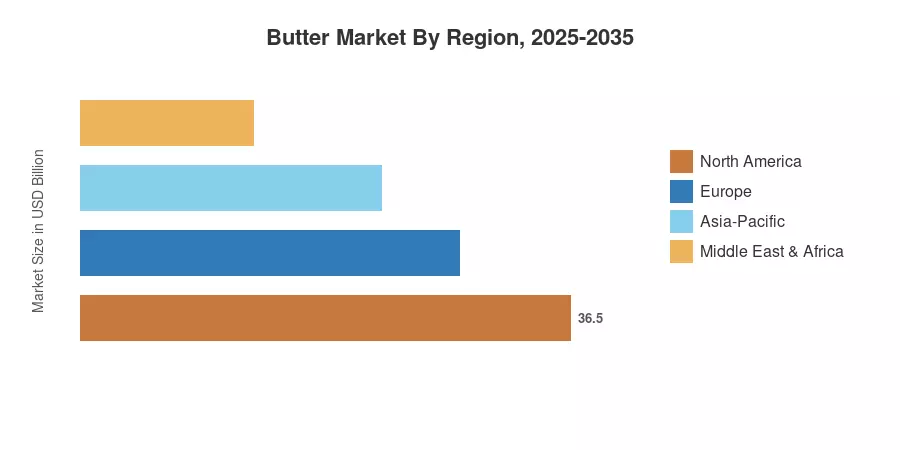
Europe holds the dominant share of the Butter Market at roughly 38%, driven by France, Germany, and Ireland's deeply embedded butter-centric culinary traditions. Asia-Pacific is the fastest-growing region with a projected CAGR of 6.8%, powered by India's expanding organized dairy sector and China's growing bakery segment. North America accounts for approximately 27% of global value, where the plant-based butter alternative category is adding competitive pressure that, paradoxically, has lifted awareness and overall category spending

Key Report Takeaways

• By Product Type

  • Salted butter commands the largest revenue share in the Butter Market at approximately 42%, reflecting its dominance in household and food-service applications
  • Cultured European-style butter is projected to grow at a CAGR of 7.1% through 2035, fueled by artisan bakery demand and premiumization trends
  • Clarified ghee butter product revenues reached an estimated USD 1.38 billion in 2025, driven by South Asian diaspora consumption and Ayurvedic wellness positioning

• By Distribution Channel

  • Supermarkets and hypermarkets account for roughly 51% of the Butter Market by value, though e-grocery channels are closing the gap
  • Butter spreads food service distribution is expanding at 5.9% CAGR as quick-service restaurants reformulate menus around real-butter positioning

• By Geography

  • Europe leads the Butter Market with a 38% share, anchored by EU Protected Designation of Origin programs
  • Asia-Pacific is growing at 6.8% CAGR, with India alone accounting for over 45% of regional volume
  • North America's Butter Market generates approximately USD 2.46 billion, with grass-fed organic butter as the fastest-growing sub-category

Market Size and Forecast (2021–2035)

MRFR's sizing methodology triangulates top-down revenue data from national dairy boards, FAO production statistics, and bottom-up channel audits across 32 countries. Historical values (2021–2024) are validated against customs trade data; forecast values (2026–2035) apply econometric modeling adjusted for demographic shifts, dietary trend indices, and commodity price scenarios.

Market Size Chart
Our Impact
Enabled $4.3B Revenue Impact for Fortune 500 and Leading Multinationals
Partnering with 2000+ Global Organizations Each Year
30K+ Citations by Top-Tier Firms in the Industry
 

Driver Impact Analysis

Driver ~% Impact on CAGR Geographic Relevance Impact Timeline
Premiumization and clean-label demand +1.2% North America, Europe Short-term (≤2 yr)
Rising bakery and confectionery output +0.9% Asia-Pacific, Europe Medium-term (2–4 yr)
Expanding organized dairy supply chains +0.8% Asia-Pacific, South America Long-term (≥4 yr)
Food-service butter reformulation +0.7% North America, Europe Short-term (≤2 yr)
Ghee and ethnic butter globalization +0.5% Middle East, North America Medium-term (2–4 yr)
E-commerce cold-chain expansion +0.4% Global Medium-term (2–4 yr)
Government dairy subsidies and trade policy +0.3% India, EU, New Zealand Long-term (≥4 yr)


Premiumization and Clean-Label Demand

Consumer rejection of hydrogenated oils has turned butter into a health-halo product. The U.S. clean-label dairy sector grew 14% year-over-year in 2024, with grass-fed organic butter leading the charge at USD 820 million in retail sales [3]. European retailers report that cultured European-style butter SKUs now occupy 22% of dairy-case shelf space, up from 15% in 2021. This premiumization trend lifts average selling prices across the Butter Market by an estimated 3–5% annually, compounding volume growth into disproportionate revenue gains.

Rising Bakery and Confectionery Output

The industrial and artisan bakeries globally utilized almost 2.8 million metric tons of butter in 2024, which represents around 31% of the total demand [8]. The bakery segment is growing for western-style patisserie culture in China, South Korea and Southeast Asia, at 8.2% annually for Asia-Pacific. Growing prospects for the regional Butter Market include croissant and puff pastry making, which need European-style butter with high fat content (>= 82% butterfat). [8]


Food-Service Butter Reformulation

Consumer demand is driving quick-service and casual-dining restaurants to switch from margarine to genuine butter. [11] McDonald's 2023 vow to switch to genuine butter in its European operations — more than 7,500 stores — was a harbinger of a larger food-service trend. Butter spreads’ food service distribution channels in North America gained 12% between 2022 and 2024. MRFR projects the segment’s above-market growth will continue through 2030 as mid-tier restaurant chains enter the market[11].


Expanding Organized Dairy Supply Chains

India’s cooperative dairy system, headed by Amul and backed by more than 190,000 village-level collecting centres, processed 210 million metric tons of milk in 2024 [2]. The government’s investment in cold-chain infrastructure under the Pradhan Mantri Kisan Sampada Yojana program has resulted in an estimated 8% reduction in post-harvest dairy losses, providing extra raw material for the manufacture of butter and clarified ghee butter products. This supply-side buildout [2] is providing a long-term structural tailwind for the Butter Market in South Asia.


Restraints Impact Analysis

Restraint impacts represent directional headwinds to the Butter Market CAGR. Like driver impacts, they are modeled through multivariate frameworks and are not directly subtractable from the gross growth rate.

Restraint ~% Impact on CAGR Geographic Relevance Impact Timeline
Dairy fat health concerns and dietary guidelines –0.6% North America, Europe Long-term (≥4 yr)
Plant-based butter alternative competition –0.5% North America, Europe Medium-term (2–4 yr)
Milk price volatility and feed cost inflation –0.4% Global Short-term (≤2 yr)
Lactose intolerance prevalence in Asia –0.3% Asia-Pacific Long-term (≥4 yr)
Regulatory limits on dairy fat in school meals –0.2% North America, Europe Medium-term (2–4 yr)


Plant-Based Butter Alternative Competition

The plant-based butter alternative category reached an estimated USD 1.9 billion globally in 2024, growing at roughly 9% annually [12]. Brands like Miyoko's, Upfield's Flora, and Country Crock Plant Butter have secured meaningful retail shelf space — particularly among younger consumers identifying as flexitarian. While the Butter Market has proven resilient (dairy butter volumes have not declined in absolute terms), the plant-based butter alternative segment diverts incremental spending growth away from traditional dairy butter in premium retail channels [12].

Milk Price Volatility

Global milk prices swung by over 30% between 2022 and 2024, driven by feed-cost inflation, drought in New Zealand, and EU quota adjustments [5]. For butter processors operating on thin margins — particularly in commodity-grade production — this volatility compresses profitability and discourages capacity investment. The Butter Market's mid-stream manufacturers in South America and Southeast Asia are especially exposed, as hedging instruments remain underdeveloped in these regions [5].

Dairy Fat Health Concerns

Despite the rehabilitation of saturated fat in recent nutritional science, several government dietary guidelines — including the U.S. Dietary Guidelines for Americans 2025 update — continue to recommend limiting saturated fat to under 10% of daily calories [15]. This persistent messaging creates a demand ceiling for butter consumption among health-conscious demographics, particularly in North America where grass-fed organic butter and cultured European-style butter must compete not just on taste but on nutritional positioning [15].


Opportunities

Premium Ghee Expansion in Western Markets

Clarified ghee butter product sales in the United States grew 23% in 2024, crossing USD 420 million at retail [10]. The convergence of Ayurvedic wellness trends, keto/paleo dietary movements, and high-smoke-point cooking applications positions ghee as the Butter Market's most scalable cross-cultural opportunity. Brands that secure mainstream grocery placement — beyond ethnic food aisles — stand to capture a fast-growing share of the overall dairy fats category

Food-Service Private-Label Butter Programs

Large food-service distributors like Sysco, US Foods, and Bidfood are developing proprietary butter spreads food service lines to capture margin from branded alternatives [11]. This private-label wave creates partnership opportunities for butter processors willing to co-manufacture. The Butter Market's B2B segment is less price-sensitive than retail, offering processors 15–20% higher margins on contract manufacturing versus commodity spot sales

E-Commerce and Direct-to-Consumer Dairy

Cold-chain-capable e-commerce platforms grew their dairy category GMV by 28% in 2024 [14]. Artisan and small-batch producers of cultured European-style butter — who lack traditional retail distribution — can now reach consumers directly. The Butter Market's D2C segment, while still under 4% of total sales, is growing three times faster than traditional retail channels, especially in the United States, UK, and India

Emerging Market Urbanization in Africa

Sub-Saharan Africa's urban population is projected to double by 2050, and butter consumption per capita in urban Nigeria, Kenya, and South Africa already exceeds rural rates by 4–6x [13]. The Butter Market opportunity in Africa hinges on cold-chain buildout and local dairy processing investment, with the African Development Bank allocating USD 1.2 billion to dairy value chains between 2024 and 2030 [13]

Sustainability Certification and Carbon-Labeled Butter

European retailers are increasingly requiring carbon footprint labeling on dairy products. By 2027, an estimated 35% of EU butter SKUs will carry environmental impact scores [18]. Producers who invest early in regenerative grazing practices and verified carbon credits for their grass-fed organic butter lines can command premium positioning in the Butter Market — converting sustainability compliance into a competitive moat rather than a cost burden


Future Outlook

Precision Dairy and Farm-Level Analytics

The next decade will see data-driven dairy farming reshape butter supply chains. IoT-enabled milk quality sensors, AI-powered herd management platforms, and blockchain-based traceability systems are projected to reduce raw milk variability by 15–20% by 2030, directly improving butter consistency and yield [23]. For the Butter Market, this translates into more predictable supply, tighter cost management, and credible provenance claims that support premium pricing for grass-fed organic butter and single-origin products.

Sustainability Reporting and Scope 3 Dairy Emissions

Dairy's carbon footprint is under increasing scrutiny. The EU's Corporate Sustainability Reporting Directive will require Scope 3 emissions disclosure from butter manufacturers by 2028, covering everything from farm methane to retail refrigeration [18]. Producers in the Butter Market who invest in methane-capture technology, regenerative grazing, and verified carbon offsets will be better positioned to maintain retail shelf access in Europe — where sustainability compliance is becoming a de facto trade barrier.

Convergence of Butter and Plant-Based Categories

Rather than displacement, the Butter Market is moving toward category convergence. Hybrid butter-plant blends — combining dairy butterfat with oat or coconut oil — are emerging as a bridge product for flexitarian consumers. Upfield and Arla both launched hybrid spreads in 2024, and MRFR projects this sub-segment will reach USD 600 million globally by 2030 [12]. The plant-based butter alternative category, meanwhile, is plateauing in growth rate as novelty fades and dairy butter reasserts its culinary superiority.

Food-Service Automation and Portion-Control Butter

Automated food-service kitchens are creating demand for precision-portioned butter formats — individually wrapped pats, squeezable tubes, and spray-on clarified ghee butter product. This packaging-driven innovation adds 10–15% revenue per unit compared to bulk butter and aligns with food-service operators' waste-reduction targets [11]. The Butter Market's food-service segment is poised to outgrow retail on a percentage basis through 2035, driven by butter spreads food service innovation and QSR menu reformulation.


Market Segmentation

By Product Type

Segment Key Metric Primary Demand Driver
Salted Butter 42% share Household cooking and table use
Unsalted Butter 5.7% CAGR Industrial bakery and pastry demand [8]
Cultured/European-Style Butter USD 1.24 B (2025) Artisan food movement; premiumization [9]
Clarified Butter/Ghee 6.9% CAGR Ethnic cuisine globalization; health-halo positioning [10]
Whipped/Spreadable Butter USD 0.87 B (2025) Convenience-driven household adoption


Salted butter remains the backbone of the Butter Market, dominant in household kitchens and food-service establishments worldwide. Its ubiquity, however, masks the faster growth occurring in specialty segments. Cultured European-style butter — produced through bacterial fermentation that creates a tangy, complex flavor — has moved beyond niche artisan channels into mainstream supermarkets. Retailers report that cultured butter SKUs generate 2.5x the margin per linear foot compared to commodity salted butter, incentivizing expanded shelf allocation [9].

Clarified ghee butter product represents the Butter Market's most culturally dynamic segment. Once confined to South Asian kitchens, ghee has gained traction in Western wellness communities for its high smoke point, lactose-free profile, and Ayurvedic health associations. The segment's 6.9% CAGR reflects both diaspora demand and crossover adoption by mainstream consumers seeking grass-fed organic butter derivatives [10].

By Distribution Channel

Segment Key Metric Primary Demand Driver
Supermarkets/Hypermarkets 51% share One-stop shopping; broadest SKU assortment
Convenience Stores USD 0.64 B (2025) Impulse purchase; single-serve formats
Online/E-Commerce 8.2% CAGR Cold-chain logistics improvements; D2C artisan brands [14]
Food Service/HoReCa 5.9% CAGR Restaurant butter reformulation; butter spreads food service [11]
Specialty/Organic Stores USD 0.52 B (2025) Grass-fed organic butter; curated premium assortment [3]


The Butter Market's distribution landscape is shifting as e-commerce cold-chain capabilities mature. Online dairy sales grew 28% globally in 2024, and direct-to-consumer platforms are enabling small-batch producers of grass-fed organic butter and cultured European-style butter to bypass traditional retail gatekeepers. Meanwhile, butter spreads food service distribution is being reshaped by centralized procurement platforms that aggregate restaurant demand and negotiate directly with processors [14].

By End Use

Segment Key Metric Primary Demand Driver
Household/Retail 54% share Daily cooking, baking, and table use
Bakery & Confectionery 7.0% CAGR Industrial croissant, pastry, and cake production [8]
Food Service USD 1.87 B (2025) Restaurant, hotel, and institutional butter consumption [11]
Food Processing/Industrial 4.8% CAGR Ingredient butter for processed foods, sauces, ready meals


Household consumption anchors the Butter Market in absolute volume, but industrial and food-service end uses are growing faster. The bakery and confectionery segment's 7.0% CAGR reflects a global expansion of Western-style pastry culture — particularly in Asia-Pacific where croissant production has become a bellwether for butter demand. Food-service consumption of the Butter Market is increasingly premium-oriented, with restaurants specifying cultured European-style butter and clarified ghee butter product as menu differentiators rather than generic commodity inputs.


Regional Market Share Analysis

Region Key Metric Primary Investment Themes
Europe 38% share (2025) PDO butter exports, cultured European-style butter premiumization
North America USD 2.46 B (2025) Grass-fed organic butter, plant-based butter alternative coexistence
Asia-Pacific 6.8% CAGR Bakery-sector expansion, clarified ghee butter product scaling
South America USD 0.73 B (2025) Dairy cooperative modernization, export-grade butter production
Middle East & Africa 5.1% CAGR Urban demand growth, cold-chain infrastructure investment
**Total** **USD 9.12 B (2025)**  

The Butter Market's regional landscape reflects deep structural differences in dairy traditions, dietary norms, and supply-chain maturity. Europe's entrenched butter culture gives it a commanding share, while Asia-Pacific's rapid urbanization and rising disposable incomes make it the growth engine for the next decade.


Europe

Country Key Metric Key Driver
France 24% of regional share PDO butter heritage; Beurre d'Isigny, Beurre de Charentes [9]
Germany USD 0.62 B Bakery-sector demand; industrial butter processing scale [8]
Ireland 7.2% CAGR Kerrygold-led grass-fed export boom [19]
Rest of Europe 34% of regional share Eastern European dairy modernization


Europe's Butter Market benefits from centuries of culinary tradition reinforced by modern regulatory protections. The EU's Protected Designation of Origin framework covers over 40 butter products, creating natural barriers to substitution and sustaining price premiums of 30–50% over commodity grades. France alone exports over 120,000 metric tons of butter annually, with cultured European-style butter accounting for a growing share of shipments to North America and Asia [9].

North America

Country Key Metric Key Driver
United States 82% of regional share Clean-label demand; grass-fed organic butter growth [3]
Canada 5.3% CAGR Supply management reform; artisan butter segment [20]
Mexico USD 0.11 B Rising middle-class bakery consumption


The North American Butter Market is defined by a premiumization-driven split: commodity butter volumes remain flat, while grass-fed organic butter and cultured European-style butter drive nearly all incremental revenue. U.S. butter consumption reached 6.5 pounds per capita in 2024 — the highest level since 1965 — as consumers abandoned margarine in favor of whole, recognizable ingredients. The plant-based butter alternative segment adds competitive intensity but has not eroded dairy butter's absolute volume [#3, #7].

Asia-Pacific

Country Key Metric Key Driver
India 46% of regional share Cooperative dairy networks; clarified ghee butter product dominance [2]
China 8.4% CAGR Western-style bakery expansion; hotel and food-service growth [8]
Japan USD 0.41 B Premium butter scarcity; high import dependence [21]
Rest of Asia-Pacific 5.9% CAGR Southeast Asian food-service modernization


Asia-Pacific represents the highest-growth opportunity in the Butter Market. India's organized butter and ghee sector — led by Amul's USD 7.5 billion parent cooperative, GCMMF — is professionalizing rapidly, with branded butter replacing loose/unpackaged ghee in urban retail channels. China's butter imports grew 11% annually between 2020 and 2024, reflecting a structural shift in food-service demand as Western-style bakeries and hotel chains expand into tier-2 and tier-3 cities [8].

South America

Country Key Metric Key Driver
Brazil 58% of regional share Domestic dairy-sector growth; bakery modernization
Argentina 6.1% CAGR Export-oriented grass-fed butter production [22]
Rest of South America USD 0.14 B Modest but steady urbanization-driven demand


South America's Butter Market remains relatively concentrated, with Brazil accounting for the majority of regional value. Argentine grass-fed butter has emerged as a niche export commodity, competing with New Zealand and Irish products on quality credentials. Dairy cooperatives in southern Brazil are investing in butter processing capacity to capture domestic demand that previously relied on imports [22].

Middle East & Africa

Country Key Metric Key Driver
South Africa 31% of regional share Organized retail expansion; Western dietary adoption [13]
UAE 6.3% CAGR Food-service and hospitality-driven butter demand
Rest of MEA USD 0.29 B Emerging urban middle-class consumption [13]


The Middle East & Africa Butter Market is small in absolute terms but growing steadily. Butter spreads food service demand in the UAE and Saudi Arabia is tied directly to the region's hospitality boom — Dubai alone added over 15,000 hotel rooms between 2022 and 2025. Sub-Saharan Africa's opportunity is longer-dated, contingent on cold-chain infrastructure and local dairy processing investment [13].

Regional Market Share
 

Competitive Benchmarking

The Butter Market is moderately fragmented, with an estimated HHI of approximately 650 and the top five players holding a combined 28–32% revenue share. The competitive field spans multinational dairy conglomerates, farmer-owned cooperatives, and regional specialists. Scale advantages in milk procurement and cold-chain logistics coexist with niche differentiation in premium segments where artisan producers of grass-fed organic butter and cultured European-style butter punch above their weight.

Company Est. Revenue Share Range Key Offerings for Butter Market Strategic Positioning
Lactalis Group ~6–8% Président, Bridel, Galbani butter European premium; global export scale [24]
Arla Foods ~5–7% Lurpak, Arla organic butter Cooperative model; sustainability leadership [19]
Fonterra ~4–6% Anchor, Mainland butter New Zealand grass-fed; Asia-Pacific export focus [25]
Amul (GCMMF) ~4–6% Amul Butter, Amul Ghee Indian cooperative dominance; volume leadership [2]
Land O'Lakes ~3–5% Land O'Lakes branded butter U.S. cooperative; food-service distribution strength [3]
Ornua (Kerrygold) ~3–4% Kerrygold Irish butter Grass-fed premium positioning; U.S. growth story [19]
Saputo Inc. ~2–4% Dairyland, Scotsburn butter Canadian dairy; North American industrial supply [20]
Upfield Group ~2–3% Flora, Country Crock Plant Butter Plant-based butter alternative leader; hybrid innovation [12]
Savencia Fromage & Dairy ~1–3% Elle & Vire, Caprice des Dieux French premium; butter spreads food service focus [9]
Miyoko's Creamery ~1–2% Miyoko's European-style vegan butter Premium plant-based butter alternative; D2C pioneer [12]


Recent News & Developments


  • Kerrygold/Ornua (January 2025): Reported 18% year-over-year U.S. sales growth, surpassing USD 500 million in annual North American revenue. Expanded grass-fed organic butter SKU range to 14 products [19].
  • Amul (November 2024): Commissioned a new butter and ghee processing plant in Gujarat with 200 metric tons/day capacity, the largest single-facility expansion in the Butter Market's history [2].
  • USDA (July 2024): Updated the Dairy Margin Coverage program, increasing maximum coverage to USD 9.50/cwt for 2025, providing enhanced margin protection for U.S. butter producers [17].
  • Lactalis Group (April 2024): Acquired a majority stake in a Bulgarian dairy cooperative, adding 35,000 metric tons of butter production capacity to its Eastern European network [24].
  • Fonterra (February 2024): Signed a five-year supply agreement with a major Chinese bakery chain for 15,000 metric tons of annual butter shipments, deepening its Asia-Pacific Butter Market presence [25].
 

Report Scope

Parameter Detail
Market Scope Global Butter Market, including salted, unsalted, cultured, clarified/ghee, and spreadable butter
Study Period 2021–2035
CAGR 5.4% (2026–2035)
Market Size Checkpoints USD 9.12 B (2025); USD 9.61 B (2026); USD 14.68 B (2035)
Fastest Growing Segments Cultured European-style butter (by type); Asia-Pacific (by region)
Companies Profiled 10 (Lactalis, Arla, Fonterra, Amul, Land O'Lakes, Ornua, Saputo, Upfield, Savencia, Miyoko's)
Valuation Currency USD (constant 2025 dollars)


FAQs

How does butter's shelf life compare across salted, unsalted, and clarified formats for procurement planning?

Salted butter retains quality for 4–5 months refrigerated, unsalted for 2–3 months, and clarified ghee butter product for 9–12 months at room temperature. Procurement managers should align order cycles to these windows to minimize waste.

What certifications should food-service buyers prioritize when sourcing grass-fed organic butter?

USDA Organic and AGA (American Grassfed Association) certifications verify feed and pasture standards. EU-origin butter carrying PDO marks provides equivalent assurance for cultured European-style butter sourcing [3].

How are tariff structures affecting cross-border butter trade in the Butter Market?

EU butter exports face 15–25% tariffs entering key Asian destinations, while New Zealand benefits from preferential access under RCEP. Tariff arbitrage shapes sourcing decisions for large-scale food-service importers [9].

What cold-chain requirements differentiate butter logistics from other dairy categories?

Butter demands consistent 0–4°C storage and segregated transport to prevent flavor absorption. Clarified ghee butter product is the exception, tolerating ambient shipping up to 25°C [14].

How does the Butter Market respond to sudden milk-supply disruptions like drought or disease outbreaks?

Butter is typically the first dairy product curtailed during supply shortfalls because processors redirect milk to higher-margin cheese and powder. Buyers should maintain 8–12 weeks of strategic inventory as a buffer [5].

What role do private-label brands play in the competitive dynamics of the Butter Market?

Private-label butter holds 35–40% of retail volume in Europe and 25–30% in North America. Retailer-owned brands compress branded margins but expand total category penetration by lowering entry-price points.

Are hybrid dairy-plant butter blends a passing trend or a durable segment within the Butter Market?

Early sales data from Arla and Upfield hybrid launches suggest 15–20% repeat-purchase rates among flexitarian buyers. The segment targets consumers unwilling to fully commit to plant-based butter alternative products [12].


Author
Author
Author Profile
Sakshi Gupta LinkedIn
Team Lead - Research
Currently a Team Lead in consumer goods, FMCG, and F&B, she translates rigorous research into decisive strategy. She develops GTM roadmaps, pricing architectures, and competitive benchmarks for companies across Europe, the US, and APAC. She synthesize insights, align cross-functional teams, and drive execution from brief to measurable outcomes. She leads end-to-end engagements with crisp analysis, compelling storytelling, and a strong command of Power BI, Tableau, SQL, and advanced research platforms.

Research Approach


Secondary Research

The secondary research process involved comprehensive analysis of regulatory databases, peer-reviewed food science journals, dairy industry publications, and authoritative agricultural organizations. Key sources included the US Food & Drug Administration (FDA), European Food Safety Authority (EFSA), US Department of Agriculture (USDA), Food and Agriculture Organization of the United Nations (FAOSTAT), International Dairy Federation (IDF), Dairy Management Inc., American Dairy Science Association (ADSA), European Dairy Association (EDA), National Dairy Council (NDC), Agriculture and Agri-Food Canada (AAFC), Food Standards Australia New Zealand (FSANZ), CODEX Alimentarius Commission, National Bureau of Statistics of China, National Dairy Development Board (NDDB) India, EU Eurostat Agricultural Database, USDA Economic Research Service (ERS), Journal of Dairy Science, Food Chemistry, International Journal of Dairy Technology, and national agricultural ministry reports from key dairy-producing markets. These sources were used to collect production statistics, dairy herd data, processing capacity metrics, regulatory compliance standards, trade flow analysis, consumer price indices, and market landscape analysis for standard butter, clarified butter, whipped butter, and specialty butter segments across salted and unsalted categories.


Primary Research

To gather both qualitative and quantitative information, the primary research process involved interviewing players from both the supply and demand sides. Executives from commercial dairy processors, butter producers, private label producers, cooperatives, and R&D directors were among the supply-side sources. On the demand side, we heard from people like bakery and confectionery company directors, snack food company R&D heads, retail grocery chain category managers, foodservice distributor purchasing managers, restaurant chain executive chefs, and institutional catering services' dairy buyers. Market segmentation was confirmed through primary research across spreads, blocks, and liquid oil forms. New product pipeline timelines were also confirmed. Insights regarding ingredient sourcing strategies, butter-fat pricing dynamics, cold chain logistics, patterns of adoption between private label and branded products, and clean-label sustainability certifications were gathered.

Primary Respondent Breakdown:

By Designation: C-level Primaries (28%), Director Level (32%), Others (40%)

By Region: North America (32%), Europe (30%), Asia-Pacific (25%), Rest of World (13%)


Market Size Estimation

Global market valuation was derived through revenue mapping and production volume analysis. The methodology included:

Identification of 60+ key dairy processors and butter manufacturers across North America, Europe, Asia-Pacific, Latin America, and Oceania

Product mapping across standard butter, clarified butter (ghee), whipped butter, and specialty/cultured butter categories, covering salted, unsalted, organic, and grass-fed variants

Analysis of reported and modeled annual revenues specific to butter and spreads portfolios, including private label manufacturing volumes

Coverage of manufacturers and cooperatives representing 75-80% of global market share in 2024

Extrapolation using bottom-up (production volume × average selling price by country/region, adjusted for trade flows and inventory changes) and top-down (manufacturer revenue validation, herd size estimates × yield per cow × butterfat conversion rates) approaches to derive segment-specific valuations for food processing, foodservice, and retail end-use channels

Download Free Sample

Kindly complete the form below to receive a free sample of this Report