Clinical Decision Support Systems Market (2026 - 2035)

Clinical Decision Support Systems Market Research Report: Size, Share, Trend Analysis By Component (Software, Hardware, Services), By Deployment Mode (On-Premise, Cloud-Based, Web-Based), By End Users (Hospitals, Clinics, Pharmacies, Research Institutions), By Applications (Diagnostic Support, Therapeutic Support, Preventive Support) and By Regional (North America, Europe, South America, Asia Pacific, Middle East and Africa) - Growth Outlook & Industry Forecast 2025 To 2035

Forecast Period
2026-2035
CAGR
11.1%
2025 Market Size
USD 2.86 Billion
2035 Market Size
USD 8.20 Billion
Healthcare ● Updated August 24, 2026 Report ID: MRFR/HC/4580-CR | Pages: 200 | Author: Rahul Gotadki, Satyendra Maurya

Clinical Decision Support Systems Market Summary

The Clinical Decision Support Systems Market was valued at USD 2.86 Billion in 2025 and opens the forecast window at USD 3.18 Billion in 2026, climbing to USD 8.20 Billion by 2035 at an 11.1% CAGR. Growth is not speculative here — it is anchored to enforceable policy. The 21st Century Cures Act information-blocking provisions, fully enforced by U.S. federal agencies since 2024, made structured data exchange a compliance obligation rather than an IT preference [1]. Meanwhile, the European Health Data Space regulation, adopted in 2025, obliges member states to build interoperable clinical data infrastructure — the substrate on which advisory logic runs [2].

Hospitals are retiring rules engines that were essentially hard-coded lookup tables. What replaces them is probabilistic, retrainable, and increasingly embedded directly in the electronic health record rather than bolted alongside it. The U.S. Department of Health and Human Services committed over USD 1.9 billion to health IT modernization and data infrastructure across FY2023–FY2025 [3]. At the same time, private capital added roughly USD 3.4 billion to clinical AI vendors over the same stretch [4]. Legacy standalone alerting tools are losing budget share to integrated, cloud-delivered platforms.

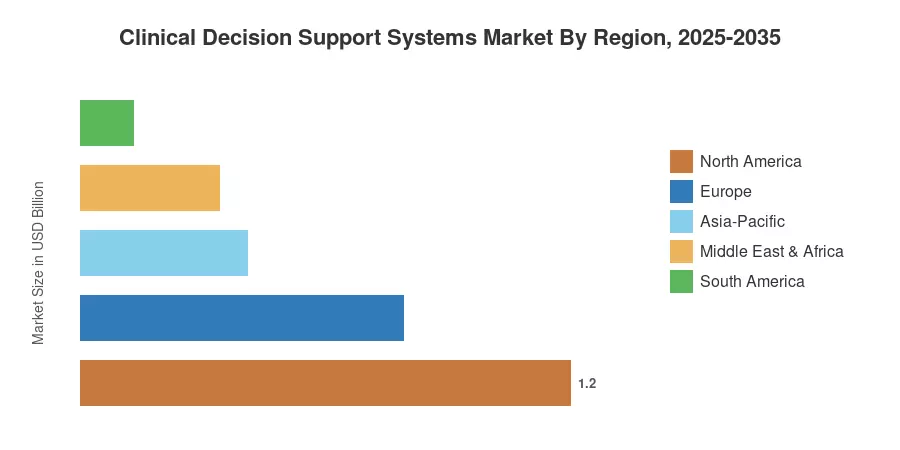
North America holds 41.8% of the Clinical Decision Support Systems Market, sustained by CMS quality-payment linkage and dense EHR penetration. Asia-Pacific grows fastest at a 14.2% CAGR through 2035, propelled by national digital-health missions in India, China and ASEAN. Europe follows North America at 27.5%, where reimbursement for AI-assisted diagnostics is being written into national fee schedules. The next decade belongs to vendors who can prove clinical outcomes, not feature counts.


Key Report Takeaways

• By Model

  • Knowledge-Based CDSS retains 71.6% of the Clinical Decision Support Systems Market in 2025, but its lead narrows as machine-learning inference matures.
  • Non-Knowledge CDSS expands at a 14.9% CAGR, the fastest technology trajectory in the study.


• By Component

  • Software accounts for 62.8% of component revenue, reflecting the platform-centric economics of the Clinical Decision Support Systems Market.
  • Services contribute a 12.6% CAGR, driven by implementation, content curation and model-governance retainers.


• By Region

Market Size and Forecast (2021–2035)

Figures below blend vendor revenue disclosures, hospital IT procurement filings, national health-IT budget appropriations and a bottom-up install-base model covering acute, ambulatory and payer settings. Historical years are reconciled against audited segment reporting where vendors disclose health-IT revenue separately; forecast years apply adoption-curve weighting by region and care setting.
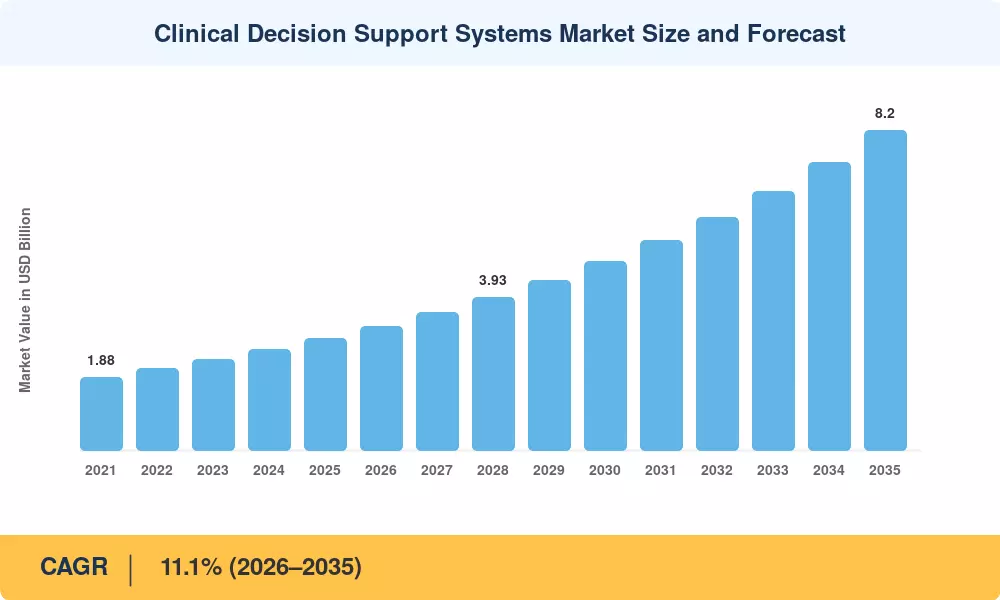
Clinical Decision Support Systems Market Size and Forecast
Our Impact
Enabled $4.3B Revenue Impact for Fortune 500 and Leading Multinationals
Partnering with 2000+ Global Organizations Each Year
30K+ Citations by Top-Tier Firms in the Industry

Driver Impact Analysis

Driver ~% Impact on CAGR Geographic Relevance Impact Timeline
Interoperability mandates and information-blocking enforcement +2.1 North America, Europe Short-term (≤2 yr)
Machine-learning inference embedded in clinical workflow +2.6 Global Medium-term (2–4 yr)
Medication-error and patient-safety cost burden +1.8 Global Short-term (≤2 yr)
Value-based and quality-linked reimbursement +1.5 North America, Europe Medium-term (2–4 yr)
Cloud and SaaS licensing economics +1.3 Asia-Pacific, Europe Medium-term (2–4 yr)
Clinician shortage and cognitive-load reduction +1.1 Global Long-term (≥4 yr)
National digital-health programs in emerging economies +0.9 Asia-Pacific, MEA Long-term (≥4 yr)


Regulatory Enforcement Converts Optional Integration into Obligation

Information-blocking penalties reshaped procurement logic across the Clinical Decision Support Systems Market. U.S. rules finalized in 2023 exposed non-compliant actors to civil monetary penalties of up to USD 1 million per violation, with disincentives for providers taking effect in 2024 [1]. Health systems responded by prioritizing platforms that expose FHIR-native APIs, because advisory logic that cannot ingest external records produces incomplete recommendations. Procurement committees now treat API maturity as a gating criterion rather than a differentiator.

Machine Learning Moves from Pilot to Production

Deployment economics changed once inference costs fell far enough to run models continuously against live encounter data. Peer-reviewed evaluations published across 2023–2025 reported diagnostic sensitivity improvements in the range of 8–14 percentage points for sepsis and deterioration prediction when validated models supplemented rules-based triggers [7]. That evidence base matters commercially: hospital boards approve capital for tools with published outcome deltas, not demonstrations.

Patient-Safety Economics Justify the Spend

Preventable medication errors impose an estimated USD 21 billion annual cost on the U.S. health system alone, with adverse drug events implicated in roughly 700,000 emergency department visits each year [8]. When a platform demonstrably reduces prescribing errors by even a modest margin, the payback period compresses below three years for a mid-sized system. Chief financial officers, not clinical informaticists, increasingly own this business case.

Reimbursement Recognition Creates a Revenue Line

Payment policy finally caught up with the technology. Several national schedules introduced or expanded codes covering algorithm-assisted diagnostic interpretation between 2023 and 2025, with per-use payment bands that made deployment revenue-positive in imaging-heavy and cardiology service lines [6]. That shift transformed advisory software from an overhead item into an asset with measurable contribution margin.


Restraints Impact Analysis

Restraint ~% Impact on CAGR Geographic Relevance Impact Timeline
Alert fatigue and high override rates −1.4 Global Short-term (≤2 yr)
Integration cost and legacy record fragmentation −1.2 Europe, Asia-Pacific Medium-term (2–4 yr)
Regulatory ambiguity over adaptive clinical algorithms −0.9 Global Medium-term (2–4 yr)
Liability exposure and clinical governance gaps −0.7 North America, Europe Long-term (≥4 yr)
Data quality and terminology normalization deficits −0.6 Emerging markets Long-term (≥4 yr)


Override Rates Undermine the Value Proposition

Studies of inpatient prescribing consistently find clinicians dismiss between 49% and 96% of drug-interaction warnings depending on alert class and specialty [12]. Every ignored prompt erodes the measurable benefit a system was purchased to deliver, and procurement teams have grown skeptical of vendors who cannot produce override telemetry from reference sites. Tiered severity design and specialty-specific suppression are now table stakes.

Integration Economics Punish Fragmented Estates

Deployment costs scale with the number of source systems, not the number of users. Hospitals running three or more distinct record platforms report integration spending equal to 1.4 to 2.1 times the advisory software license itself [9]. In much of continental Europe and Southeast Asia, where regional record estates remain heterogeneous, that multiplier delays purchase decisions by two to four quarters.

Adaptive Algorithms Sit in Regulatory Grey Space

Regulators have published guidance on predetermined change-control plans for adaptive software, yet no jurisdiction has settled how a continuously retrained clinical model retains its authorization [13]. Vendors respond by freezing model weights between formal releases — safer legally, slower clinically. That conservatism suppresses the performance advantage that made machine-learning approaches attractive in the first place.


Clinical Decision Support Systems Market Opportunities

Specialty-Depth Modules Beyond General Medicine

The Clinical Decision Support Systems Market is still dominated by general inpatient care. Oncology, transplant medicine and uncommon disease are still under-served, yet these are precisely the areas where physician uncertainty is greatest and guideline churn is fastest. Vendors can increase average contract value 20-35% without new platform engineering by licensing curated specialist content and pricing it as an add-on.


Emerging-Market National Tenders

India’s Ayushman Bharat Digital Mission has created over 750 million health account identifiers, creating a national data layer upon which advisory tools can sit [11]. Similar programs in Saudi Arabia, Indonesia and Brazil are run at the ministry level, not hospital by hospital. A single national tender win provides an install-base scale that would take 10 years to build by selling to individual hospitals.


De-identified Outcome Data as a Commercial Asset

The longitudinal evidence corpus builds up in platforms with millions of recommendation-and-outcome pairs. Selling to life-science sponsors for real-world evidence gathering under controlled, de-identified terms provides a second revenue stream, with near-zero marginal cost. Already, a number of suppliers estimate gross margins for data-licensing in excess of 70% [16]. The technology isn’t the constraint — consent architecture is.


Payer-Side Deployment

Utilization management is being re-engineered around the same evidence-based decision tools clinicians use at the bedside, so payers and providers may argue from a shared rulebook rather than conflicting ones. Insurers in North America and Europe are acquiring advisory engines to automate prior-authorization review. This segment was hardly counted five years ago in the Clinical Decision Support Systems Market. Faster determinations minimize the administrative expense to both sides of the contract.


Ambient Capture Convergence

Ambient documentation tools already sit in the exam room capturing the encounter. Fusing that transcript stream with advisory logic lets recommendations surface mid-conversation instead of after the note is signed. The vendor that owns both layers controls the clinician's attention at the only moment it can be usefully redirected.


Clinical Decision Support Systems Market Future Outlook

Autonomous Advisory Loops

By the early 2030s, a meaningful share of low-acuity recommendations will execute without explicit clinician confirmation — dose adjustments within protocol bands, routine screening orders, standing follow-up scheduling. Autonomy will arrive stratified by risk class, not all at once. The governance question is who audits a recommendation nobody explicitly approved, and that answer will be written by regulators rather than vendors [13].

Platform Economics Displace Point Solutions

Consolidation logic in the Clinical Decision Support Systems Market is straightforward: integration cost is the largest line item, so buyers reward vendors who reduce the number of interfaces. Expect standalone advisory tools to be acquired or bundled, with record vendors capturing an increasing share of advisory spend. Independent vendors survive by owning content depth that platform incumbents cannot economically curate.

Evidence Generation as Infrastructure

Regulators increasingly accept real-world evidence in post-market surveillance and label expansion decisions. Advisory platforms sit on exactly the recommendation-outcome linkage that such evidence requires. Over the next decade, the data layer beneath these systems will likely be valued independently of the software itself.

Governance, Equity and Model Accountability

Algorithmic bias moved from academic concern to procurement checklist item after documented disparities in risk-scoring performance across patient populations [21]. Health systems now request subgroup performance disclosure before signing. Vendors that publish stratified validation results will win institutional tenders; those that treat model behavior as a trade secret will lose them.


Clinical Decision Support Systems Market Segmentation

Segmentation within the Clinical Decision Support Systems Market follows five commercially meaningful dimensions. Metrics below are stated selectively to avoid over-disclosure of licensed model detail.

By Model

Segment Metric Primary Demand Driver
Knowledge-Based CDSS 71.6% share (2025) Guideline traceability and regulatory defensibility
Non-Knowledge CDSS 14.9% CAGR Pattern detection in unstructured and streaming data


Knowledge-Based systems still dominate the Clinical Decision Support Systems Market because their logic is inspectable — a clinician can ask why a recommendation fired and receive a citable answer. That auditability matters enormously in litigation-exposed specialties. Non-Knowledge approaches grow faster precisely where rules break down: early deterioration detection, imaging triage and signal extraction from free-text notes. Most serious deployments now run both, with statistical models generating candidates and rule layers enforcing safety constraints.

By Mode of Delivery

Segment Metric Primary Demand Driver
Cloud-Based 13.9% CAGR Faster content updates and lower upfront capital
On-Premise 54.3% share (2025) Data residency requirements and latency control


On-premise deployment still holds the larger installed base within the Clinical Decision Support Systems Market, largely because national data-residency rules in Europe, the Gulf and parts of Asia constrain where patient data may physically sit. Cloud growth outpaces it substantially, though, since guideline content refreshes monthly and shipping updates to on-premise estates is expensive. Hybrid architectures — local inference, cloud content — are becoming the practical compromise.

By Component

Segment Metric Primary Demand Driver
Software 62.8% share (2025) Core advisory engine and content licensing
Services 12.6% CAGR Implementation, tuning and model governance retainers
Hardware USD 0.31 Billion (2025) Edge inference and bedside display infrastructure


Software carries the majority of value across the Clinical Decision Support Systems Market, but services deserve closer attention from investors. Content curation, alert tuning and post-deployment model monitoring are recurring, sticky and high-margin. Several vendors now derive more than a quarter of revenue from services attached to a software base they originally sold at an aggressive discount.

By Product

Segment Metric Primary Demand Driver
Integrated CDSS 68.4% share (2025) Single-vendor workflow and reduced interface burden
Standalone CDSS 9.4% CAGR Specialty depth unavailable in bundled offerings


The largest product area continues to be integrated clinical decision support systems (CDSS), fueled by healthcare facilities integrating health IT architectures to facilitate single-vendor processes and minimize interface friction inside electronic health record (EHR) environments. Standalone CDSS solutions are the most dynamic alternative segment, fueled by particular clinical needs and sophisticated specialty diagnostic solutions that are usually not included in mainstream bundled EHR or enterprise systems.


By Application

Segment Metric Primary Demand Driver
Medical Diagnosis 31.2% share (2025) Diagnostic error reduction and imaging triage
Alerts and Reminders USD 0.68 Billion (2025) Preventive care gap closure
Drug Allergy Alerts 9.8% CAGR Medication safety compliance
Clinical Reminders 11.6% share (2025) Chronic disease protocol adherence
Drug-Drug Interactions 12.8% CAGR Polypharmacy management in aging populations
Drug Dosing Support USD 0.24 Billion (2025) Renal and pediatric dose adjustment
Other Applications 8.9% share (2025) Documentation and coding assistance


Medical Diagnosis leads because it is where error carries the highest clinical and financial cost. Drug-Drug Interactions grows fastest for demographic reasons that will not reverse — patients over 65 in developed economies commonly take five or more concurrent medications, and the interaction surface expands combinatorially [22].


Regional Market Share Analysis

Region Metric Primary Investment Themes
North America 41.8% share Quality-linked payment, AI reimbursement codes, EHR-native modules
Europe USD 0.79 Billion (2025) Health data space compliance, cross-border exchange, national fee schedules
Asia-Pacific 14.2% CAGR National digital health missions, cloud-first deployment, mobile-led access
South America 4.6% share Public hospital digitization, private network modernization
Middle East & Africa 11.8% CAGR Sovereign health transformation programs, greenfield hospital builds
Total USD 2.86 Billion (2025)

Regional demand within the Clinical Decision Support Systems Market tracks two variables above all others: electronic record penetration and whether payment policy rewards documented decision quality. Where both are present, adoption compounds quickly.


North America

Country Metric Key Driver
US 87.4% of region Quality payment programs and information-blocking enforcement
Canada USD 0.11 Billion (2025) Provincial record consolidation and pan-Canadian interoperability roadmap
Mexico 13.6% CAGR Private hospital network digitization


American demand in the Clinical Decision Support Systems Market rests on payment architecture. The CMS Merit-based Incentive Payment System ties a meaningful share of clinician reimbursement to quality and interoperability performance categories, and promoting interoperability scoring explicitly rewards documented use of advisory functionality [6]. Canadian growth is slower but structurally sound, with provincial health authorities standardizing on fewer record platforms — a precondition for advisory logic that works across care settings.

Europe

Country Metric Key Driver
Germany 23.8% of region Hospital Future Act digitization funding
UK USD 0.17 Billion (2025) NHS frontline digitization targets
France 15.1% of region Ségur du numérique en santé funding envelope
Italy 10.9% CAGR Recovery plan health digitization allocation
Spain USD 0.06 Billion (2025) Regional health service modernization
Nordic Countries 12.4% CAGR Mature registries and structured data availability
Russia 3.9% of region State hospital IT programs
Rest of Europe USD 0.07 Billion (2025) Cross-border data exchange preparation


Germany's Krankenhauszukunftsgesetz allocated roughly EUR 4.3 billion to hospital digitization, with a portion earmarked for clinical process and medication-safety systems — and hospitals that failed to meet digital maturity criteria faced reimbursement reductions from 2025 [17]. That penalty structure did more for adoption than any incentive scheme. Across the bloc, the European Health Data Space now sets a compliance floor that pushes advisory tooling from optional to expected [2].

Asia-Pacific

Country Metric Key Driver
China 28.6% of region Tertiary hospital informatization grading standards
India 17.9% CAGR Ayushman Bharat Digital Mission rollout
Japan USD 0.13 Billion (2025) Aging population and medication safety focus
South Korea 11.4% of region Precision medicine and national data platform
ASEAN 15.8% CAGR Ministry-level procurement and greenfield hospital builds
Rest of Asia-Pacific USD 0.05 Billion (2025) Private hospital chain expansion


Asia-Pacific is the growth engine of the Clinical Decision Support Systems Market because it is building on fewer legacy constraints. China's hospital informatization grading standard obliges tertiary facilities to demonstrate closed-loop medication management and clinical pathway compliance to retain their classification [18]. India's approach is different — a national identity and consent layer first, applications second — but the effect on addressable install base is comparable.

South America

Country Metric Key Driver
Brazil 52.4% of region Private hospital network digitization and national record program
Argentina 12.9% CAGR Provincial health system modernization
Rest of South America USD 0.03 Billion (2025) Chilean and Colombian tertiary hospital upgrades


Brazilian adoption concentrates in the private supplementary health sector, where roughly 50 million beneficiaries are covered by operators competing on clinical quality metrics [19]. Public sector uptake trails, constrained less by technology preference than by procurement cycles and infrastructure. Regional vendors localize content to Portuguese and Spanish formularies — a genuine barrier for global platforms.

Middle East & Africa

Country Metric Key Driver
Saudi Arabia 29.7% of region Vision 2030 health sector transformation
UAE 14.6% CAGR Mandatory unified health record participation
South Africa USD 0.02 Billion (2025) Private hospital group standardization
Egypt 12.1% CAGR Universal health insurance rollout
Rest of MEA 21.4% of region Greenfield tertiary hospital construction


Gulf states buy differently from mature markets: they procure entire digital hospital stacks at commissioning rather than layering software onto existing estates. Saudi Arabia's health transformation program targets substantially expanded digital service coverage under Vision 2030, with several new tertiary facilities specified as fully digital from day one [20]. Sub-Saharan adoption remains concentrated in private groups and donor-funded programs.


Clinical Decision Support Systems Market By Region, 2025-2035

Competitive Benchmarking

Concentration in the Clinical Decision Support Systems Market sits in the medium band. Estimated HHI falls between 680 and 760, with the top five vendors controlling roughly 40–48% of global revenue. That structure reflects a two-tier market: record platform vendors who bundle advisory functionality, and content specialists who license evidence libraries into those platforms. Neither tier can fully displace the other, which sustains an unusually stable competitive equilibrium punctuated by content-asset acquisitions.

Company Est. Revenue Share Range Key Offerings for Clinical Decision Support Systems Market Strategic Positioning
Epic Systems ~11–14% Native advisory modules, predictive models, best-practice advisories Record-embedded incumbent with deep install-base lock-in
Oracle Health (Cerner) ~9–12% Integrated advisory engine, cloud-hosted clinical intelligence Cloud-first re-platforming of a large legacy base
Wolters Kluwer Health ~7–10% Evidence content, drug reference, order-set libraries Content authority licensed across competing platforms
Elsevier ~6–9% Clinical reference, care planning, order sets Editorial depth and international guideline coverage
Merative ~5–7% Drug information, imaging analytics, clinical analytics Content and analytics specialist post-divestiture
Veradigm ~4–6% Ambulatory advisory tools, prescribing intelligence Outpatient and payer workflow focus
MEDITECH ~4–6% Embedded surveillance, sepsis and deterioration alerts Community hospital strength and cost-efficient stack
Philips Healthcare ~3–5% Acute care surveillance, imaging decision support Device-adjacent monitoring integration
GE HealthCare ~3–5% Imaging interpretation support, care orchestration Diagnostic imaging channel advantage
Siemens Healthineers ~2–4% Radiology and laboratory decision algorithms Diagnostics-anchored advisory portfolio
NextGen Healthcare ~2–4% Ambulatory quality and protocol prompts Specialty ambulatory practice focus
Zynx Health ~2–3% Evidence-based order sets and care plans Pure-play content curation and workflow design


Recent News & Developments

  • Oracle Health (September 2024): Announced a fully redesigned cloud-native electronic health record with embedded generative advisory capability, signaling that record vendors intend to own the advisory layer rather than partner for it [23].
  • U.S. HHS (January 2024): Information-blocking disincentives for healthcare providers took effect, converting interoperability from a best practice into a reimbursement-linked obligation [1].
  • European Union (March 2025): Formal adoption of the European Health Data Space regulation established binding requirements for interoperable electronic record systems across member states [2].
  • Wolters Kluwer Health (June 2024): Expanded its clinical evidence platform with generative search over curated content, targeting reduced time-to-answer at the bedside [16].
  • Epic Systems (August 2024): Announced expanded availability of predictive model libraries with published subgroup validation data, responding to institutional demand for bias disclosure [21].
  • FDA (December 2024): Issued finalized guidance on predetermined change control plans for machine-learning enabled device software, clarifying how adaptive algorithms may be updated post-authorization [13].
  • India National Health Authority (October 2024): Reported crossing 700 million health account registrations under the digital health mission, materially expanding the addressable install base for advisory tooling [11].
  • Philips (May 2025): Extended its acute-care surveillance portfolio through a partnership integrating third-party deterioration models into existing monitoring infrastructure [24].


Clinical Decision Support Systems Market Report Scope

Parameter Detail
Market Scope Global Clinical Decision Support Systems Market across model, mode of delivery, component, product, application and geography
Study Period 2021–2035 (Historical 2021–2024; Base Year 2025; Forecast 2026–2035)
CAGR 11.1% (2026–2035)
Market Size Checkpoints USD 2.86 Billion (2025); USD 3.18 Billion (2026); USD 5.38 Billion (2031); USD 8.20 Billion (2035)
Fastest Growing Segments Non-Knowledge CDSS (model); Cloud-Based (delivery); Services (component); Drug-Drug Interactions (application)
Companies Profiled 12 vendors including Epic Systems, Oracle Health, Wolters Kluwer Health, Elsevier, Merative, Veradigm, MEDITECH, Philips Healthcare, GE HealthCare, Siemens Healthineers, NextGen Healthcare, Zynx Health
Valuation Currency USD, constant 2025 prices

FAQs

What contract structures work best when procuring within the Clinical Decision Support Systems Market?
Outcome-linked contracts with milestone payments tied to override-rate and adoption thresholds protect buyers better than perpetual licenses. Insist on termination rights if reference-site performance is not replicated within twelve months [9].
How should a buyer evaluate vendor content currency?
Ask for the median lag between guideline publication and content update, measured across the last eight releases. Anything beyond 90 days signals editorial understaffing [16].
Who are the primary buyers in the Clinical Decision Support Systems Market today?
Chief medical information officers still lead selection, but chief financial officers now hold veto authority on contracts above USD 500,000. Pharmacy directors increasingly co-sign medication-related modules [9].
What integration standard should be mandated in an RFP?
Require FHIR R4 with CDS Hooks support, plus SMART on FHIR launch capability. Vendors offering only proprietary APIs create switching costs that surface three years later [15].
Does vendor consolidation in the Clinical Decision Support Systems Market threaten independent content providers?
No. Platform vendors consistently license third-party evidence libraries rather than build them, because editorial curation is labor-intensive and reputationally risky. Independents retain durable bargaining power [16].
What staffing does post-deployment governance require?
Budget roughly one clinical informatics FTE per 500 beds for alert tuning and model monitoring. Systems that skip this role see benefit decay within eighteen months [12].
Are point-of-care decision tools reimbursable outside imaging?
Coverage remains narrow. Imaging and cardiology carry the clearest payment pathways; most other specialties still require internal cost-avoidance justification [6].      
Author
Author
Author Profile
Rahul Gotadki LinkedIn
Research Manager
He holds an experience of about 9+ years in Market Research and Business Consulting, working under the spectrum of Life Sciences and Healthcare domains. Rahul conceptualizes and implements a scalable business strategy and provides strategic leadership to the clients. His expertise lies in market estimation, competitive intelligence, pipeline analysis, customer assessment, etc.
Co-Author
Co-Author Profile
Satyendra Maurya LinkedIn
Research Analyst
An accomplished research analyst with high proficiency in market forecasting, data visualization, competitive benchmarking, and others. He holds a pronounced track record in research and consulting projects for sectors such as life sciences, medical devices, and healthcare IT. His capabilities in qualitative and quantitative analysis have resulted in positive client outcomes. Working on niche market trends, opportunities, sales, and forecasted value is part of his skill set.
Share::
Request Free Sample

Research Approach


Secondary Research

The secondary research process involved comprehensive analysis of health IT regulatory frameworks, peer-reviewed medical informatics journals, clinical safety publications, and authoritative healthcare technology organizations. Key sources included the US Food & Drug Administration (FDA) Center for Devices and Radiological Health (CDRH) Software as Medical Device (SaMD) database, Office of the National Coordinator for Health Information Technology (ONC) Certification Program, Agency for Healthcare Research and Quality (AHRQ) National Guideline Clearinghouse, Healthcare Information and Management Systems Society (HIMSS) Analytics, ECRI Institute Health IT Safety Reports, Centers for Medicare & Medicaid Services (CMS) EHR Incentive Programs, Centers for Disease Control and Prevention (CDC) National Center for Health Statistics medication safety data, National Institutes of Health (NIH) National Library of Medicine (NLM) clinical decision support resources, Joint Commission Sentinel Event Database, International Organization for Standardization (ISO/TC 215 Health Informatics), Integrating the Healthcare Enterprise (IHE) profiles, KLAS Research healthcare IT performance reports, College of Healthcare Information Management Executives (CHIME) Health IT Dashboard, European Commission eHealth Network, NHS Digital (UK) Health Application Quality Standards, and national health IT agency reports from key markets. These sources were used to collect EHR adoption statistics, SaMD regulatory clearance data, clinical safety studies, interoperability standards compliance, and market landscape analysis for knowledge-based CDSS, non-knowledge-based AI/ML CDSS, integrated EHR-CDSS platforms, and standalone clinical decision support applications.


Primary Research

To gather both qualitative and quantitative information, the primary research process involved interviewing players from both the supply and demand sides. Executives from electronic health record (EHR) vendors, clinical decision support system (CDSS) developers, health information technology (IT) manufacturers, and clinical content suppliers were among the supply-side sources. Members of the demand side included ambulatory care networks, academic medical centers, specialty clinics, clinical informaticists, pharmacy directors, chief information officers, chief nursing information officers, clinical informaticists, and procurement leads from integrated health systems. Data on EHR integration trends, interoperability issues, subscription vs. perpetual licencing models, value-based care reimbursement dynamics, and AI/ML algorithm development timelines were all confirmed through primary research.

Primary Respondent Breakdown:

By Designation: C-level Primaries (30%), Director Level (32%), Others (38%)

By Region: North America (40%), Europe (25%), Asia-Pacific (28%), Rest of World (7%)


Market Size Estimation

Global market valuation was derived through revenue mapping and healthcare facility adoption analysis. The methodology included:

Identification of 50+ key health IT vendors across North America, Europe, Asia-Pacific, and Latin America

Product mapping across knowledge-based CDSS, non-knowledge-based AI CDSS, integrated EHR-CDSS, standalone CDSS, and specialized application modules (drug interaction, clinical guidelines, diagnostic support)

Analysis of reported and modeled annual revenues specific to CDSS software licenses, subscription services, implementation, and maintenance portfolios

Coverage of vendors representing 65-70% of global market share in 2024

Extrapolation using bottom-up (hospital bed count × CDSS adoption rate × ASP by country) and top-down (vendor revenue validation) approaches to derive segment-specific valuations across cloud-based and on-premise delivery modes

Share::
Request Free Sample
Download Free Sample

Kindly complete the form below to receive a free sample of this Report

* Please use a valid business email

Share::
Request Free Sample
Download PDF ×

We do not share your information with anyone. However, we may send you emails based on your report interest from time to time. You may contact us at any time to opt-out.
















