Computer Aided Engineering Market (2026 - 2035)

Computer Aided Engineering Market Size, Share and Research Report By Simulation Talent Scarcity, By Export Controls Fragment the Compute Layer, By Cost Structures Exclude the Mid-Market and By Regional (North America, Europe, South America, Asia Pacific, Middle East and Africa) - Industry Forecast to 2035.
ID: MRFR/ICT/20746-CR
243 Pages
Kiran Jinkalwad, Aarti Dhapte
Last Updated: August 24, 2026
Computer Aided Engineering Market
Market Size
Forecast Period2026-2035
CAGR (2026-2035)10.15%
2025 Market SizeUSD 12.81 Billion
2035 Market SizeUSD 34.54 Billion
Key Players
Synopsys
Siemens Digital Industries Software
Dassault Systèmes
Hexagon AB
Autodesk
PTC
Opportunities
  • In-Silico Clinical Evidence
  • Simulation-as-a-Service in Emerging Economies
  • Validated Materials and Model Libraries as a Revenue Line

Computer Aided Engineering Market Summary

The computer-aided engineering market reached USD 12.81 billion in 2025 and opens the forecast window at USD 14.47 billion in 2026, climbing to USD 34.54 billion by 2035 at a 10.15% CAGR. Two catalysts explain the acceleration. Regulators — the FAA, EASA, and the US FDA among them — now accept credentialed simulation evidence in place of portions of physical certification testing, which moves budget out of test rigs and into solver licences [1][3]. The second is compute: sovereign HPC programmes in the EU and Asia have committed multi-billion-dollar envelopes that engineering teams can now draw on directly [6][9].

Legacy practice is being destroyed in broad view. Single physics solvers attached to desktops operating overnight on workstation cores are being replaced by GPU-accelerated coupled multiphysics stacks coordinated on elastic infrastructure. The EU’s EuroHPC Joint Undertaking has committed some EUR 7 billion to exascale and pre-exascale systems until 2027, some of which funds industrial simulation access for manufacturers [6].


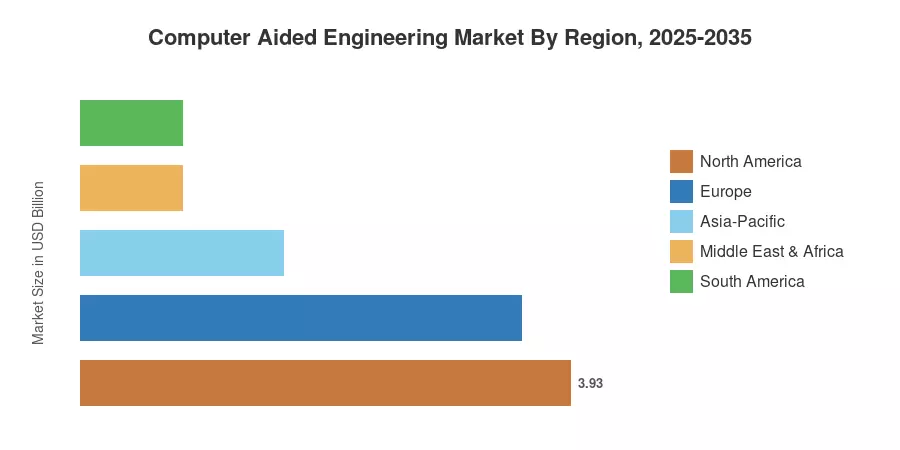
North America is expected to be the most profitable region, generating 30.7% of revenue in 2025 due to aerospace and semiconductor design intensity. Asia-Pacific is growing fastest at 12.75% CAGR, driven by Chinese, Korean and Indian EV and electronics programs. Europe, the second largest bloc, is seeing demand boosted by automotive homologation reform and sovereign-cloud obligations. Whoever marries solver fidelity with plausible provenance will own the next decade.


Key Report Takeaways

• By Technology

  • Software commands 69.4% of the computer-aided engineering market in 2025, with perpetual-to-subscription conversion reshaping revenue recognition across the vendor base.
  • Finite element analysis holds 35.8% of software-tier revenue, still the default entry point for structural credentialing.
  • Cloud-based deployment is compounding at 11.79% through 2035 as burst solving replaces fixed cluster procurement.

• By Sector

  • Automotive contributes USD 3.47 billion of 2025 spending within the computer-aided engineering market, concentrated in crash, NVH, and battery thermal work.
  • Healthcare and medical devices post the fastest vertical growth at 13.34% CAGR, driven by in-silico trial acceptance.
  • Small and medium enterprises expand at 12.32% CAGR as consumption pricing lowers the entry barrier.

• By Geography

  • North America accounts for 30.7% of 2025 revenue
  • Asia-Pacific registers a 12.75% CAGR through 2035
  • Europe generates USD 3.54 billion in 2025


Market Size and Forecast (2021–2035)

Figures below combine vendor-reported licence and maintenance income, national statistical office capital-expenditure series for engineering software, HPC procurement disclosures and a bottom-up seat-count model tested against over 60 buy-side interviews. Historical years are reconciled to audited filings where possible. Forecast years apply segment-weighted growth to 2025 base.
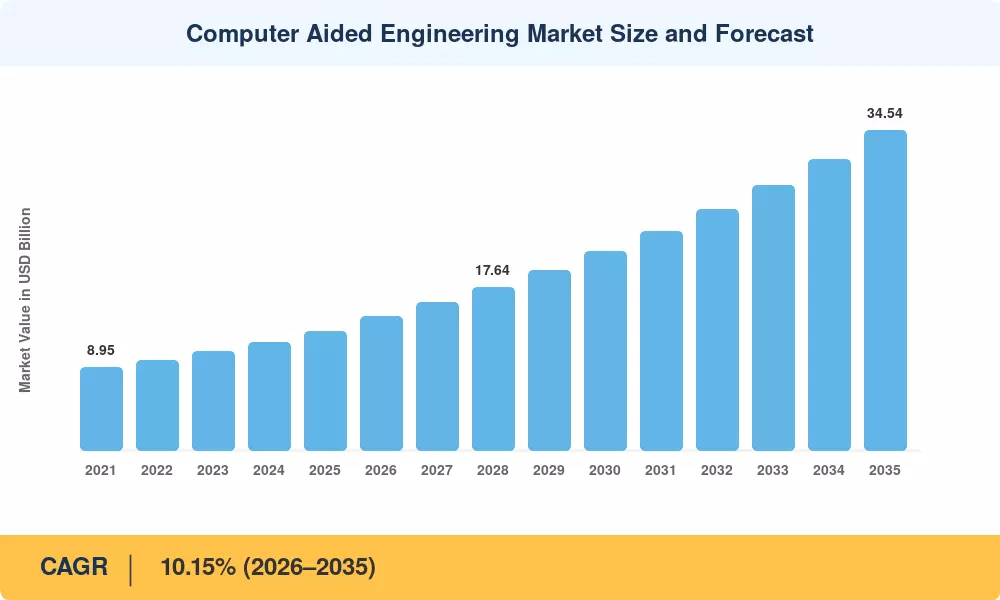
Computer Aided Engineering Market Size and Forecast
Our Impact
Enabled $4.3B Revenue Impact for Fortune 500 and Leading Multinationals
Partnering with 2000+ Global Organizations Each Year
30K+ Citations by Top-Tier Firms in the Industry

Driver Impact Analysis

Driver ~% Impact on CAGR Geographic Relevance Impact Timeline
Regulatory acceptance of virtual certification 2.4 North America, Europe Medium-term (2–4 yr)
GPU acceleration and AI surrogate solvers 2.1 Global Short-term (≤2 yr)
Electrification and battery engineering demand 1.8 Asia-Pacific, Europe Medium-term (2–4 yr)
Sovereign compute and HPC funding programmes. 1.4 Europe, Asia-Pacific Long-term (≥4 yr)
Cloud consumption pricing unlocking SME demand. 1.2 Global Short-term (≤2 yr)
Semiconductor and advanced packaging design intensity 1.0 North America, Asia-Pacific Long-term (≥4 yr)
Sustainability-driven lightweighting mandates 0.7 Europe Long-term (≥4 yr)


Virtual Certification Displaces Physical Test Budgets

The FAA's Modelling & Simulation policy work and EASA's CM-S-014 guidance both formalise how simulation credibility is assessed for certification credit, and NASA's NASA-STD-7009A credibility framework gives programme offices a scoring rubric to defend those submissions [1][2][3]. Aerospace primes report physical-test spend reductions in the 20–30% range on derivative programmes where credentialed models substitute for coupon and subassembly campaigns. Each displaced rig hour converts into solver hours and verification-and-validation labour — a structurally favourable trade for licence vendors.

AI Surrogates Change the Economics of Iteration

Physics-informed neural networks and reduced-order models now return near-solver-accuracy results in seconds rather than hours, letting engineers screen thousands of permutations before committing to a high-fidelity run. The US National Science Foundation has committed over USD 140 million across its AI research institutes, several of which target scientific machine learning directly applicable to engineering solvers [7]. Vendors monetise this as premium tiers rather than cannibalised core licences.

Electrification Multiplies Simulation Scope Per Vehicle

A battery-electric platform demands electrochemical, thermal runaway, electromagnetic, structural, and acoustic analysis where an internal-combustion equivalent needed a narrower set. The IEA counted more than 17 million electric car sales in 2024, and every new platform behind that figure carries a materially larger simulation workload than the vehicle it replaces [14]. Tier-one suppliers, not just OEMs, are absorbing this scope.

Sovereign Compute Programmes Remove the Infrastructure Barrier

EuroHPC's system portfolio and Japan's METI-backed supercomputing initiatives explicitly reserve capacity for industrial users, while India's National Supercomputing Mission has deployed PARAM-class systems with manufacturing access tracks [6][9][10]. This converts a capital decision into an access decision — the practical unlock for mid-market manufacturers that could never justify an on-premises cluster.


Restraints Impact Analysis

Restraint ~% Drag on CAGR Geographic Relevance Impact Timeline
Simulation talent scarcity 1.6 Global Long-term (≥4 yr)
Total cost of ownership for high-fidelity solvers 1.1 Asia-Pacific, South America Medium-term (2–4 yr)
Export controls on advanced compute 0.9 Asia-Pacific Short-term (≤2 yr)
Legacy CAD/PLM interoperability friction 0.7 Global Medium-term (2–4 yr)
Data sovereignty limits on cloud solving. 0.5 Europe, Middle East Long-term (≥4 yr)


The Analyst Bottleneck Is Real

Credentialed simulation requires judgement that tooling does not supply. NAFEMS professional certification volumes and OECD skills surveys both point to a widening gap between seat availability and qualified users, with European manufacturers reporting engineering vacancy rates above 8% in 2024 [16][19]. Licences sit idle when nobody can defend the model. Vendors have responded with guided workflows and templated verification, but the constraint persists into the 2030s.

Export Controls Fragment the Compute Layer

Cost Structures Still Exclude the Mid-Market

Enterprise-tier multiphysics stacks with adequate solve capacity routinely exceed USD 150,000 annually once support and compute are loaded in for a 200-person manufacturer that competes directly with headcount. Consumption pricing narrows the gap but has not closed it, particularly in South America and parts of ASEAN where financing costs compound the decision.


Computer Aided Engineering Market Opportunities

In-Silico Clinical Evidence

The FDA's ASME V&V 40 alignment and its Medical Device Development Tools programme create a defensible pathway for computational modelling to substitute for portions of bench and animal testing [3][20]. Device makers running cardiovascular and orthopaedic virtual cohorts cut submission cycles materially. This is the highest-margin greenfield in the segment.

Simulation-as-a-Service in Emerging Economies

India, Vietnam, Indonesia, and Brazil host expanding contract-manufacturing bases with negligible on-premises simulation capacity. Pay-per-solve offerings priced against local engineering wages convert a capex refusal into an opex line item. India's Production Linked Incentive schemes, with outlays exceeding USD 26 billion across sectors, are pulling design work onshore alongside assembly [10].

Validated Materials and Model Libraries as a Revenue Line

Calibrated material cards, joint models, and validated component libraries are becoming standalone subscription products. Buyers pay for provenance, not physics. NIST's Materials Genome Initiative infrastructure has demonstrated the demand for curated, traceable datasets that feed directly into solvers [4].

Operational Digital Twins Extending the Licence Footprint

Design-phase models redeployed against live sensor feeds turn a project-duration licence into a perpetual operational one. Wind, process, and rotating-equipment operators are the earliest adopters, with the IEA projecting continued double-digit growth in renewable capacity additions through 2030 — each asset a twin candidate [13].

Vertical-Specific Packaged Workflows

Generic solver suites are losing ground to opinionated, industry-templated workflows that encode regulatory acceptance criteria directly. Battery pack thermal runaway, semiconductor package warpage, and orthopaedic implant fatigue are the three clearest packaging opportunities.


Computer Aided Engineering Market Future Outlook

Autonomous Design Loops

By the early 2030s, generative optimisation coupled to validated surrogates will run unattended overnight, presenting engineers with a ranked, constraint-satisfying shortlist rather than a blank CAD window. The role shifts from modelling to adjudicating. Vendors that own the verification layer capture the value; those that only own the solver become interchangeable.

Platform Economics and the Consolidation Wave

Synopsys closed its Ansys acquisition in 2025, and Siemens absorbed Altair in the same window, concentrating the top tier considerably [15][17]. Expect bundled electronic-design-automation-plus-simulation contracts to become the standard enterprise procurement unit, with pricing power shifting toward the two or three vendors that can serve chip, board, system, and structure from one commercial agreement.

The Electrification and Energy Transition Supercycle

IRENA reports global renewable capacity additions exceeding 585 GW in 2024, and the IEA continues to project sustained double-digit growth in electrified transport [13][14]. Grid hardware, power electronics, and storage systems all carry heavier thermal and electromagnetic simulation loads per unit than the equipment they displace — a durable volume tailwind independent of software pricing.

Provenance, Sustainability Reporting, and Model Governance

Sustainability disclosure regimes increasingly require defensible product-level carbon accounting, which in practice means traceable design-stage models. Simulation data governance — versioning, credibility scoring, audit trails — becomes a purchased capability rather than an internal spreadsheet. This is where compliance spend quietly enters the engineering software budget.


Computer Aided Engineering Market Segmentation

By Component

Software dominates the computer-aided engineering market, though services growth outpaces it as buyers outsource verification and validation.

Segment 2025 Metric Primary Demand Driver
Software 69.4% share Solver licensing and subscription conversion
Services 11.69% CAGR Model credentialing, training, managed solving


Software's share understates its strategic weight, since licence relationships largely pull through services revenue. The services line grows faster because talent scarcity forces buyers to rent expertise they cannot hire.

By Software Type

Structural analysis remains the anchor workload across the computer-aided engineering market.

Segment 2025 Metric Primary Demand Driver
Finite Element Analysis 35.8% share Structural certification and durability
Computational Fluid Dynamics USD 3.51 Billion Thermal management and aerodynamics
Multibody Dynamics 13.1% share Mechanism and vehicle dynamics
Optimization & Others 23.7% share Generative and topology workflows


Multiphysics-coupled fluid analysis is the fastest-expanding sub-tier at 12.64% CAGR, because battery thermal and electronics cooling problems cannot be solved in a single physics domain. Structural analysis retains volume leadership through sheer breadth of application.

By Deployment and Organization Size

Deployment mix is the clearest leading indicator of where new buyers enter the computer-aided engineering market.

Segment 2025 Metric Primary Demand Driver
On-Premise 57.6% share Data sovereignty and existing cluster amortisation
Cloud-Based 11.79% CAGR Burst capacity without capital commitment
Large Enterprises USD 8.21 Billion Programme-scale simulation portfolios
Small and Medium Enterprises 12.32% CAGR Consumption pricing and hosted solving


By End-User Vertical

Segment 2025 Metric Primary Demand Driver
Automotive 27.1% share Crash, NVH, battery thermal, homologation
Aerospace & Defence USD 2.77 Billion Certification credit and weight optimisation
Industrial Machinery 16.8% share Reliability and fatigue analysis
Electronics & Semiconductors 14.2% share Package warpage and signal integrity
Healthcare & Medical Devices 13.34% CAGR In-silico evidence for regulatory submission
Energy & Others 11.9% share Rotating equipment and structural integrity


Automotive leads on absolute spend and shows no sign of ceding it, since each electrified platform adds physics domains rather than replacing them. Healthcare grows fastest from a small base as computational modelling earns formal standing in device submissions.


Regional Market Share Analysis

Region 2025 Metric Primary Investment Themes
North America 30.7% share Aerospace certification, semiconductor design, defence modernisation
Europe USD 3.54 Billion Automotive homologation, sovereign HPC, sustainability compliance
Asia-Pacific 12.75% CAGR EV platforms, electronics, domestic solver development
South America USD 0.82 Billion Agricultural machinery, mining equipment, aerostructures
Middle East & Africa 6.4% share Energy infrastructure, industrial diversification programmes
Total USD 12.81 Billion

Regional demand in the computer-aided engineering market tracks two variables: the density of regulated, safety-critical design activity and the availability of accessible high-performance compute.


North America

Country Metric (Share of Region) Key Driver
US 84.6% Aerospace and semiconductor design concentration
Canada 9.1% Aerostructures and clean-tech engineering
Mexico 6.3% Automotive tier-one nearshoring


North America retains its lead because certification authorities, prime contractors, and solver vendors sit in the same jurisdiction. The US Department of Energy's Exascale Computing Project delivered production capability at Frontier and El Capitan, and its industrial partnership tracks give manufacturers structured access to that capacity [5]. Mexico's contribution is small but compounding as tier-one suppliers relocate design authority closer to assembly.

Europe

Country Metric (Share of Region) Key Driver
Germany 31.2% Automotive and industrial machinery engineering depth
UK 14.8% Aerospace propulsion and motorsport engineering
France 13.6% Aerospace, nuclear, and defence programmes
Italy 9.4% Machinery and specialty vehicle design
Spain 6.9% Wind energy and aerostructures
Nordic Countries 7.7% Marine, offshore, and electrification
Russia 4.1% Domestic solver substitution
Rest of Europe 12.3% Contract engineering and CEE manufacturing


Europe's engine is regulatory. The EU's Corporate Sustainability Reporting Directive and end-of-life vehicle rules push lightweighting and recyclability decisions upstream into simulation. At the same time, GDPR-adjacent sovereignty requirements keep sensitive solving inside EU-hosted infrastructure [8]. EuroHPC's Jupiter exascale system, commissioned in Germany, materially raises the ceiling for industrial workloads [6].

Asia-Pacific

Country Metric (Share of Region) Key Driver
China 38.4% EV platforms and domestic solver programmes
India 16.2% Engineering services exports and PLI-linked manufacturing
Japan 17.9% Precision machinery and automotive electronics
South Korea 12.1% Battery, display, and semiconductor packaging
ASEAN 9.8% Electronics assembly and design migration
Rest of Asia-Pacific 5.6% Resources and infrastructure engineering


Asia-Pacific grows fastest in the computer-aided engineering market because platform count is growing fastest. China alone launched dozens of new EV models in 2024, each requiring a full simulation programme [14]. Japan's METI supercomputing initiatives and India's National Supercomputing Mission both reserve industrial capacity, and Korea's battery and packaging firms have become among the heaviest multiphysics consumers globally [9][10].

South America

Country Metric (Share of Region) Key Driver
Brazil 61.4% Aerostructures, agricultural machinery, offshore energy
Argentina 16.7% Automotive components and agri-equipment
Rest of South America 21.9% Mining equipment and infrastructure


Brazil anchors regional demand through Embraer's supplier network and a substantial agricultural-machinery design base. Adoption of the computer-aided engineering market's cloud tier is disproportionately high here because on-premises cluster financing is expensive and hosted alternatives price in dollars against local engineering wages that make the arbitrage attractive.

Middle East & Africa

Country Metric (Share of Region) Key Driver
Saudi Arabia 33.8% Vision 2030 industrial localisation
UAE 24.6% Advanced manufacturing and aerospace MRO
South Africa 15.2% Mining equipment and automotive assembly
Egypt 9.4% Infrastructure and process industries
Rest of MEA 17.0% Energy and utilities engineering


Saudi Arabia's localisation targets under Vision 2030 require domestic design capability, not just assembly, which is pulling solver licences into a market that previously imported finished engineering. The UAE's national AI and compute investments give the region its first credible domestic HPC base for industrial simulation.


Computer Aided Engineering Market By Region, 2025-2035

Competitive Benchmarking

The concentration in computer aided engineering market is moderate and getting concentrated. We expect an HHI of 950 to 1,150 in 2025, with the five leading vendors accounting for 55% to 60% of sales. Two 2025 deals - Synopsys/Ansys and Siemens/Altair - took out independent scale companies and nudged the structure toward oligopoly at the high fidelity tier, while a long tail of experts endures in specialty physics.

Company Est. Revenue Share Range Key Offerings for Computer-Aided Engineering Market Strategic Positioning
Synopsys (Ansys) ~19–23% Mechanical, Fluent, HFSS, LS-DYNA Chip-to-system simulation convergence
Siemens Digital Industries Software ~14–17% Simcenter, STAR-CCM+, Altair HyperWorks PLM-embedded simulation at enterprise scale
Dassault Systèmes ~11–14% SIMULIA, Abaqus, XFlow, 3DEXPERIENCE Platform-native, life-sciences leaning
Hexagon AB ~6–9% MSC Nastran, Adams, Cradle CFD, Marc Metrology-to-simulation data continuity
Autodesk ~4–6% Fusion simulation, CFD, Moldflow Mid-market and design-adjacent entry
PTC ~3–5% Creo Simulation Live, Ansys-powered tools Simulation-driven design inside CAD
Cadence Design Systems ~3–5% Fidelity CFD, Millennium, BETA CAE Electronics-led system analysis
COMSOL ~2–4% COMSOL Multiphysics, application builder Research and multiphysics specialist
Keysight (ESI Group) ~2–4% Virtual Performance Solution, ProCAST Virtual prototyping and manufacturing physics
Altair (Siemens) ~2–4% OptiStruct, Radioss, HyperMesh Optimisation and licensing-model innovation
Bentley Systems ~1–3% STAAD, RAM, MOSES Infrastructure and offshore analysis


Recent News & Developments

  • Synopsys (July 2025): Completed its acquisition of Ansys, creating a combined electronic-design and simulation portfolio spanning silicon to system level — the single largest structural change in the sector's history [17].
  • Siemens (March 2025): Closed its purchase of Altair Engineering, adding optimisation, data analytics, and a flexible licensing model to the Simcenter portfolio [15].
  • Keysight Technologies (2024–2025): Finalised its acquisition of ESI Group, extending from electronic test into mechanical and manufacturing virtual prototyping [18].
  • Cadence Design Systems (2024): Acquired BETA CAE Systems, bringing established pre- and post-processing and structural analysis into an electronics-centric stack [11].
  • EuroHPC Joint Undertaking (2024–2025): Brought Jupiter, Europe's first exascale system, toward production in Germany with explicit industrial access provisions [6].
  • US FDA (2023–2024): Continued expansion of computational modelling guidance and V&V 40 alignment for device submissions, strengthening the evidentiary standing of simulation [3][20].
  • US Department of Commerce (2023–2025): Successive advanced-compute export control updates reshaped GPU availability in China, accelerating domestic solver and lower-precision optimisation work [11].
  • NVIDIA (2024–2025): Expanded Omniverse and CUDA-X libraries for physics acceleration, deepening GPU dependency across major commercial solvers [21].


Computer Aided Engineering Market Report Scope

Parameter Detail
Market Scope Global computer-aided engineering market covering software, services, deployment models, organization size, software type, end-user verticals, and five regions
Study Period 2021–2035 (Historical 2021–2024; Base Year 2025; Forecast 2026–2035)
CAGR 10.15% (2026–2035)
Market Size Checkpoints USD 12.81 Billion (2025); USD 14.47 Billion (2026); USD 34.54 Billion (2035)
Fastest Growing Segments Healthcare & Medical Devices; Cloud-Based Deployment; Small and Medium Enterprises; Asia-Pacific
Companies Profiled Synopsys (Ansys), Siemens Digital Industries Software, Dassault Systèmes, Hexagon AB, Autodesk, PTC, Cadence Design Systems, COMSOL, Keysight (ESI Group), Altair, Bentley Systems
Valuation Currency USD Billion

FAQs

What should procurement teams negotiate hardest on when buying into the computer-aided engineering market?
Solve-capacity terms, not seat count. Token pooling, burst allowances, and overage rates determine actual cost far more than headline licence price. Lock multi-year caps on compute unit pricing [15].
How does open-source software like OpenFOAM change vendor selection?
It handles exploratory work well but lacks the validation documentation regulators expect. Most buyers run it alongside commercial solvers rather than instead of them, reserving licensed tools for submission-grade analysis [16].
What integration failure most often stalls deployments in the computer-aided engineering market?
Geometry handoff. Mismatched CAD feature trees and missing parametric associativity force manual re-meshing, which erodes the automation case. Resolve the PLM connector before signing [18].
Is on-premises hardware still worth owning?
Only where utilisation exceeds roughly 60% or sovereignty rules forbid external hosting. Below that threshold, hosted burst capacity generally wins on total cost [6].
Which emerging use case is most underestimated across the computer-aided engineering market?
Additive manufacturing process simulation. Distortion and residual stress prediction determines whether printed parts qualify, and demand is scaling faster than most buyers have budgeted [4].
How should buyers evaluate AI-accelerated solver claims?
Demand accuracy benchmarks against reference solutions on your own geometry, not vendor demos. Ask specifically about extrapolation behaviour outside training ranges [7].
What regulatory nuance catches medical device firms out?
Credibility must be established for the specific question of interest, not the model generally. A validated model used for a new claim requires fresh evidence under the applicable framework [3][20].    
Author
Author
Author Profile
Kiran Jinkalwad LinkedIn
Research Associate Level - II
Kiran Jinkalwad brings over four years of experience in market research, specializing in the ICT and Semiconductor sectors. She has worked on 50+ projects, including custom studies for companies like Microsoft and Huawei, addressing complex business challenges. With a background in Electronics and Telecommunication, Kiran excels in market estimation, forecasting, and strategic analysis. His sharp analytical skills and industry knowledge consistently deliver actionable insights for diverse clients.
Co-Author
Co-Author Profile
Aarti Dhapte LinkedIn
AVP - Research
A consulting professional focused on helping businesses navigate complex markets through structured research and strategic insights. I partner with clients to solve high-impact business problems across market entry strategy, competitive intelligence, and opportunity assessment. Over the course of my experience, I have led and contributed to 100+ market research and consulting engagements, delivering insights across multiple industries and geographies, and supporting strategic decisions linked to $500M+ market opportunities. My core expertise lies in building robust market sizing, forecasting, and commercial models (top-down and bottom-up), alongside deep-dive competitive and industry analysis. I have played a key role in shaping go-to-market strategies, investment cases, and growth roadmaps, enabling clients to make confident, data-backed decisions in dynamic markets.

Research Approach


Secondary Research

The secondary research process involved comprehensive analysis of technology databases, peer-reviewed engineering journals, industry publications, and authoritative technology organizations. Key sources included the National Institute of Standards and Technology (NIST), International Organization for Standardization (ISO), Institute of Electrical and Electronics Engineers (IEEE), American Society of Mechanical Engineers (ASME), Society of Automotive Engineers (SAE International), International Association for the Engineering Analysis Community (NAFEMS), European Committee for Standardization (CEN), German Institute for Standardization (DIN), Japan Society of Mechanical Engineers (JSME), China Association for Science and Technology (CAST), Organisation for Economic Co-operation and Development (OECD) Science & Technology Indicators, World Intellectual Property Organization (WIPO) Patent Database, US Bureau of Labor Statistics (BLS) Occupational Employment Data, EU Eurostat Digital Economy & Society Database, and national statistics bureaus from key manufacturing markets.

Software adoption metrics, technology patent applications, regulatory compliance requirements, R&D spending patterns, and market landscape analyses for Finite Element Analysis (FEA), Computational Fluid Dynamics (CFD), Multibody Dynamics (MBD), Discrete Element Method (DEM), and new meshless simulation technologies were gathered from these sources.


Primary Research

In order to gather both qualitative and quantitative insights, supply-side and demand-side stakeholders were interviewed during the primary research process. CEOs, CTOs, VPs of Engineering, heads of product development, and commercial directors from CAE software vendors, cloud infrastructure providers, and suppliers of high-performance computing (HPC) solutions were examples of supply-side sources. Chief engineers, simulation directors, R&D chiefs, digital transformation officers, and procurement leads from automakers, aerospace and defense contractors, manufacturers of industrial machinery, electronics firms, and energy sector operators were examples of demand-side sources. In addition to gathering information on software licensing models, cloud migration trends, HPC adoption tactics, and integration dynamics with Industry 4.0 ecosystems, primary research verified product roadmap timelines and validated market segmentation.

Primary Respondent Breakdown:

By Designation: C-level Primaries (32%), Director Level (30%), Others (38%)

By Region: North America (38%), Europe (25%), Asia-Pacific (28%), Rest of World (9%)


Market Size Estimation

Revenue mapping and license deployment analysis were used to determine the global market valuation. The methodology comprised:

Finding more than fifty major software suppliers and service providers in North America, Europe, Asia-Pacific, and Latin America

Product mapping in developing AI-enhanced simulation categories as well as FEA, CFD, MBD, DEM, SPH, and BEM

Examination of reported and projected yearly income for CAE software portfolios and related services

Coverage of suppliers accounting for 75–80% of the world market in 2024

Extrapolation to obtain segment-specific valuations utilizing top-down (vendor revenue validation) and bottom-up (license volume × ASP by deployment model and location) methods

Download Free Sample

Kindly complete the form below to receive a free sample of this Report

* Please use a valid business email

Download PDF ×

We do not share your information with anyone. However, we may send you emails based on your report interest from time to time. You may contact us at any time to opt-out.

















