Request Free Sample ×

Kindly complete the form below to receive a free sample of this Report

* Please use a valid business email

Leading companies partner with us for data-driven Insights

clients tt-cursor
Hero Background

E commerce Market

ID: MRFR/ICT/17317-HCR
200 Pages
Kiran Jinkalwad, Aarti Dhapte
Last Updated: May 29, 2026
E-Commerce Market Size, Share and Trends Analysis Report By Product Category (Electronics, Fashion, Home Goods, Groceries, Health and Beauty), By Business Model (B2C, B2B, C2C, C2B), By Payment Method (Credit Card, Digital Wallet, Bank Transfer, Cash on Delivery), By Customer Type (Individual Consumers, Small Businesses, Large Enterprises) and By Regional (North America, Europe, South America, Asia Pacific, Middle East and Africa) - Forecast to 2035
Download PDF ×

We do not share your information with anyone. However, we may send you emails based on your report interest from time to time. You may contact us at any time to opt-out.


E commerce Market Summary

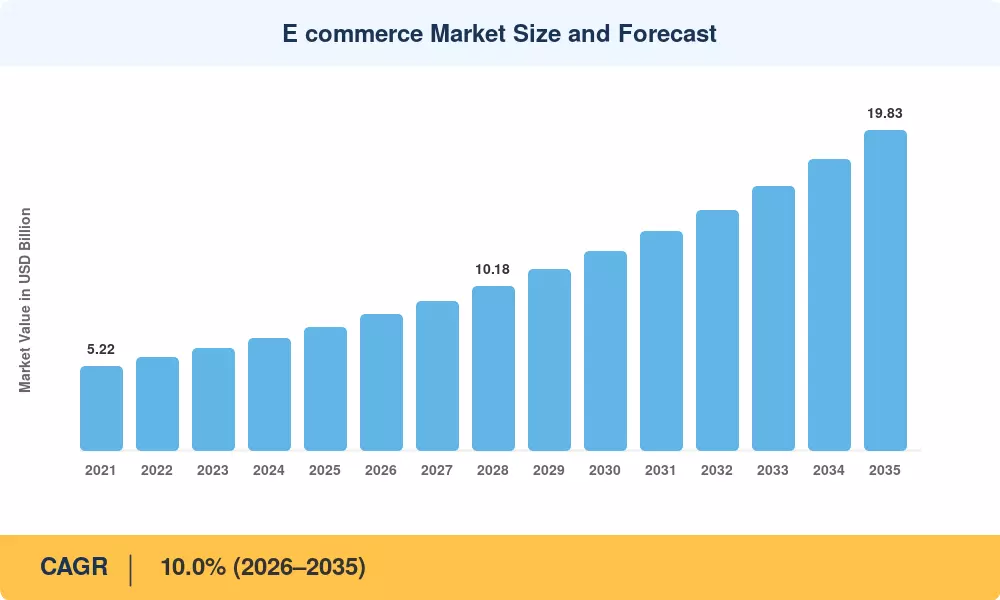
The global E Commerce Market reached an estimated USD 7.65 trillion in 2025 and is projected to grow from USD 8.42 trillion in 2026 to USD 19.83 trillion by 2035, registering a CAGR of 10.0% during the forecast period (2026–2035). This expansion is anchored in two converging forces: the worldwide proliferation of smartphone-connected consumers — with mobile internet penetration crossing 5.5 billion users in 2025 [2] — and aggressive government-led digital economy programs such as India's Digital India initiative and the EU's Digital Markets Act, both of which are reshaping how goods and services flow through e-commerce platforms [3].

A structural transformation is underway across the E Commerce Market as legacy monolithic storefronts give way to headless commerce for omnichannel retail architectures that decouple front-end experiences from back-end operations. Retailers invested over USD 22 billion globally in AI-powered product recommendation engines during 2024 alone, driving conversion-rate improvements of 15–25% for early adopters. D2C direct-to-consumer e-commerce platforms are dismantling traditional wholesale distribution, enabling brands to own the customer relationship end-to-end while leveraging mobile-first e-commerce checkout optimization to reduce cart abandonment rates below 55% for the first time [5].

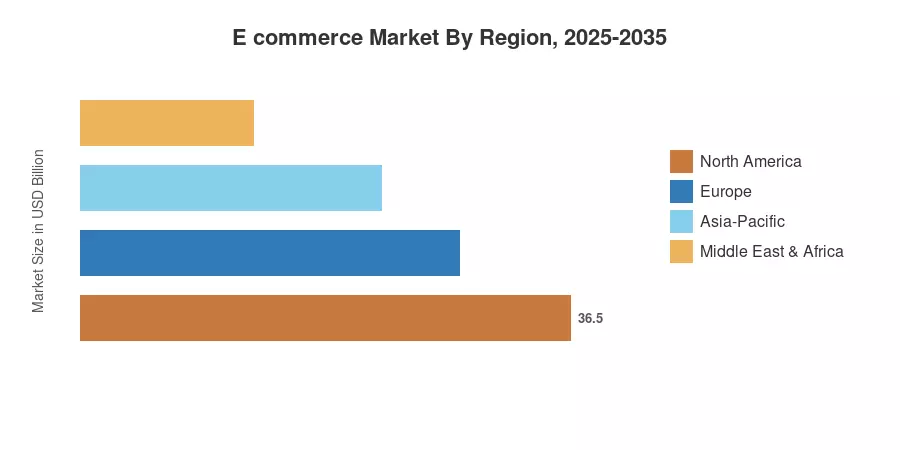
Asia-Pacific commands the largest share of the E Commerce Market at roughly 42.5%, led by China's mature ecosystem and India's rapid digital payments adoption. South America is emerging as the fastest-growing region with an estimated CAGR of 13.8%, fueled by fintech expansion and cross-border e-commerce logistics and compliance improvements across Brazil and Mexico [6]. North America holds approximately 24.3% of the global value, driven by subscription commerce and same-day delivery infrastructure. The E Commerce Market trajectory through 2035 will be defined by how quickly sellers adopt composable technology stacks and how effectively regulators harmonize cross-border trade rules.

Key Report Takeaways

• By Business Model

  • D2C direct-to-consumer e-commerce platforms account for approximately 18.5% of total E Commerce Market revenue in 2025, driven by lower customer acquisition costs and direct data ownership
  • Marketplace model remains the dominant format, projected to grow at a CAGR of 10.6% through 2035, supported by network effects and seller aggregation
  • Subscription commerce is the fastest-growing model segment within the E Commerce Market, registering 12.1% CAGR

• By Product Category

  • Electronics & media represent the largest product vertical at approximately USD 1.98 trillion in 2025
  • Fashion & apparel are expanding at 11.3% CAGR, propelled by virtual try-on features and AI-powered product recommendation engines
  • Grocery & fresh food capture roughly 9.2% of the E Commerce Market, accelerating post-pandemic

• By Region

  • Asia-Pacific leads the E Commerce Market with 42.5% share, anchored by China, India, and Southeast Asia
  • South America posts the highest regional CAGR at 13.8%, with Brazil and Mexico driving growth
  • Europe holds approximately 20.1% of global value, with headless commerce for omnichannel retail adoption accelerating in the UK and Germany

E Commerce Market Size and Forecast (2021–2035)

MRFR's market sizing combines top-down revenue modeling from national statistical agencies and e-commerce industry bodies with bottom-up aggregation of platform GMV disclosures, payment processor data, and logistics throughput analysis. Historical figures (2021–2024) rely on audited filings and government trade data; forecasts (2026–2035) apply econometric modeling with adjustments for mobile-first e-commerce checkout optimization adoption curves, regulatory shifts, and macroeconomic scenarios.

E commerce Market Size and Forecast
Our Impact
Enabled $4.3B Revenue Impact for Fortune 500 and Leading Multinationals
Partnering with 2000+ Global Organizations Each Year
30K+ Citations by Top-Tier Firms in the Industry
 

Driver Impact Analysis

Driver ~% Impact on CAGR Geographic Relevance Impact Timeline
Smartphone & mobile internet penetration ~22% Global Short-term (≤2 yr)
AI-powered product recommendation engines ~18% North America, Asia-Pacific Medium-term (2–4 yr)
D2C direct-to-consumer platform growth ~14% Global Medium-term (2–4 yr)
Digital payments & fintech infrastructure ~15% Latin America, Africa, South Asia Short-term (≤2 yr)
Headless commerce & composable architecture ~12% North America, Europe Long-term (≥4 yr)
Cross-border trade facilitation & logistics ~10% Global Long-term (≥4 yr)
Social & live-stream commerce ~9% Asia-Pacific, Latin America Short-term (≤2 yr)


Smartphone and Mobile Internet Penetration

The GSMA estimates that 5.5 billion individuals accessed mobile internet by the end of 2025, with an additional 800 million projected to connect by 2030 — predominantly in Sub-Saharan Africa and South Asia [2]. Mobile-first e-commerce checkout optimization has become the default design philosophy, with Shopify reporting that 73% of all transactions on its platform now originate from mobile devices. This connectivity tsunami directly enlarges the addressable consumer base of the E Commerce Market and compresses the path-to-purchase cycle from days to minutes.

AI-Powered Personalization and Recommendation Engines

Global spending on AI-powered product recommendation engines topped USD 22 billion in 2024, according to IDC's AI Spending Tracker. Amazon attributes 35% of its total revenue to algorithmic recommendations, a benchmark that D2C direct-to-consumer e-commerce platforms are racing to replicate using open-source large language models for semantic search and conversational shopping assistants. McKinsey estimates that effective personalization lifts revenue by 10–15% and reduces marketing waste by up to 30%, making AI the single highest-ROI technology investment across the E Commerce Market.

D2C Direct-to-Consumer Platform Growth

An anticipated USD 1.42 trillion was made by brands selling directly through their own e-commerce platforms in 2025; this growth was more than twice as rapid as that of marketplace-only vendors [9]. Even mid-market firms can now develop D2C direct-to-consumer e-commerce systems in a matter of weeks thanks to Shopify, BigCommerce, and Salesforce Commerce Cloud. Additionally, headless commerce for omnichannel retail architecture enables them to serve web, mobile app, social, and in-store from a single backend. This fundamental change in the e-commerce market is best shown by Nike's decision to stop using third-party retailers and make significant investments in its own direct-to-consumer (DTC) channel, which now accounts for more than 44% of total brand revenue [13].

Digital Payments and Fintech Infrastructure

Brazil's Pix system settled USD 1.5 trillion in 2024, and India's UPI handled over 14 billion transactions monthly by late 2024. These instances demonstrate how quick payment rails spur the expansion of the e-commerce market in emerging economies [10]. Buy-now-pay-later (BNPL) services are spreading throughout Latin America and Southeast Asia, giving unbanked people more purchasing power. In 2023–2024, Klarna and Mercado Pago together added 48 million new members. Compared to 42% in 2021, digital wallets now make up more over 50% of all online transactions worldwide [10].

Restraints Impact Analysis

Restraint impact percentages below indicate the estimated drag each factor exerts on E Commerce Market growth. These are directional, not additive to the baseline CAGR.

Restraint ~% Negative Impact on CAGR Geographic Relevance Impact Timeline
Data privacy regulation complexity ~−4% Europe, North America Short-term (≤2 yr)
Counterfeit goods and trust deficits ~−3% Asia-Pacific, Global Medium-term (2–4 yr)
Last-mile delivery cost inflation ~−3% Global Medium-term (2–4 yr)
Digital tax and tariff fragmentation ~−2% Cross-border corridors Long-term (≥4 yr)
Cybersecurity threats and fraud ~−2% Global Short-term (≤2 yr)

Data Privacy Regulation Complexity

The EU's GDPR enforcement actions topped EUR 4.2 billion in cumulative fines by 2024, while California's CPRA and India's DPDP Act impose layered consent and data localization requirements [14]. For sellers operating across jurisdictions, compliance costs can consume 2–5% of digital marketing budgets. These regulations constrain the ability of AI-powered product recommendation engines to leverage behavioral data, reducing personalization effectiveness and, by extension, E Commerce Market conversion rates. Small and mid-size sellers face disproportionate burdens, slowing their digital migration.

Counterfeit Goods and Consumer Trust Deficits

The OECD estimates that counterfeit and pirated goods represented USD 509 billion in global trade in 2023, with a significant share flowing through e-commerce platforms [15]. Product authentication challenges erode consumer trust, particularly in fashion, electronics, and pharmaceuticals. Platforms are deploying blockchain-based provenance tracking and seller verification programs, but adoption remains uneven. Trust deficits hit the E Commerce Market hardest in cross-border transactions, where buyers have limited recourse.

Last-Mile Delivery Cost Inflation

According to research, last-mile delivery accounts for 41% of overall supply chain costs, and labor constraints and fluctuating fuel prices continue to drive up per-parcel expenses [16]. Amazon Prime's same-day and next-day delivery requirements lead to a cost-service spiral that puts pressure on margins throughout the e-commerce industry. For foreign sellers, this problem is exacerbated by cross-border e-commerce logistics and compliance costs, as duties processing and reverse logistics add an average of USD 8–15 to each parcel.

E commerce Market Opportunities

Social and Live-Stream Commerce Expansion

In 2024, live-stream shopping brought in over USD 512 billion in China, and it is already rapidly expanding throughout Southeast Asia, Latin America, and the Middle East [8]. Bypassing conventional search-driven funnels, platforms such as TikTok Shop and Instagram Live Shopping are turning content engagement into instant sales, establishing a new acquisition channel inside the e-commerce market

Composable and Headless Commerce Architecture

Headless commerce for omnichannel retail is enabling retailers to deliver consistent experiences across mobile apps, smart speakers, in-store kiosks, and wearable devices from a single API layer. Gartner projects that by 2028, 60% of enterprise retailers will operate composable commerce stacks, up from under 20% in 2024 — a greenfield opportunity for technology vendors and system integrators serving the E Commerce Market

Emerging-Market Digital Leapfrogging

Africa's internet economy is projected to reach USD 180 billion by 2030, up from USD 115 billion in 2024, as mobile money and cross-border e-commerce logistics and compliance platforms enable first-time online buyers across Nigeria, Kenya, and Egypt [19]. D2C direct-to-consumer e-commerce platforms tailored to local payment methods and vernacular languages represent an underpenetrated opportunity

Data Monetization and Retail Media Networks

Retail media — advertising sold within e-commerce platforms — surpassed USD 140 billion globally in 2024 and is growing at 25% annually [20]. Amazon, Walmart, and Mercado Libre are converting first-party shopper data into high-margin advertising products, diversifying revenue streams and strengthening the E Commerce Market ecosystem

Cross-Border Trade Facilitation

The WTO's Joint Statement Initiative on E-Commerce, signed by 90 members, aims to harmonize customs thresholds, digital signatures, and consumer protection across borders [17]. Cross-border e-commerce logistics and compliance simplification could unlock an additional USD 2 trillion in trade by 2035, according to the World Economic Forum

E commerce Market Future Outlook

AI-Native Commerce and Autonomous Shopping

Generative AI will move beyond product recommendations into fully autonomous shopping agents that can negotiate prices, compare options across platforms, and execute purchases on a consumer's behalf. By 2030, Gartner projects that 30% of outbound marketing messages from large organizations will be AI-generated, and AI-powered product recommendation engines will evolve into AI-powered purchasing agents. The E Commerce Market will need to adapt storefront architectures to serve both human browsers and machine agents.

Platform Economics and Marketplace Consolidation

The next decade will see intensifying platform concentration paired with regulatory counter-pressure. Amazon, Alibaba, and Mercado Libre collectively processed over USD 2.8 trillion in GMV during 2024 [21]. Expect vertical-specific marketplaces — in agriculture, industrial parts, and healthcare — to emerge as the next wave of D2C direct-to-consumer e-commerce platforms that challenge horizontal giants. The E Commerce Market competitive landscape will increasingly reward composable, headless commerce for omnichannel retail capabilities that enable rapid channel expansion.

Sustainable and Circular Commerce

The EU's proposed Digital Product Passport regulation, effective 2027, will require full lifecycle transparency for products sold online [22]. Carbon-neutral delivery pledges by Amazon (2040 target) and Zalando (2025 for own operations) are raising the bar. By 2030, the World Economic Forum estimates that circular commerce models — resale, rental, refurbishment — could capture 10% of the total E Commerce Market, worth approximately USD 1.2 trillion [23].

Cross-Border Infrastructure and Regulatory Convergence

The WTO e-commerce moratorium on customs duties for digital transmissions, repeatedly extended since 1998, remains under debate but is increasingly likely to become permanent for most product categories [17]. Cross-border e-commerce logistics and compliance platforms are deploying blockchain-based customs documentation, real-time duty calculators, and decentralized identity verification. By 2035, cross-border transactions could represent 35% of total E Commerce Market value, up from approximately 22% in 2025, contingent on regulatory convergence across ASEAN, AfCFTA, and USMCA corridors [6].


E commerce Market Segmentation

By Business Model

Segment Key Metric Primary Demand Driver
B2C Marketplace 44.8% share (2025) Network effects, product breadth
D2C / Brand-Owned CAGR 12.4% First-party data, brand control
B2B E-Commerce USD 2.18 T (2025) Procurement digitization
Subscription Commerce CAGR 12.1% Recurring revenue, personalization
Social Commerce CAGR 14.7% Live-stream shopping, creator economy


B2C marketplaces remain the backbone of the E Commerce Market, with Amazon, Alibaba, and emerging regional players controlling the buyer-seller matching infrastructure. D2C direct-to-consumer e-commerce platforms represent the fastest structural shift, as brands seek to own customer data and avoid marketplace fees that can reach 15–30% of GMV. Shopify, BigCommerce, and Salesforce Commerce Cloud are the primary enablers, offering headless commerce for omnichannel retail capabilities that let brands sell seamlessly across web, mobile, social, and physical touchpoints.

Social commerce — purchases made directly within social media platforms — exceeded USD 700 billion globally in 2024, driven overwhelmingly by China's Douyin and WeChat ecosystems [8]. TikTok Shop's expansion into the US, UK, and Southeast Asia is bringing this model to Western markets, supported by AI-powered product recommendation engines that match creator content with shoppable product feeds. The E Commerce Market is shifting from search-driven discovery to content-driven impulse purchasing.

By Product Category

Segment Key Metric Primary Demand Driver
Electronics & Media 25.9% share (2025) High AOV, comparison shopping behavior
Fashion & Apparel CAGR 11.3% Virtual try-on, seasonal refresh cycles
Grocery & Fresh Food CAGR 13.5% Quick commerce, urban density
Health & Beauty USD 542 B (2025) Subscription models, influencer marketing
Furniture & Home CAGR 10.8% AR visualization, D2C disruption


Electronics & media is the largest product category within the E Commerce Market, benefiting from inherently digital product characteristics and a well-developed comparison-shopping infrastructure. Grocery and fresh food are the fastest-growing verticals, with quick-commerce players like Instacart, Getir, and Blinkit compressing delivery windows to under 15 minutes in major metropolitan areas. Mobile-first e-commerce checkout optimization is especially critical in grocery, where repeat purchasing frequency demands frictionless one-tap reordering.

By Platform Type

Segment Key Metric Primary Demand Driver
Web-Based Platforms 38.2% share (2025) Desktop B2B transactions, enterprise buying
Mobile App Commerce CAGR 11.8% Mobile-first UX, push notifications
Social Platform Commerce USD 712 B (2025) Creator economy, in-feed purchasing
Voice & Conversational CAGR 18.4% Smart speaker adoption, AI assistants


Mobile app commerce is rapidly overtaking web-based platforms in consumer-facing segments of the E Commerce Market. Mobile-first e-commerce checkout optimization — including biometric authentication, single-tap payments, and progressive web apps — is driving conversion rates 2.5x higher than mobile web. Voice and conversational commerce, while still nascent, represents the highest-growth platform segment as AI-powered product recommendation engines are integrated into Alexa, Google Assistant, and proprietary brand chatbots.

Regional Market Share Analysis

Region Key Metric Primary Investment Themes
Asia-Pacific 42.5% global share Super-app ecosystems, social commerce, and cross-border logistics
North America USD 1.86 T (2025) Retail media, subscription models, and AI personalization
Europe CAGR 9.4% Regulatory compliance, sustainable commerce, and headless architecture
Latin America CAGR 13.8% Fintech inclusion, D2C platforms, digital payment rails
Middle East & Africa CAGR 12.5% Mobile commerce, government digital transformation, logistics buildout
Total USD 7.65 T (2025)

The global E Commerce Market exhibits significant regional dispersion, shaped by digital infrastructure maturity, payment ecosystem development, and regulatory frameworks. Asia-Pacific continues to dominate in absolute value, while Latin America and the Middle East & Africa are registering the highest growth momentum through mobile-first e-commerce checkout optimization and fintech inclusion.

Asia-Pacific

Country Key Metric Key Driver
China 63.2% of regional share Super-app ecosystems (WeChat, Alipay)
India CAGR 14.2% UPI payments, vernacular commerce
Japan USD 234 B (2025) Mobile-first checkout, aging population logistics
South Korea 7.1% of regional share K-commerce exports, live streaming
Southeast Asia (ASEAN-6) CAGR 13.5% Shopee/Lazada duopoly, digital banking


Asia-Pacific's dominance in the E Commerce Market stems from China's USD 2.05 trillion GMV ecosystem — powered by Alibaba, JD.com, and Pinduoduo — alongside India's explosive growth driven by Flipkart, Meesho, and Reliance JioMart. India's Open Network for Digital Commerce (ONDC) initiative is decentralizing the marketplace model, while Southeast Asia's Shopee and Lazada continue investing in cross-border e-commerce logistics and compliance infrastructure to serve the region's 400 million digital consumers [6][21].

North America

Country Key Metric Key Driver
United States 88.4% of regional share Amazon dominance, retail media, AI-powered recommendations
Canada CAGR 9.8% Shopify ecosystem, bilingual commerce
Mexico CAGR 14.6% Mercado Libre expansion, fintech adoption


The North American E Commerce Market is defined by Amazon's infrastructure moat and the rapid maturation of retail media networks. Shopify powers over 4.6 million storefronts and has become the backbone of the D2C direct-to-consumer e-commerce platforms movement in the region. Mobile-first e-commerce checkout optimization is table stakes, with Apple Pay and Google Pay accounting for 31% of mobile transactions [5][20].

Europe

Country Key Metric Key Driver
United Kingdom 29.8% of regional share Marketplace maturity, open banking
Germany USD 142 B (2025) Headless commerce, B2B digitization
France CAGR 10.1% Luxury D2C, social commerce
Nordics 8.3% of regional share Sustainability-driven commerce, BNPL


Europe's E Commerce Market is being reshaped by the Digital Markets Act and Digital Services Act, which are redefining platform obligations around transparency, seller access, and data portability [3]. Headless commerce for omnichannel retail is advancing rapidly in Germany and the UK, where enterprise retailers like Zalando and ASOS are migrating to composable architectures. The region's commitment to sustainable commerce is creating demand for carbon-neutral delivery networks and circular-economy marketplaces [14].

Latin America

Country Key Metric Key Driver
Brazil 47.2% of regional share Pix payments, Mercado Libre ecosystem
Mexico USD 68 B (2025) Amazon Mexico growth, fintech penetration
Colombia CAGR 15.1% Rappi super-app, digital inclusion policy
Argentina CAGR 12.9% Inflation-hedging digital purchases


Latin America is the fastest-growing region in the E Commerce Market, propelled by Brazil's Pix instant payment system — which settled over USD 1.5 trillion in 2024 — and the rapid expansion of D2C direct-to-consumer e-commerce platforms by local and global brands [10]. Mercado Libre's integrated logistics arm, Mercado Envíos, now handles 80% of its own shipments, solving a critical cross-border e-commerce logistics and compliance bottleneck that had previously constrained regional growth.

Middle East & Africa

Country Key Metric Key Driver
UAE 28.5% of regional share Noon.com, government e-commerce mandates
Saudi Arabia CAGR 14.8% Vision 2030, digital payments growth
South Africa USD 8.2 B (2025) Takealot dominance, township logistics
Nigeria CAGR 16.3% Jumia growth, mobile money adoption


The Middle East & Africa segment of the E Commerce Market is accelerating through government-led digitization — Saudi Arabia's Vision 2030 targets 80% non-cash transactions by 2030, while the UAE's D33 agenda aims to double its digital economy over the next decade [19]. AI-powered product recommendation engines are being localized for Arabic and Swahili-language consumers, and mobile-first e-commerce checkout optimization is critical in markets where over 85% of internet access is mobile-only.


E commerce Market By Region, 2025-2035

Competitive Benchmarking

The E Commerce Market is moderately concentrated at the platform layer but highly fragmented across the seller ecosystem. The top five platform operators — Amazon, Alibaba, JD.com, Pinduoduo, and Shopify (as enabler) — collectively facilitate approximately 38–42% of global B2C online transaction value [21]. The HHI index for the platform segment is estimated at 850–1,000, indicating moderate concentration with significant regional variation.

Company Est. Revenue Share Range Key Offerings for E Commerce Market Strategic Positioning
Amazon ~13–15% Marketplace, AWS infrastructure, Prime logistics, retail media Full-stack ecosystem leader
Alibaba Group ~10–12% Tmall, Taobao, AliExpress, Cainiao logistics China + cross-border dominance
JD.com ~4–6% Self-operated logistics, JD Health, B2B procurement Quality-first, owned fulfillment
Shopify ~3–5% SaaS storefront, headless commerce, Shopify Fulfillment D2C enablement platform
Mercado Libre ~2–3% Marketplace, Mercado Pago, Mercado Envíos Latin America ecosystem
Sea Limited (Shopee) ~3–4% Southeast Asia marketplace, ShopeePay, logistics Emerging-market mobile-first
Walmart eCommerce ~3–4% Omnichannel, marketplace expansion, Walmart Connect ads Brick-and-click convergence
Pinduoduo (Temu) ~3–5% Group-buying, Temu international expansion Ultra-value, gamified commerce
eBay ~1–2% C2C/B2C marketplace, authentication services Refurbished and collectibles niche
Rakuten ~1–2% Points ecosystem, fintech integration, marketplace Japan loyalty-driven commerce

Recent News & Developments

  • Amazon (March 2025): Launched Rufus AI shopping assistant globally, integrating generative AI-powered product recommendation engines directly into the mobile checkout flow [Ref 4]
  • Shopify (January 2025): Acquired Deliverr's remaining logistics assets and announced Shopify Fulfillment Network 2.0, expanding two-day delivery coverage to 90% of US addresses for D2C direct-to-consumer e-commerce platforms [Ref 9]
  • TikTok Shop (November 2024): Surpassed USD 30 billion in annualized US GMV, validating social commerce as a structural growth channel within the E Commerce Market [Ref 8]
  • European Commission (September 2024): Designated six e-commerce platforms as "gatekeepers" under the Digital Markets Act, requiring interoperability and data portability compliance by March 2025 [Ref 3]
  • Mercado Libre (July 2024): Invested USD 2.6 billion in logistics and fintech infrastructure across Brazil and Mexico, strengthening cross-border e-commerce logistics and compliance capabilities [Ref 10]
  • India's ONDC (May 2024): Open Network for Digital Commerce crossed 100,000 registered sellers, decentralizing the marketplace model and enabling mobile-first e-commerce checkout optimization for small merchants [Ref 21]
  • Walmart (February 2024): Launched a headless commerce API suite for third-party sellers, enabling headless commerce for omnichannel retail integration across physical stores and digital channels [Ref 11]
  • Alibaba (October 2023): Restructured into six independent business groups, spinning off Cainiao logistics for IPO preparation — signaling strategic focus on core E Commerce Market operations [Ref 21]

E commerce Market Report Scope

Parameter Details
Market Scope Global E Commerce Market covering B2C, B2B, D2C, social, and subscription models
Study Period 2021–2035
Historical Period 2021–2024
Base Year 2025
Forecast Period 2026–2035
CAGR (Forecast) 10.0% (2026–2035)
Market Size Checkpoints USD 7.65 T (2025); USD 8.42 T (2026); USD 19.83 T (2035)
Fastest Growing Segments Social commerce (14.7% CAGR); Latin America (13.8% CAGR)
Companies Profiled Amazon, Alibaba, JD.com, Shopify, Mercado Libre, Sea Limited, Walmart, Pinduoduo, eBay, Rakuten
Valuation Currency USD (current prices)


FAQs

How should investors evaluate unit economics when comparing marketplace vs. D2C e-commerce models?

Marketplace businesses typically achieve 60–70% gross margins on take-rate revenue but face GMV concentration risk, while D2C direct-to-consumer e-commerce platforms carry 40–55% gross margins with higher customer lifetime value. Investors should focus on contribution margin after fulfillment costs and customer acquisition cost payback periods, which average 6–9 months for top-quartile D2C operators.

What technical trade-offs should enterprises consider when migrating to headless commerce architecture?

Headless commerce for omnichannel retail decouples the presentation layer from commerce logic, enabling faster front-end iteration but requiring dedicated API management and DevOps investment. Total cost of ownership typically rises 15–25% in year one before declining as development velocity improvements compound.

How do AI-powered recommendation engines handle cold-start problems for new product catalogs?

AI-powered product recommendation engines address cold-start by combining collaborative filtering with content-based embeddings — using product metadata, images, and descriptions to generate initial recommendations. Transfer learning from adjacent catalogs can reduce cold-start accuracy gaps by 40–50% within the first two weeks of deployment.

Which cross-border trade corridors offer the highest near-term growth for e-commerce sellers?

China-to-Southeast Asia and China-to-Latin America corridors are expanding fastest, driven by Temu and Shein's logistics investments. The US-to-Europe corridor remains the highest-value route but faces growing cross-border e-commerce logistics and compliance friction from the EU's IOSS VAT framework [6][17].

How are BNPL regulations likely to reshape checkout conversion rates across the E Commerce Market?

The UK's FCA and the EU's Consumer Credit Directive updates will require full affordability checks for BNPL by 2026, likely reducing approval rates by 10–15%. Mobile-first e-commerce checkout optimization strategies should pre-qualify buyers silently to maintain conversion while meeting regulatory requirements.

What warehouse automation ROI benchmarks should e-commerce operators target?

Leading fulfillment centers achieve 18–24 month ROI on goods-to-person robotics systems, with labor cost reductions of 30–40% and throughput increases of 2–3x. Mid-size E Commerce Market operators should target sub-36-month payback when deploying partial automation [16].

How will the EU's Digital Product Passport requirement impact e-commerce seller onboarding?

Sellers listing textiles, batteries, and electronics on EU-facing e-commerce platforms will need machine-readable lifecycle data by 2027. Compliance costs for small sellers are estimated at EUR 2,000–5,000 per product category, creating a potential consolidation trigger within the E Commerce Market seller base [22].

Author
Author
Author Profile
Kiran Jinkalwad LinkedIn
Research Associate Level - II
Kiran Jinkalwad brings over four years of experience in market research, specializing in the ICT and Semiconductor sectors. She has worked on 50+ projects, including custom studies for companies like Microsoft and Huawei, addressing complex business challenges. With a background in Electronics and Telecommunication, Kiran excels in market estimation, forecasting, and strategic analysis. His sharp analytical skills and industry knowledge consistently deliver actionable insights for diverse clients.
Co-Author
Co-Author Profile
Aarti Dhapte LinkedIn
AVP - Research
A consulting professional focused on helping businesses navigate complex markets through structured research and strategic insights. I partner with clients to solve high-impact business problems across market entry strategy, competitive intelligence, and opportunity assessment. Over the course of my experience, I have led and contributed to 100+ market research and consulting engagements, delivering insights across multiple industries and geographies, and supporting strategic decisions linked to $500M+ market opportunities. My core expertise lies in building robust market sizing, forecasting, and commercial models (top-down and bottom-up), alongside deep-dive competitive and industry analysis. I have played a key role in shaping go-to-market strategies, investment cases, and growth roadmaps, enabling clients to make confident, data-backed decisions in dynamic markets.

Research Approach


Secondary Research

The secondary research process involved comprehensive analysis of regulatory databases, industry publications, government statistical archives, and authoritative digital economy organizations. Key sources included the U.S. Census Bureau (Quarterly Retail E-Commerce Sales, Annual Retail Trade Surveys), U.S. Bureau of Labor Statistics (Consumer Expenditure Surveys), Federal Trade Commission (FTC), European Commission's Directorate-General for Internal Market, Industry, Entrepreneurship and SMEs (DG GROW), Eurostat Digital Economy & Society Statistics, UNCTAD (United Nations Conference on Trade and Development) Digital Economy Reports, World Bank Digital Development Indicators, International Telecommunication Union (ITU) Internet Usage Statistics, National Retail Federation (NRF), eMarketer/Insider Intelligence, Statista Digital Market Insights, Forrester Research E-Commerce Forecasts, McKinsey & Company Global Institute Reports on Digital Commerce, Goldman Sachs Digital Economy Research, PwC Global Consumer Insights Survey, Deloitte Global Retail Outlook, Alibaba Group Research Institute, Amazon Economic Impact Studies, Singapore Ministry of Trade & Industry E-Commerce Data, China Ministry of Commerce E-Commerce Reports, India Ministry of Electronics & Information Technology (MeitY) E-Commerce Statistics, and OECD Digital Economy Outlook.

For B2C, B2B, C2C, and C2B business models across Electronics, Fashion, Home Goods, Groceries, and Health & Beauty segments, these sources were used to gather transaction volume data, cross-border e-commerce statistics, digital payment adoption metrics, consumer behavior trends, and regulatory landscape analysis.


Primary Research

In order to gather both qualitative and quantitative insights, supply-side and demand-side stakeholders were interviewed during the primary research process. CEOs, Chief Digital Officers (CDOs), VPs of E-Commerce Strategy, heads of Marketplace Operations, and Chief Technology Officers from omnichannel retail businesses, third-party logistics companies, e-commerce platform operators, and payment gateway providers were examples of supply-side suppliers. Chief Procurement Officers, Heads of Digital Strategy, and E-Commerce Directors from consumer goods manufacturers, fashion brands, electronics OEMs, grocery stores, and B2B companies were examples of demand-side sources. Market segmentation, technology implementation schedules, platform acceptance trends, customer acquisition cost trends, logistics optimization tactics, and cross-border trade dynamics were all confirmed by primary research.

Primary Respondent Breakdown:

By Designation: C-level Primaries (28%), Director Level (32%), Others (40%)

By Region: North America (32%), Europe (25%), Asia-Pacific (34%), Rest of World (9%)


Market Size Estimation

Revenue analysis and transaction value mapping were used to get the global market valuation. The methodology comprised:

Finding more than fifty major e-commerce platform operators in North America, Europe, Asia-Pacific, the Middle East and Africa, and Latin America Product mapping in the areas of electronics, fashion, groceries, home goods, health and beauty, and developing categories

Examination of reported and simulated Gross Merchandise Value (GMV), Net Revenue, and Commission-based revenue in relation to e-commerce operations

Coverage of operators with 75–80% of the whole market in 2024

Extrapolation of segment-specific valuations utilizing top-down (platform revenue validation against national retail statistics) and bottom-up (unique buyer count × average order value × transaction frequency per country) methods

Download Free Sample

Kindly complete the form below to receive a free sample of this Report