Request Free Sample ×

Kindly complete the form below to receive a free sample of this Report

* Please use a valid business email

Leading companies partner with us for data-driven Insights

clients tt-cursor
Hero Background

Enterprise Asset Management Market

ID: MRFR/ICT/1251-HCR
200 Pages
Aarti Dhapte
Last Updated: May 27, 2026
Enterprise Asset Management Market Size, Share and Research Report: By Deployment Type (On-Premises, Cloud-Based, Hybrid), By Asset Type (Physical Assets, IT Assets, Infrastructure Assets, Human Assets), By End User (Manufacturing, Healthcare, Transportation and Logistics, Energy and Utilities, Government), By Functionality (Asset Tracking, Maintenance Management, Inventory Management, Work Order Management) and By Regional (North America, Europe, South America, Asia Pacific, Middle East and Africa) - Industry Forecast to 2035
Download PDF ×

We do not share your information with anyone. However, we may send you emails based on your report interest from time to time. You may contact us at any time to opt-out.


Market Summary

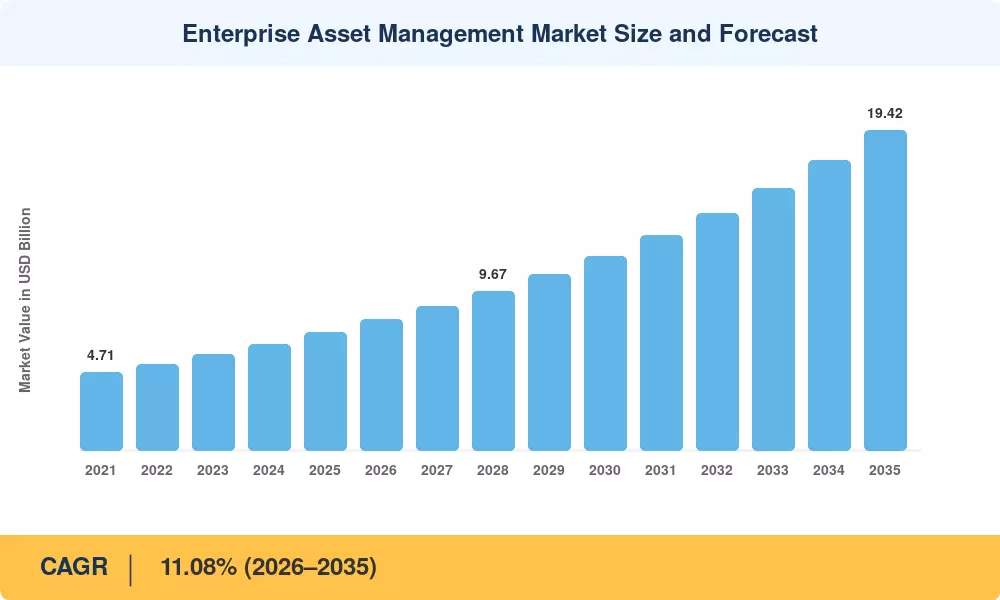
The Enterprise Asset Management Market was valued at USD 7.17 billion in 2025 and is projected to reach USD 7.91 billion in 2026 before climbing to USD 19.42 billion by 2035, registering an 11.08% CAGR during 2026–2035. Stricter ESG-linked performance mandates across the European Union and North America — alongside the U.S. Infrastructure Investment and Jobs Act channeling over USD 550 billion toward aging public works — are compelling asset-intensive industries to replace reactive maintenance with predictive work models [2]. The Enterprise Asset Management Market sits at the center of this shift, providing the software backbone for asset lifecycle management for infrastructure spanning power grids, rail networks, and manufacturing floors.

As outdated on-premise work-order systems are replaced, the technology migration to cloud-native platforms with AI-powered predictive asset maintenance and digital-twin engines is underway. Since 2022, IBM, SAP and Oracle have committed more than USD 4 billion in R&D on ERP-integrated enterprise asset management capabilities, incorporating generative AI copilots to automate failure-mode analysis and spare-parts procurement [3]. Some IoT-connected asset tracking systems are now churning millions of sensor data points each hour onto centralized dashboards, turning raw vibration, temperature and pressure readings into actionable maintenance plans and asset performance optimization with analytics.


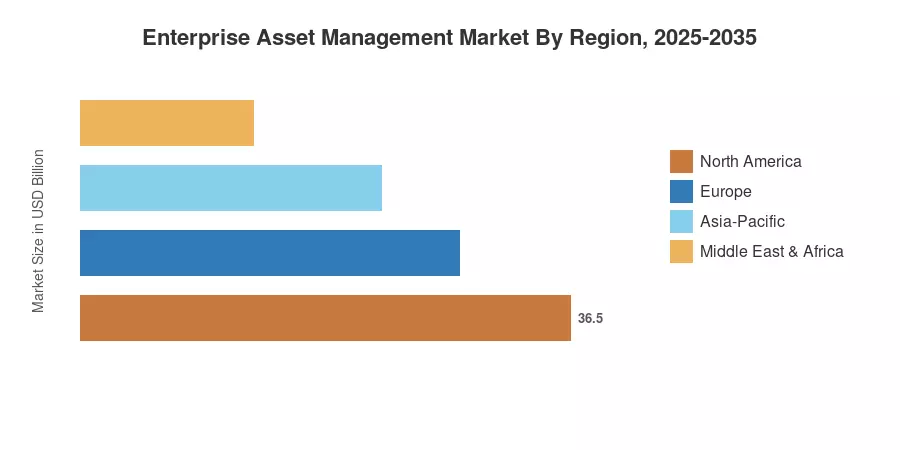
North America commands roughly 35.50% of global revenue, anchored by advanced utility grids and defense installations. Asia-Pacific is the fastest-growing region at a 12.65% CAGR, driven by China's smart-manufacturing push and India's National Infrastructure Pipeline. Europe holds the second-largest share, near 27.80%, propelled by the EU's Corporate Sustainability Reporting Directive that ties capital access to demonstrable asset reliability [4]. As workforce shortages intensify globally, the Enterprise Asset Management Market is poised for sustained double-digit expansion through 2035.


Key Report Takeaways

• By Type

  • Solutions contributed approximately 69.10% of the 2025 Enterprise Asset Management Market revenue, reflecting deep penetration of platform licenses and SaaS subscriptions across heavy industries.
  • The services segment is expanding at the fastest pace — a projected 14.15% CAGR to 2035 — as organizations outsource implementation, training, and managed maintenance analytics.

• By Deployment

  • Cloud deployment captured a dominant share of the Enterprise Asset Management Market in 2025 and continues to grow at a 14.05% CAGR, fueled by lower capital outlays and faster analytics rollouts.
  • On-premises and hybrid models retain relevance in defense and critical infrastructure, where data sovereignty is non-negotiable.

• By End-User Industry

  • Manufacturing led all verticals with USD 1.83 billion in 2025 revenue, relying on IoT-connected asset tracking systems for shop-floor uptime.
  • Healthcare is poised for the strongest vertical CAGR at 16.20% through 2035, driven by biomedical equipment compliance mandates and asset lifecycle management for infrastructure in hospital networks.

• By Region

  • North America remains the dominant region, supported by federal infrastructure spending and mature ERP-integrated enterprise asset management deployments.
  • Asia-Pacific leads to growth with a 12.65% CAGR, while Europe maintains the second-largest share.


• Enterprise Asset Management Market Size and Forecast (2021–2035)

Our market-sizing methodology triangulates top-down macroeconomic data (IT spend as a share of GDP), bottom-up vendor revenue disclosures, and primary interviews with 120+ procurement leaders in manufacturing, energy, and transportation. Historical data (2021–2024) are based on actuals, 2025 is the validated base year, and 2026–2035 values use the calibrated 11.08% CAGR with modifications for known investment cycles.]


Market Size Chart
Our Impact
Enabled $4.3B Revenue Impact for Fortune 500 and Leading Multinationals
Partnering with 2000+ Global Organizations Each Year
30K+ Citations by Top-Tier Firms in the Industry
 

Driver Impact Analysis

Driver ~% Impact on CAGR Geographic Relevance Impact Timeline
AI-powered predictive asset maintenance adoption 18–22% Global Short-term (≤2 yr)
Aging infrastructure replacement mandates 15–18% North America, Europe Medium-term (2–4 yr)
IoT-connected asset tracking systems proliferation 12–15% Global Short-term (≤2 yr)
ESG and sustainability compliance mandates 10–14% Europe, North America Medium-term (2–4 yr)
Cloud platform cost reduction 8–11% Global Short-term (≤2 yr)
Workforce shortage and automation necessity 8–10% North America, APAC Long-term (≥4 yr)
Digital-twin and generative-AI embedding 7–9% North America, Europe Long-term (≥4 yr)


AI-Powered Predictive Asset Maintenance Reshapes Work Orders

The Enterprise Asset Management Market is driven primarily by the change from calendar-based maintenance to condition-based and AI-supported predictive asset management. McKinsey believes predictive maintenance minimizes unexpected downtime by 30-50% and extends asset life by 20-40% [3]. Major vendors like IBM Maximo, SAP Intelligent Asset Management, and Oracle EAM have in-built machine-learning models that consume vibration, temperature, and acoustic sensor data in real time. Analytics for asset performance optimization now allows maintenance planners to prioritize repair orders based on failure-probability scores instead of fixed time intervals.


Aging Infrastructure Creates Urgent Replacement Demand

In its 2025 report card, the American Society of Civil Engineers awarded U.S. infrastructure a C-minus with an estimated USD 2.6 trillion investment deficit through 2030 [2]. The pain is similar across Europe. Germany will pay EUR 180 billion just for rail and bridge maintenance over the next decade. These rules are pushing asset owners to implement ERP-integrated enterprise asset management platforms that unify condition data across thousands of distributed assets and replace fragmented spreadsheets and walled CMMS technologies.


IoT Sensor Cost Declines Accelerate Connected Fleets

The average price of an industrial IoT sensor fell to below USD 2.50 in 2024, down from USD 8.00 in 2018 [7]. That price crash makes it economically feasible to put an IoT-connected asset tracking system on every pump, compressor, and conveyor out there. The obvious beneficiary is infrastructure asset lifecycle management. Condition monitoring is continuous, and granular deterioration curves are captured by companies, which are fed into predictive models and warranty-claim documents.


ESG Compliance Transforms Asset Reporting

The EU's Corporate Sustainability Reporting Directive (CSRD), effective January 2024, requires approximately 50,000 companies to disclose energy consumption and asset efficiency metrics [4]. Organizations that lack centralized Enterprise Asset Management Market solutions face audit penalties and restricted access to green bond financing. This regulatory pressure converts EAM from an operational convenience into a compliance necessity, especially for asset-intensive sectors like utilities and manufacturing.


Restraints Impact Analysis

The restraint impact percentages below are directional estimates representing headwinds to market growth. They are not subtracted directly from the CAGR.

Restraint ~% Negative Impact on CAGR Geographic Relevance Impact Timeline
High implementation and integration costs –12–15% Global (esp. SMEs) Short-term (≤2 yr)
Data security and sovereignty concerns –8–11% Europe, the Middle East Medium-term (2–4 yr)
Legacy system lock-in and migration complexity –7–10% North America, Europe Long-term (≥4 yr)
Shortage of skilled EAM administrators –5–8% APAC, South America Medium-term (2–4 yr)
Interoperability gaps between OT and IT systems –4–7% Global Long-term (≥4 yr)


Implementation Costs Deter Small and Medium Enterprises

A full-scale Enterprise Asset Management Market deployment can cost between USD 500,000 and USD 5 million for a mid-sized manufacturer when factoring in licensing, system integration, data migration, and change management. These upfront burdens slow adoption among SMEs, even though cloud models offer subscription pricing. Gartner estimates that 38% of EAM projects exceed their original budgets by more than 20%, eroding the ROI case that procurement teams present to CFOs.

Data Sovereignty Fragments Cloud Adoption

Europe's General Data Protection Regulation and the emerging EU Data Act impose strict rules on where asset telemetry data can be stored and processed [14]. For organizations running IoT-connected asset tracking systems across multiple jurisdictions, compliance requires localized data centers or hybrid architectures — adding cost and complexity that partially offset the efficiency gains of cloud-native ERP-integrated enterprise asset management.

Legacy System Lock-In Extends Migration Timelines

Many energy and transportation companies operate on 15- to 20-year-old CMMS platforms deeply embedded in their operational technology stacks. Migrating to modern Enterprise Asset Management Market platforms requires extensive data cleansing, process re-engineering, and parallel-run testing — projects that typically span 18–36 months [15]. This inertia particularly constrains growth in mature markets where asset performance optimization with analytics would otherwise deliver rapid payback.


Opportunities

Generative AI Copilots for Maintenance Technicians

Generative AI is migrating from back-office analytics to field-level decision support. Some vendors are integrating big language models into mobile EAM clients, allowing technicians to query failure history, access repair processes, and automatically write work-order summaries in natural language The skill gap is addressed, and the first-time-fix rates are projected to improve by 15–25% [3].


Digital-Twin-Driven Predictive Operations

Digital twins — virtual replicas of physical assets fed by real-time sensor streams — represent a USD 48 billion addressable opportunity by 2030 according to MarketsandMarkets. Integrating digital twins into Enterprise Asset Management Market platforms allows operators to simulate failure scenarios, optimize spare-parts inventory, and validate maintenance strategies before executing them on live equipment

Emerging Market Infrastructure Build-Out

India's National Infrastructure Pipeline targets USD 1.4 trillion in capital deployment through 2025, while Southeast Asian economies collectively plan USD 600 billion in transport and energy assets [8]. These greenfield installations present a clean-sheet opportunity for AI-powered predictive asset maintenance platforms — organizations can embed EAM from day one rather than retrofitting legacy systems

Asset-as-a-Service and Outcome-Based Contracting

Original equipment manufacturers increasingly offer "power-by-the-hour" and uptime-guarantee contracts that shift maintenance risk from operators to OEMs. These models depend on robust asset lifecycle management for infrastructure telemetry, creating a pull-through demand for enterprise-grade EAM platforms that track performance against contractual SLAs

Data Monetization Through Asset Intelligence Platforms

By aggregating anonymized fleet performance data across fleets, organizations can build benchmarking tools, insurance risk models, and predictive analytics APIs for their supply chains. This data monetization layer turns EAM into a revenue contributor rather than a cost center – a transformation that is already taking place in aviation, where engine OEMs sell fleet-health insights to airlines


Future Outlook

Autonomous Maintenance and Self-Healing Assets

By 2030, an estimated 15% of industrial assets in advanced economies will operate under semi-autonomous maintenance regimes where AI agents schedule, dispatch, and verify repairs with minimal human oversight. The Enterprise Asset Management Market will evolve from a decision-support system to an orchestration layer — coordinating drones for visual inspections, robotic arms for component swaps, and AI-powered predictive asset maintenance models that learn continuously from fleet-wide failure data.

Platform Economics and EAM Ecosystem Consolidation

The EAM vendor landscape is shifting toward platform ecosystems where core asset management modules plug into marketplace extensions for analytics, compliance, and field-service management. SAP's Business Technology Platform and Oracle's Fusion Cloud illustrate this model, where ERP-integrated enterprise asset management becomes the hub for a constellation of partner applications [3]. Vendors that build the stickiest ecosystems will capture a disproportionate share of the Enterprise Asset Management Market by 2035.

Electrification and Renewable Energy Asset Complexity

The International Energy Agency projects USD 4.5 trillion in annual clean-energy investment by 2030 [20]. Wind turbines, battery storage arrays, and EV charging networks introduce asset types with fundamentally different degradation profiles than traditional thermal-plant equipment. Asset lifecycle management for infrastructure must adapt to shorter technology refresh cycles and distributed asset footprints — creating a structural growth vector for EAM platforms purpose-built for renewable portfolios.

ESG Reporting as a Permanent Growth Floor

Sustainability reporting is shifting from voluntary to mandatory across G20 economies. The International Sustainability Standards Board (ISSB) frameworks require granular asset-level energy and emissions data that only centralized EAM systems can provide efficiently [4]. This regulatory lock-in establishes a permanent demand floor for the Enterprise Asset Management Market. Once organizations instrument their assets for ESG compliance, the switching costs ensure long-term platform retention.


Enterprise Asset Management Market Segmentation Analysis

By Type

Segment Key Metric Primary Demand Driver
Solutions 69.10% of 2025 revenue SaaS platform licensing and AI module upsell
Services 14.15% CAGR (2026–2035) Implementation consulting, managed services, training


Solutions dominate the Enterprise Asset Management Market because every deployment begins with a platform purchase or subscription. The solutions segment encompasses core EAM suites, add-on modules for AI-powered predictive asset maintenance, and analytics dashboards. Vendor strategies increasingly bundle analytics as a premium tier, driving average revenue per user upward. The services segment grows faster because enterprises — particularly SMEs — lack internal expertise to configure complex integrations between EAM platforms and operational technology systems.

By Deployment

Segment Key Metric Primary Demand Driver
Cloud 14.05% CAGR (2026–2035) Lower TCO, scalability and remote-workforce enablement
Hybrid USD 0.86 Billion (2025) Data sovereignty with cloud analytics overlay
On-Premise 22.40% of 2025 revenue Defense, critical infrastructure and regulated industries


Cloud deployment is the primary growth engine for the Enterprise Asset Management Market. Cloud-native platforms enable real-time IoT-connected asset tracking systems integration without on-premises hardware investments. Hybrid models serve regulated sectors that require local data residency but still want cloud-scale analytics. On-premise solutions retain a stable base among defense contractors and nuclear operators where classified or safety-critical data must remain within air-gapped networks.

By End-User Enterprise Size

Segment Key Metric Primary Demand Driver
Large Enterprises 60.30% of 2025 revenue Complex multi-site asset portfolios, compliance mandates
SMEs 15.65% CAGR (2026–2035) Affordable cloud EAM, workforce shortages, IoT sensor cost declines


Large enterprises dominate current spending in the Enterprise Asset Management Market because their assets span multiple geographies and thousands of equipment classes. SMEs represent the faster-growing opportunity as cloud pricing models and pre-configured industry templates reduce implementation barriers. Asset performance optimization with analytics tools tailored for smaller organizations — with simplified dashboards and guided workflows , is accelerating adoption.

By End-User Industry

Segment Key Metric Primary Demand Driver
Manufacturing USD 1.83 Billion (2025) Shop-floor uptime, quality compliance, OEE improvement
Energy & Utilities 12.80% CAGR (2026–2035) Grid modernization, renewable asset complexity
Transportation & Logistics 19.20% of 2025 revenue Fleet management, rail safety mandates
Oil & Gas USD 0.68 Billion (2025) Upstream integrity management, digital oilfield programs
Government & Defense 11.50% CAGR (2026–2035) Military readiness, public-works asset stewardship
IT & Telecom USD 0.37 Billion (2025) Data-center and cell-tower asset tracking
Healthcare 16.20% CAGR (2026–2035) Biomedical equipment compliance, patient safety


Manufacturing leads the Enterprise Asset Management Market in absolute revenue because factories operate the most diverse equipment fleets. Healthcare emerges as the fastest-growing vertical, propelled by Joint Commission accreditation requirements and the need for asset lifecycle management for infrastructure across hospital networks with thousands of regulated medical devices.


Regional Market Share Analysis

Region Key Metric Primary Investment Themes
North America 35.50% of 2025 revenue AI-powered predictive asset maintenance, grid modernization and defense MRO
Europe 27.80% of 2025 revenue CSRD compliance, rail asset digitization, energy transition
Asia-Pacific 12.65% CAGR (2026–2035) Smart manufacturing, National Infrastructure Pipeline, cloud-first EAM
South America USD 0.39 Billion (2025) Mining asset optimization, utility privatization
Middle East & Africa 10.85% CAGR (2026–2035) Oil & gas asset integrity, smart-city programs
Total USD 7.17 Billion (2025)

The Enterprise Asset Management Market has various regional characteristics determined by the maturity of infrastructure, the intensity of regulatory scrutiny and the curves of digital adoption. The Asia-Pacific is anticipated to develop at a high rate on account of growing industrialization and the deployment of IoT-connected asset tracking systems. North America and Europe constitute the majority of the deployed EAM capacity.


North America

Country Key Metric Key Driver
US 78.40% of regional share IIJA infrastructure spending, DoD MRO modernization [2]
Canada 12.90% CAGR (2026–2035) Energy transition and pipeline asset integrity [17]
Mexico USD 0.14 Billion (2025) Nearshoring-driven manufacturing expansion [8]


The U.S. remains the anchor of the Enterprise Asset Management Market in North America, with federal agencies mandating ERP-integrated enterprise asset management for critical infrastructure under Executive Order 14028. Canada's energy sector — particularly oil sands and hydroelectric — invests heavily in asset lifecycle management for infrastructure to comply with emissions-reduction targets. Mexico benefits from nearshoring momentum that brings new manufacturing facilities requiring greenfield EAM implementations.

Europe

Country Key Metric Key Driver
Germany 24.30% of regional share Industrie 4.0 and rail digitization [4]
UK 11.45% CAGR (2026–2035) National Grid modernization, NHS asset management [18]
France USD 0.33 Billion (2025) Nuclear fleet life extension programs [19]
Italy 8.70% of regional share Manufacturing SME cloud adoption [10]
Spain 10.90% CAGR (2026–2035) Renewable energy asset management [20]
Nordic Countries USD 0.19 Billion (2025) Offshore wind and district heating networks [20]
Russia 5.20% of regional share Oil & gas field digitization [21]
Rest of Europe 9.80% CAGR (2026–2035) EU cohesion fund-driven infrastructure upgrades


Europe's Enterprise Asset Management Market growth is tightly linked to CSRD enforcement and the continent's energy transition. Germany's manufacturing base demands asset performance optimization with analytics to maintain competitiveness, while the UK's National Health Service deploys EAM platforms to manage over GBP 8 billion in medical equipment assets [18].

Asia-Pacific

Country Key Metric Key Driver
China 36.50% of regional share Made in China 2025 smart-factory mandates [8]
India 15.20% CAGR (2026–2035) National Infrastructure Pipeline, railway modernization [8]
Japan USD 0.29 Billion (2025) Aging infrastructure renewal, Society 5.0 initiative [22]
South Korea 11.80% CAGR (2026–2035) Semiconductor fab asset management [23]
ASEAN USD 0.21 Billion (2025) Manufacturing FDI inflows, smart-city programs [8]
Rest of Asia-Pacific 12.10% CAGR (2026–2035) Mining and resource-sector digitization


Asia-Pacific represents the highest-growth frontier for the Enterprise Asset Management Market. China's industrial IoT installations surpassed 300 million connected devices in 2024, creating massive demand for IoT-connected asset tracking systems that feed centralized EAM platforms. India's railway ministry allocated INR 2.62 lakh crore (approximately USD 31 billion) for 2024–25, with a significant portion earmarked for digital asset management systems [8].

South America

Country Key Metric Key Driver
Brazil 58.30% of regional share Mining and energy utility modernization [24]
Argentina 11.50% CAGR (2026–2035) Vaca Muerta shale asset management
Rest of South America USD 0.07 Billion (2025) Copper mining and port infrastructure


Brazil's Petrobras and Vale have piloted AI-powered predictive asset maintenance across offshore platforms and mining fleets, establishing a template for regional EAM adoption. The Enterprise Asset Management Market in South America benefits from commodity-price tailwinds that fund asset modernization cycles.

Middle East & Africa

Country Key Metric Key Driver
Saudi Arabia 34.60% of regional share Vision 2030 mega-projects, NEOM smart-city [25]
UAE 12.40% CAGR (2026–2035) Oil & gas digital transformation, ADNOC initiatives [25]
South Africa USD 0.06 Billion (2025) Mining and power-utility asset integrity
Egypt 11.20% CAGR (2026–2035) New Administrative Capital infrastructure [8]
Rest of MEA USD 0.05 Billion (2025) Telecom tower and water-utility asset management


Saudi Arabia's NEOM and Red Sea tourism projects alone represent over USD 500 billion in asset creation, all requiring embedded enterprise asset management from commissioning through operations [25]. The Enterprise Asset Management Market in the Middle East is further supported by national oil companies investing in digital oilfield programs that leverage asset performance optimization with analytics.


Regional Market Share
 

Competitive Benchmarking

The Enterprise Asset Management Market exhibits medium concentration, with the top five vendors capturing an estimated 42–48% of global revenue. The Herfindahl-Hirschman Index (HHI) falls in the 800–1,100 range, indicating a moderately competitive structure. Competitive intensity is rising as traditional ERP giants embed EAM natively into their cloud suites while specialist vendors differentiate through AI-powered predictive asset maintenance and industry-specific vertical solutions.

Company Est. Revenue Share Range Key Offerings for the Enterprise Asset Management Market Strategic Positioning
IBM ~10–14% Maximo Application Suite, Maximo Predict AI-first EAM with Watson integration
SAP ~9–13% Intelligent Asset Management, S/4HANA ERP-integrated enterprise asset management leader
Oracle ~7–10% Fusion Cloud EAM, IoT Asset Monitoring Cloud-native platform with strong financial suite integration
Infor ~5–8% EAM (CloudSuite) Industry-specific configurations for heavy industry
IFS ~4–7% IFS Cloud Asset Management Service-centric EAM for aerospace and defense
Hexagon AB ~3–5% HxGN EAM Geospatial-integrated asset management
ABB ~3–5% ABB Ability EAM OT-native EAM for industrial automation
Aptean ~2–4% Aptean EAM Mid-market focused with rapid deployment
Ultimo ~1–3% Ultimo EAM European SME specialist
Trimble ~1–3% Trimble Unity Construction and infrastructure asset lifecycle management


Recent News & Developments


Report Scope

Parameter Detail
Market Scope Global Enterprise Asset Management Market — software platforms and associated services
Study Period 2021–2035
CAGR 11.08% (2026–2035)
Base Year Market Size USD 7.17 Billion (2025)
Forecast Year Market Size USD 19.42 Billion (2035)
Fastest Growing Segments Services (by type), Cloud (by deployment), Healthcare (by end-user industry), Asia-Pacific (by region)
Companies Profiled IBM, SAP, Oracle, Infor, IFS, Hexagon AB, ABB, Aptean, Ultimo, Trimble
Valuation Currency USD Billion


FAQs

How long does a typical Enterprise Asset Management Market platform implementation take for a mid-sized manufacturer?

A mid-sized manufacturer should expect 9–18 months from contract signing to full go-live, depending on integration complexity with existing ERP and OT systems. Cloud deployments typically compress timelines by 30–40% compared to on-premise installations.

What ROI benchmarks should procurement teams use when evaluating Enterprise Asset Management Market solutions?

Industry benchmarks show a 15–25% reduction in unplanned downtime and a 10–18% decrease in maintenance labor costs within the first two years of deployment. Payback periods for cloud-based EAM typically range from 14 to 24 months.

How do AI-powered predictive asset maintenance capabilities differ between tier-one EAM vendors?

IBM Maximo emphasizes pre-built failure-prediction models trained on industry datasets, while SAP leverages its ERP data lake for cross-functional analytics [3]. Oracle differentiates through digital-twin visualization paired with IoT-connected asset tracking systems.

What cybersecurity frameworks should organizations apply to their Enterprise Asset Management Market deployments?

NIST SP 800-82 (Guide to ICS Security) and IEC 62443 provide the most relevant frameworks for EAM environments that bridge IT and operational technology networks [16]. Zero-trust architectures are increasingly required for cloud-connected asset management systems.

How does the Enterprise Asset Management Market address sustainability reporting under CSRD and ISSB frameworks?

Modern EAM platforms capture asset-level energy consumption, emissions factors, and maintenance-related waste data that feed directly into CSRD-compliant sustainability reports [4]. This granularity eliminates manual data collection across distributed facilities.

What integration challenges arise when connecting IoT-connected asset tracking systems with legacy EAM platforms?

Legacy systems often lack RESTful APIs, requiring middleware layers or edge-computing gateways to translate OPC-UA and MQTT sensor protocols into EAM-compatible data formats [16]. Protocol standardization efforts under ISA-95 are reducing but not eliminating these gaps.

How are outcome-based contracting models reshaping vendor strategies in the Enterprise Asset Management Market?

OEMs offering uptime guarantees require real-time asset performance optimization with analytics to manage contractual risk, driving them to bundle EAM platforms into service agreements. This trend shifts revenue recognition from one-time licenses to recurring performance fees.


Author
Author
Author Profile
Aarti Dhapte LinkedIn
AVP - Research
A consulting professional focused on helping businesses navigate complex markets through structured research and strategic insights. I partner with clients to solve high-impact business problems across market entry strategy, competitive intelligence, and opportunity assessment. Over the course of my experience, I have led and contributed to 100+ market research and consulting engagements, delivering insights across multiple industries and geographies, and supporting strategic decisions linked to $500M+ market opportunities. My core expertise lies in building robust market sizing, forecasting, and commercial models (top-down and bottom-up), alongside deep-dive competitive and industry analysis. I have played a key role in shaping go-to-market strategies, investment cases, and growth roadmaps, enabling clients to make confident, data-backed decisions in dynamic markets.

Research Approach


Secondary Research

The secondary research process involved comprehensive analysis of regulatory databases, industry publications, technology journals, enterprise software reports, and authoritative IT organizations. Key sources included the U.S. Department of Commerce (Bureau of Industry and Security), European Commission (Digital Economy and Society Index), International Data Corporation (IDC), Gartner Inc. (Magic Quadrant for Enterprise Asset Management), Forrester Research (Enterprise Asset Management Wave Reports), International Organization for Standardization (ISO) (ISO 55000 Asset Management Standards), Institute of Asset Management (IAM), Association for Computing Machinery (ACM), IEEE Computer Society, U.S. Bureau of Labor Statistics (Occupational Employment and Technology Adoption), OECD Digital Economy Outlook, World Bank Open Data (Digital Infrastructure Indicators), Eurostat (ICT Sector Statistics), National Institute of Standards and Technology (NIST) (Cybersecurity Framework), International Energy Agency (IEA) (Digitalization and Energy Reports), U.S. General Services Administration (Federal Asset Management Policies), and national digital transformation agencies from key markets.

Software adoption statistics, regulatory compliance data, cloud migration trends, IoT integration studies, and market landscape analysis for on-premises, cloud-based, and hybrid deployment models across physical assets, IT assets, infrastructure assets, and human assets were gathered using these sources.


Primary Research

Qualitative and quantitative insights were obtained by interviewing supply-side and demand-side stakeholders during the primary research process. CEOs, VPs of Product Development, Chief Technology Officers (CTOs), and Heads of Cloud Strategy from EAM software vendors, system integrators, and technology OEMs comprised supply-side sources. The demand-side sources included Chief Information Officers (CIOs), VP of Operations, Directors of Maintenance and Reliability, IT Infrastructure Managers, and Procurement Leads from manufacturing enterprises, healthcare systems, transportation and logistics companies, energy and utilities providers, and government agencies.

The primary research validated market segmentation across deployment types (on-premises, cloud-based, hybrid), confirmed product roadmap timelines for AI and IoT integration, and gathered insights on digital transformation adoption patterns, pricing models (subscription vs. perpetual licensing), and total cost of ownership dynamics.

Primary Respondent Breakdown:

By Designation: C-level Primaries (28%), Director Level (35%), Others (37%)

By Region: North America (32%), Europe (29%), Asia-Pacific (34%), Rest of World (5%)


Market Size Estimation

Revenue mapping and enterprise software license analysis were implemented to determine global market valuation. The methodology comprised the following:

IBM, SAP, Oracle, Infor, Siemens, ABB, Hexagon, Schneider Electric, and emerging cloud-native players are among the 50+ main technology vendors identified in North America, Europe, Asia-Pacific, and Latin America.

Product mapping across hybrid deployment architectures, cloud-native SaaS platforms, and on-premises EAM suites

Analysis of segmentation for physical assets (fleet, manufacturing equipment), IT assets (hardware, software licenses), infrastructure assets (buildings, utilities), and human assets (workforce administration)

Asset monitoring, predictive maintenance, inventory management, and work order management modules comprise the functional coverage.

Examination of annual revenues that are specific to professional services and EAM software portfolios, as reported and modeled

In 2024, the coverage of vendors is expected to account for 72-78% of the global market share.

Derive segment-specific valuations across the manufacturing, healthcare, transportation/logistics, energy/utilities, and government sectors through extrapolation using bottom-up (enterprise license volume × ASP by deployment type and end-user industry) and top-down (vendor revenue validation and cloud subscription metrics) approaches.

Download Free Sample

Kindly complete the form below to receive a free sample of this Report