Enterprise Mobility Management Market (2025 - 2035)

Enterprise Mobility Management Market Size, Share and Research Report: By Solution Type (Mobile Device Management, Mobile Application Management, Mobile Content Management, Mobile Security Management), By Deployment Mode (Cloud-Based, On-Premises), By Enterprise Size (Small Enterprises, Medium Enterprises, Large Enterprises), By Industry Vertical (Healthcare, Retail, Government, IT and Telecommunications, Financial Services) and By Regional (North America, Europe, South America, Asia Pacific, Middle East and Africa) - Industry Forecast to 2035
ID: MRFR/ICT/14681-HCR
200 Pages
Kiran Jinkalwad, Aarti Dhapte
Last Updated: June 23, 2026
Enterprise Mobility Management Market
Market Size
Forecast Period2025-2035
CAGR (2025-2035)16.95%
2025 Market SizeUSD 36.20 Billion
2035 Market SizeUSD 173.20 Billion
Key Players
Microsoft
Broadcom
IBM
BlackBerry
Ivanti
Citrix
Opportunities
  • AI-Native Autonomous Endpoint Governance
  • Managed Mobility Services for SMEs in Emerging Markets
  • IoT and OT Endpoint Expansion

Enterprise Mobility Management Market Summary

The Enterprise Mobility Management Market reached a valuation of USD 36.20 Billion in the 2025 base year and is projected to grow from USD 42.34 Billion in 2026 to USD 173.20 Billion by 2035, registering a 16.95% CAGR across the 2026–2035 forecast window. Two catalysts have pulled spending forward: the Biden-era Executive Order 14028 on Improving the Nation's Cybersecurity — which mandated zero-trust architectures across all federal civilian agencies by 2024 [1] — and Europe's NIS2 Directive, which extended breach-notification and endpoint-hardening obligations to more than 160,000 entities starting October 2024 [2]. Both mandates converted what was once discretionary IT expenditure into a regulatory compliance line item.

Technology transformation within the Enterprise Mobility Management Market centers on replacing fragmented point tools — standalone MDM agents, siloed MAM wrappers, legacy VPN concentrators — with converging platforms that unify device, application, identity, and content policy under a single console. estimates that by 2027, over 70% of organizations will consolidate endpoint tools into a single vendor suite, up from fewer than 40% in 2023 [3]. That consolidation wave has already attracted more than USD 8 Billion in disclosed venture and private-equity funding during 2023–2025 alone [4].

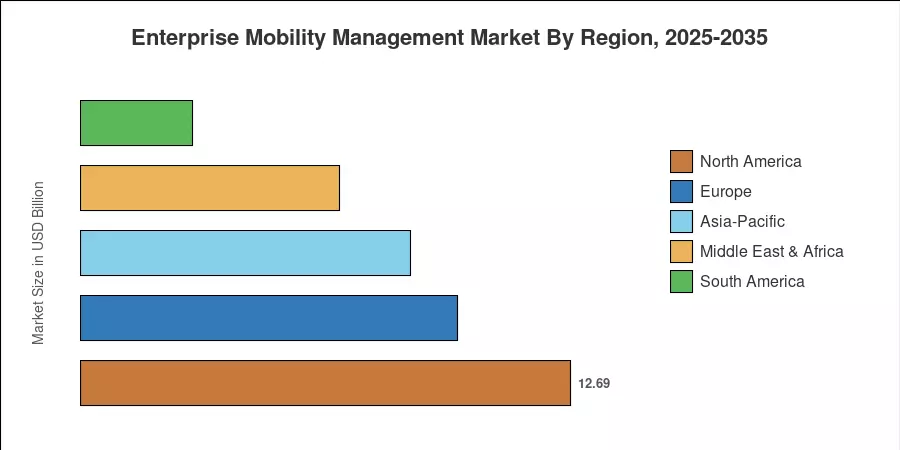
North America commands roughly 35.05% of global revenue, anchored by stringent HIPAA, CMMC, and SEC breach-disclosure rules that keep enterprise budgets elevated. Asia-Pacific is the fastest-expanding geography at a 23.60% CAGR, propelled by India's Digital India programme and Southeast Asia's mobile-first banking expansion. Europe holds the second-largest share at approximately 27%, driven by GDPR enforcement fines that reached a cumulative EUR 4.5 Billion through 2024 [5]. As generative AI integrates deeper into policy engines and threat detection, the Enterprise Mobility Management Market is positioned for sustained double-digit expansion well into the next decade.

Key Report Takeaways

• By Type

  • Solutions accounted for 65.50% of the Enterprise Mobility Management Market revenue in 2025, reflecting enterprises' preference for integrated platform licenses over professional services.
  • Cloud-based deployment is expanding at a 17.45% CAGR through 2035, as organizations migrate on-premise MDM servers to SaaS architectures that reduce infrastructure overhead.

• By Deployment

  • Hybrid deployment models captured USD 4.18 Billion in 2025, favored by regulated industries that must keep certain workloads on-premise.
  • Cloud-based deployment is expanding at a 17.45% CAGR through 2035, as organizations migrate on-premise MDM servers to SaaS architectures that reduce infrastructure overhead.


• By Organization Size

  • Large enterprises contributed 63.20% of 2025 revenues in the Enterprise Mobility Management Market, driven by complex multi-OS estates spanning iOS, Android, Windows, and ChromeOS.
  • SMEs are growing at a 19.35% CAGR as vendors introduce per-device subscription pricing that lowers the adoption barrier.


• By End-User Industry

  • Healthcare and Life Sciences is the fastest-growing end-user vertical at a 21.50% CAGR, spurred by HIPAA MFA mandates and remote-patient-monitoring device proliferation.
  • IT and Telecom lead the Enterprise Mobility Management Market by revenue share because carriers and managed-service providers both consume and resell EMM capabilities.

• By Region

  • North America held 35.05% of the Enterprise Mobility Management Market in 2025, supported by early adoption of CMMC 2.0 across the defense industrial base.
  • Asia-Pacific is forecast to register a 23.60% CAGR through 2035, led by mobile-banking rollouts across India, Indonesia, and Vietnam.


Market Size and Forecast (2021–2035)

Market Research Future's sizing model blends bottom-up revenue triangulation from vendor filings and channel surveys with top-down macroeconomic indicators, including IT spending as a percentage of GDP, smartphone penetration rates, and regulatory compliance spend indices. Historical values (2021–2024) are derived from audited financial disclosures and cross-referenced against independent channel data. Forecast values (2026–2035) apply a constant compound growth assumption calibrated to observed demand accelerants and policy timelines.
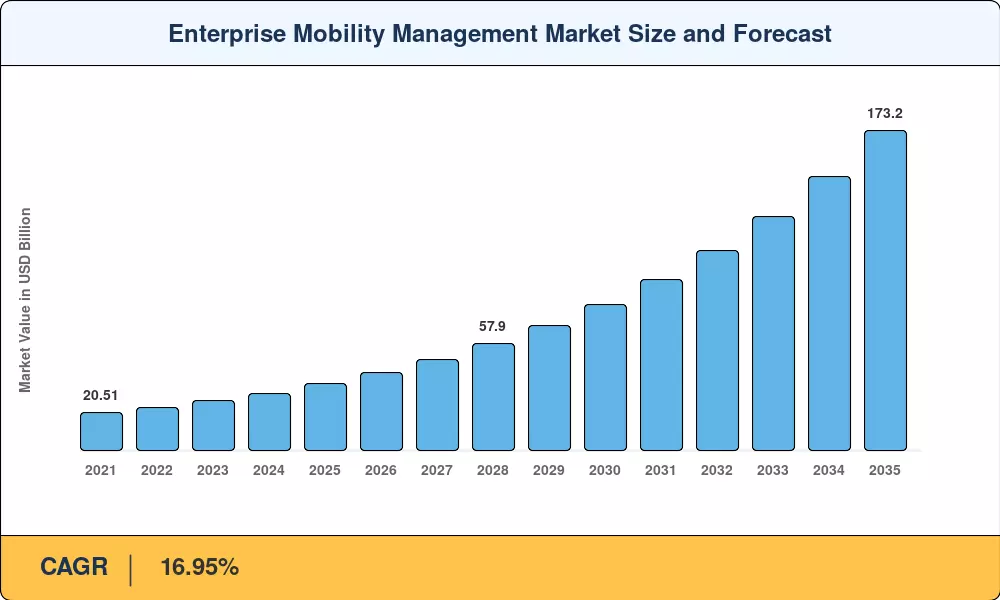
Enterprise Mobility Management Market Size and Forecast
Our Impact
Enabled $4.3B Revenue Impact for Fortune 500 and Leading Multinationals
Partnering with 2000+ Global Organizations Each Year
30K+ Citations by Top-Tier Firms in the Industry

Driver Impact Analysis

Driver ~% Impact on CAGR Geographic Relevance Impact Timeline
Zero-trust security mandates +3.0 North America, Europe Short-term (≤2 yr)
Cloud migration and SaaS consolidation +2.8 Global Medium-term (2–4 yr)
AI/ML-powered threat detection and policy automation +2.5 North America, Asia-Pacific Medium-term (2–4 yr)
5G and edge-compute endpoint architectures +1.8 Asia-Pacific, Europe Long-term (≥4 yr)
BYOD and hybrid-work normalization +1.5 Global Short-term (≤2 yr)
IoT/OT convergence expanding managed-device scope +1.2 North America, Europe Long-term (≥4 yr)
Regulatory breach-notification tightening +1.0 Europe, North America Short-term (≤2 yr)


Zero-Trust Security Mandates

CISA's Zero Trust Maturity Model, updated in April 2023, requires all U.S. civilian agencies to achieve "advanced" maturity across identity, device, network, application, and data pillars by fiscal year 2025 [1]. That directive created a procurement cascade: prime contractors now must demonstrate compliant endpoint postures to retain federal contracts, pushing EMM adoption beyond agency IT teams and into the broader defense-industrial base. The FedRAMP High authorization backlog — over 180 applications in queue as of mid-2024 — signals that vendor investment in compliance tooling remains elevated [12].

Cloud Migration and SaaS Consolidation

estimates that global public-cloud spending will exceed USD 1.35 trillion by 2027 [13]. Within the Enterprise Mobility Management Market, that shift is collapsing three- and four-vendor endpoint stacks into single-console platforms, trimming operational costs by an estimated 25–30% while improving mean-time-to-remediation metrics. Microsoft's Intune suite alone added more than 80 million seats between 2022 and 2024, illustrating how bundling EMM into broader productivity licenses accelerates the displacement of standalone tools [14].

AI/ML-Powered Policy Automation

Without the need for human participation, generative-AI copilots integrated into EMM consoles may now automatically write compliance policies, identify configuration drift, and pre-approve low-risk application requests. estimates that 60% of tier-1 endpoint problems will be handled independently by AI-augmented security operations by 2028 [9]. In verticals governed by GDPR and HIPAA, vendors who supply on-device inference—keeping personally identifiable information off the network—gain a quantifiable privacy benefit.

5G and Edge-Compute Architectures

By 2030, 5.3 billion 5G connections are expected, according to GSMA Intelligence [10]. Low-latency connectivity changes endpoint management from polling-based check-ins to continuous, event-driven telemetry for the enterprise mobility management market. Early adopters include field-service and logistics companies. Real-time device posture evaluation at the network edge shortens incident reaction windows from hours to seconds, hence reducing breach-containment costs, which IBM's 2024 research estimated to be an average of USD 4.88 million per occurrence [15].

Restraints Impact Analysis

Restraint impact percentages represent estimated dampening effects on market growth and are directional rather than exact deductions from CAGR.

Restraint ~% Impact on CAGR Geographic Relevance Impact Timeline
Data-sovereignty and cross-border compliance fragmentation –1.5 Europe, Asia-Pacific Medium-term (2–4 yr)
Integration complexity across legacy OS estates –1.2 Global Short-term (≤2 yr)
Skilled cybersecurity talent shortage –1.0 Global Long-term (≥4 yr)
High total cost of ownership for SMEs –0.8 South America, MEA Short-term (≤2 yr)
Privacy backlash and employee-surveillance concerns –0.5 Europe, North America Medium-term (2–4 yr)


Data-Sovereignty and Cross-Border Compliance Fragmentation

More than 140 countries now enforce some form of data-localization requirement [16]. For multinational firms, running a single EMM tenant across jurisdictions triggers conflicting obligations — India's DPDP Act, China's PIPL, and the EU's GDPR each impose distinct consent, storage, and transfer rules. Vendors must architect multi-region data residency, which raises infrastructure costs and slows feature rollouts outside tier-1 markets.

Integration Complexity Across Legacy Estates

According to [20], large businesses often oversee 3.8 endpoint operating systems at once. Extensive API development is required to bind modern iOS and ChromeOS fleets, legacy Android forks in logistics, and proprietary Windows CE devices in manufacturing into a single policy framework. In the industrial sector, deployment schedules longer than nine months are typical, which suppresses near-term renewal rates in the enterprise mobility management market and delays time-to-value.

Cybersecurity Talent Shortage

According to ISC2's 2024 Cybersecurity Workforce Study, there is a 4.8 million security professional shortage worldwide [17]. Despite their abundance of features, EMM platforms still need knowledgeable administrators to set up conditional-access restrictions, look into anomalies, and keep patch schedules. In South America and the Middle East, where average salaries for skilled mobility-security engineers have increased by more than 20% annually, the talent gap is particularly severe, limiting deployment capacity.

Enterprise Mobility Management Market Opportunities

AI-Native Autonomous Endpoint Governance

Vendors that embed large-language-model reasoning directly into their consoles — enabling natural-language policy creation, automated compliance auditing, and predictive vulnerability scoring — can capture a premium positioning tier. Early movers are already reporting 40% reductions in policy-creation time [9]. This opportunity extends the Enterprise Mobility Management Market beyond security teams and into line-of-business buying centers.

Managed Mobility Services for SMEs in Emerging Markets

Sub-Saharan Africa and Southeast Asia host more than 1.2 Billion mobile internet subscribers, yet have single-digit EMM penetration [21]. Managed-service providers packaging device procurement, configuration, and ongoing policy management into a per-user monthly fee can unlock this greenfield demand. India's Unified Payments Interface (UPI) ecosystem — processing over 13 Billion transactions per month — requires robust device-level security that most small fintech firms lack in-house.

IoT and OT Endpoint Expansion

As connected industrial sensors, rugged handhelds, and wearable devices flood enterprise networks, the addressable device count per organization is expected to triple by 2030 [11]. EMM vendors that extend their agents to cover IoT and OT endpoints — not just smartphones and laptops — tap into a rapidly expanding total addressable market.

Compliance-as-a-Service and Data-Monetization Models

Aggregated, anonymized telemetry from millions of managed endpoints holds significant value for cyber insurance underwriting, workforce-productivity benchmarking, and network-planning analytics. Vendors offering compliance-as-a-service dashboards that map device posture directly to regulatory frameworks (HIPAA, PCI-DSS, SOC 2) can create recurring revenue streams independent of seat-license growth.

Sovereign-Cloud EMM Platforms

Government agencies in the Gulf Cooperation Council, ASEAN, and the European Union increasingly require cloud services to operate on nationally domiciled infrastructure [16]. Building EMM stacks purpose-built for sovereign clouds — with local key management, resident data processing, and in-country support — positions vendors to win large public-sector contracts that generalist SaaS platforms cannot serve.

Enterprise Mobility Management Market Future Outlook

AI-Autonomous Security Operations

By 2030, anticipates that 75% of tier-1 security incidents will be resolved without human intervention [9]. Within the Enterprise Mobility Management Market, that translates to consoles capable of detecting anomalous device behavior, quarantining compromised endpoints, and rolling back unauthorized configurations autonomously. Vendors that ship on-device inference models — keeping sensitive telemetry local — will differentiate on both speed and privacy compliance.

Platform Economics and Super-Bundling

The consolidation trajectory points toward "super-suites" where EMM, ITSM, identity governance, and vulnerability management coexist in a single license SKU. Microsoft, Google, and Broadcom are already moving in this direction [14]. Smaller pure-play vendors face margin pressure unless they carve niches in verticals (healthcare, manufacturing) or geographies (sovereign-cloud mandates) where bundled suites lack depth.

Sustainability and ESG Reporting for Device Fleets

ESG responsibilities are being extended to IT asset lifecycles via corporate sustainability reporting standards, such as the EU's CSRD, which went into force in January 2025 [22]. A burgeoning CISO-meets-CSO buying coalition will be accessed by EMM platforms that monitor device energy use, automate power-management strategies, and produce carbon-footprint reports for managed fleets.


Quantum-Resilient Endpoint Communication

In August 2024, NIST completed the first three post-quantum cryptography standards [23]. By 2028, it is anticipated that defense primes and financial institutions will start testing quantum-safe TLS on managed endpoints. Vendors in the Enterprise Mobility Management Market will guarantee long-term positioning in the most security-sensitive sectors if they incorporate post-quantum key encapsulation into their device-to-cloud tunnels early on.


Enterprise Mobility Management Market Segmentation

By Type

Segment Key Metric Primary Demand Driver
Solutions 65.50% revenue share (2025) Platform license bundling with cloud suites
Services 18.80% CAGR (2026–2035) Managed mobility services for mid-market firms


Solutions remain the revenue backbone of the Enterprise Mobility Management Market, as enterprises increasingly prefer perpetual or subscription platform licenses that include MDM, MAM, MCM, and MIM modules in a single SKU. The services segment, though smaller, is growing faster — driven by managed-service providers offering turnkey deployment, 24/7 monitoring, and policy-tuning engagements that appeal to organizations lacking in-house mobility-security expertise.

Within solutions, the security management subsegment is advancing at an 18.60% CAGR, reflecting heightened demand for mobile-threat-defense, conditional-access, and certificate-management capabilities that sit atop baseline device enrollment. Content management and application management round out the solution stack, each seeing renewed investment as remote-work data-sharing volumes climb.

By Deployment Mode

Segment Key Metric Primary Demand Driver
Cloud-Based 17.45% CAGR (2026–2035) SaaS migration, lower infrastructure burden
On-Premise 26.80% revenue share (2025) Regulated industries requiring local data residency
Hybrid USD 4.18 Billion (2025) Transitional architectures in banking, defense


Cloud-based deployment is the default choice for net-new Enterprise Mobility Management Market implementations, offering rapid provisioning, automatic updates, and elastic scalability. On-premise installations persist in defense, government, and certain healthcare environments where data-sovereignty rules prohibit cloud tenancy. Hybrid models bridge the two, routing sensitive workloads through on-premise appliances while offloading general device management to the cloud.

By Organization Size

Segment Key Metric Primary Demand Driver
Large Enterprises 63.20% revenue share (2025) Complex multi-OS, multi-geography device estates
Small and Medium-Sized Enterprises 19.35% CAGR (2026–2035) Per-device subscription pricing, MSP adoption


Large enterprises dominate current spending within the Enterprise Mobility Management Market because their device estates commonly exceed 50,000 endpoints spanning four or more operating systems. SMEs, by contrast, are the growth engine: vendor packaging innovations — such as per-user pricing starting below USD 5 per device per month — have collapsed the adoption barrier for companies with as few as 50 endpoints.

By End-User Industry

Segment Key Metric Primary Demand Driver
IT and Telecom 29.20% revenue share (2025) Internal dogfooding, managed-service reselling
BFSI USD 5.48 Billion (2025) PCI-DSS mobile compliance, open-banking APIs
Healthcare and Life Sciences 21.50% CAGR (2026–2035) HIPAA MFA mandates, remote patient monitoring
Manufacturing and Industrial 16.40% CAGR (2026–2035) Rugged-device enrollment, OT convergence
Retail and E-Commerce USD 2.75 Billion (2025) Mobile POS, in-store associate device programs
Others 14.90% CAGR (2026–2035) Education, government, transportation


IT and Telecom lead the Enterprise Mobility Management Market by revenue share because carriers and managed-service providers both consume and resell EMM capabilities. BFSI follows closely, driven by PCI-DSS audit cycles that now explicitly assess mobile-device posture. Healthcare is the standout growth vertical: the 21st Century Cures Act and HIPAA's 2024 NPRM requiring phishing-resistant MFA on all endpoints handling ePHI are forcing health systems to adopt enterprise-grade mobility governance at an accelerated pace [24].


Regional Market Share Analysis

Region Key Metric Primary Investment Themes
North America 35.05% revenue share (2025) Zero-trust compliance, CMMC 2.0, FedRAMP
Europe USD 9.77 Billion (2025) GDPR enforcement, NIS2 mandates, sovereign cloud
Asia-Pacific 23.60% CAGR (2026–2035) Mobile-first banking, Digital India, 5G rollouts
South America USD 2.90 Billion (2025) LGPD compliance, fintech device security
Middle East & Africa 18.50% CAGR (2026–2035) Smart-city programs, oil-and-gas OT endpoints
Total USD 36.20 Billion (2025)  

The Enterprise Mobility Management Market exhibits clear geographic stratification: mature markets in North America and Europe spend on platform consolidation and compliance tooling, while high-growth corridors in Asia-Pacific prioritize first-time deployments tied to digital-transformation programs.


North America

Country Key Metric Key Driver
United States 78.5% of regional revenue Federal zero-trust mandates, large enterprise density
Canada 12.80% CAGR PIPEDA modernization, hybrid-work policies
Mexico USD 0.72 Billion (2025) Nearshoring-driven IT investment uptick


The United States remains the single largest national market for the Enterprise Mobility Management Market, with federal civilian and defense agencies acting as anchor buyers. Canada's updated Privacy Act proposals are pushing mid-market firms to formalize endpoint governance for the first time, while Mexico benefits from manufacturing nearshoring that demands shop-floor mobile-device control.

Europe

Country Key Metric Key Driver
Germany 22.3% of regional revenue Industrie 4.0 and automotive OT endpoint growth
United Kingdom 18.90% CAGR Post-Brexit data adequacy compliance requirements
France USD 1.38 Billion (2025) Sovereign-cloud mandates under SecNumCloud
Italy 16.20% CAGR Banking-sector digital transformation
Spain USD 0.62 Billion (2025) Tourism-sector mobile POS device expansion
Nordic Countries 17.80% CAGR Public-sector digitalization programs
Russia USD 0.41 Billion (2025) Domestic vendor substitution policies
Rest of Europe 15.90% CAGR EU-wide NIS2 compliance rollout


Europe's Enterprise Mobility Management Market growth is anchored by GDPR enforcement — supervisory authorities issued fines exceeding EUR 2.1 Billion in 2024 alone [5]. Germany's manufacturing sector is driving OT-endpoint enrollment, while France's ANSSI-certified SecNumCloud standard is creating demand for locally hosted EMM instances.

Asia-Pacific

Country Key Metric Key Driver
China 28.4% of regional revenue PIPL enforcement, state-enterprise mobile fleets
India 25.70% CAGR Digital India, UPI fintech expansion
Japan USD 1.52 Billion (2025) Legacy fleet modernization, Society 5.0
South Korea 21.30% CAGR 5G-connected device ecosystems
ASEAN USD 0.91 Billion (2025) Mobile-first banking across Indonesia, Vietnam
Rest of Asia-Pacific 19.80% CAGR Government digitization in emerging economies


Asia-Pacific represents the highest-growth corridor in the Enterprise Mobility Management Market, fueled by more than 3.5 Billion mobile internet users across the region [21]. India's expected addition of 500 million smartphone users by 2030 will dramatically expand the managed-device base, and ASEAN's open-banking regulations are compelling financial institutions to adopt mobile-threat-defense layers alongside traditional EMM.

South America

Country Key Metric Key Driver
Brazil 62.1% of regional revenue LGPD enforcement, digital-banking licenses
Argentina 17.40% CAGR SME cloud-migration incentives
Rest of South America USD 0.44 Billion (2025) Mining and agriculture field-device management


Brazil dominates the South American landscape thanks to its LGPD data-protection law, which has prompted banks and healthcare providers to invest in unified endpoint management for mobile devices across distributed branch networks. Argentina's Secretaría de Innovación cloud-first directive is accelerating SME adoption.

Middle East & Africa

Country Key Metric Key Driver
Saudi Arabia 31.7% of regional revenue Vision 2030 smart-city and NEOM projects
UAE 20.50% CAGR Dubai International Financial Centre compliance
South Africa USD 0.34 Billion (2025) POPIA enforcement, mining-sector OT security
Egypt 19.10% CAGR Fintech licensing expansion
Rest of MEA USD 0.48 Billion (2025) Oil-and-gas field-device hardening


The Middle East & Africa region is propelled by ambitious national digitization blueprints. Saudi Arabia's Vision 2030 megaprojects demand endpoint governance at scale — NEOM alone will embed millions of connected sensors requiring centralized management. South Africa's POPIA enforcement is the primary compliance driver on the continent.


Enterprise Mobility Management Market By Region, 2025-2035

Competitive Benchmarking

The Enterprise Mobility Management Market exhibits medium concentration, with the top five vendors holding an estimated 48–55% combined revenue share and a Herfindahl-Hirschman Index in the 800–1,100 range. Microsoft's Intune ecosystem anchors the market through deep integration with Azure AD and the Microsoft 365 productivity suite. Below the top tier, a long tail of specialist vendors — focused on rugged devices, Apple-only fleets, or regional sovereign clouds — sustains competitive dynamism and prevents the market from tipping into oligopoly.

Company Est. Revenue Share Range Key Offerings Strategic Positioning
Microsoft ~16–20% Intune, Endpoint Manager, Defender for Endpoint Bundled super-suite across the M365 ecosystem
Broadcom (VMware) ~10–14% Workspace ONE, Freestyle Orchestrator Multi-OS neutrality, advanced workflow automation
IBM ~6–9% MaaS360 with Watson AI-driven threat insights, mainframe heritage clients
BlackBerry ~5–8% UEM (CylancePROTECT integration) Government-grade security certifications
Ivanti ~4–7% Neurons for MDM, Patch for MobileIron Legacy MobileIron base, patch-management depth
Citrix (Cloud Software Group) ~4–6% Endpoint Management, Secure Private Access Virtual-desktop convergence, Citrix DaaS synergy
SOTI ~3–5% SOTI MobiControl, SOTI XSight Rugged-device and IoT specialization
Jamf ~3–5% Jamf Pro, Jamf Protect, Jamf Connect Apple-ecosystem exclusivity
Samsung (Knox) ~2–4% Knox Suite, Knox E-FOTA OEM-level firmware control on Samsung devices
ManageEngine (Zoho) ~2–4% Mobile Device Manager Plus, Endpoint Central Cost-competitive, strong in the APAC SME segment

Recent News & Developments

  • Microsoft (November 2024): Launched Intune Suite advanced add-ons, including Endpoint Privilege Management and Cloud PKI, expanding conditional-access granularity for hybrid-device estates [14].
  • Broadcom (September 2024): Completed the integration of VMware's Workspace ONE into the Broadcom Software portfolio, consolidating pricing under a per-endpoint subscription model that targets mid-market expansion [25].
  • IBM (July 2024): Announced MaaS360 integration with watsonx.ai, embedding generative-AI policy recommendations directly into the admin console for faster compliance remediation [9].
  • CISA (April 2023): Released the updated Zero Trust Maturity Model v2.0, accelerating federal procurement of EMM platforms capable of continuous device-posture assessment [1].
  • European Commission (October 2024): Enforced the NIS2 Directive, extending mandatory endpoint-security and incident-reporting requirements across critical infrastructure operators and their supply chains [2].
  • Samsung (January 2025): Unveiled Knox Matrix cross-device trust architecture at CES 2025, enabling credential sharing and synchronized security policies across Galaxy smartphones, tablets, and IoT devices [27].
  • SOTI (June 2024): Released MobiControl 2024.1 with native Linux endpoint support, addressing growing demand from manufacturing and logistics firms deploying Linux-based rugged terminals [28].

Enterprise Mobility Management Market Report Scope

Parameter Detail
Market Scope Enterprise Mobility Management Market — Solutions, Services, Deployment Modes, Organization Sizes, End-User Industries, and Geography
Study Period 2021–2035
CAGR (2026–2035) 16.95%
Market Size (2025 — Base Year) USD 36.20 Billion
Market Size (2035 — Forecast Endpoint) USD 173.20 Billion
Fastest Growing Segment Healthcare and Life Sciences (by end-user); SMEs (by organization size); Asia-Pacific (by geography)
Companies Profiled Microsoft, Broadcom (VMware), IBM, BlackBerry, Ivanti, Citrix, SOTI, Jamf, Samsung, ManageEngine
Valuation Currency USD Billion


FAQs

How does enterprise mobility management differ from mobile device management?
EMM extends beyond basic MDM enrollment by integrating application management, content management, and identity governance into a unified policy framework. MDM alone handles device-level controls but lacks application-layer visibility [3].
What is the typical deployment timeline for a mid-sized EMM rollout?
Most mid-market deployments are complete within 8–14 weeks, including policy design, pilot testing, and phased user onboarding. Complex multi-OS environments may extend to 20 weeks [20].
Which compliance framework most influences EMM purchasing decisions?
HIPAA drives the strongest mandate-driven purchases because its proposed 2024 rule explicitly requires phishing-resistant MFA and encryption on every endpoint handling patient data [24].
Can EMM platforms manage IoT and rugged industrial endpoints?
Several vendors — including SOTI and Ivanti — now support Linux-based rugged terminals, barcode scanners, and IoT gateways alongside traditional smartphones and laptops [28].
How are vendors addressing employee privacy concerns with EMM?
Leading platforms offer work-profile containerization that separates corporate data from personal apps, ensuring IT cannot access personal photos, messages, or browsing history [19].
What role does AI play in next-generation EMM consoles?
AI automates policy drafting, detects behavioral anomalies, and resolves tier-1 incidents without human intervention, reducing administrative workload by an estimated 40% [9].
Is on-premise EMM deployment still viable for regulated organizations?
On-premise installations remain relevant for defense and intelligence agencies where data-sovereignty rules prohibit any cloud tenancy, though hybrid models are increasingly preferred [16].    
Author
Author
Author Profile
Kiran Jinkalwad LinkedIn
Research Associate Level - II
Kiran Jinkalwad brings over four years of experience in market research, specializing in the ICT and Semiconductor sectors. She has worked on 50+ projects, including custom studies for companies like Microsoft and Huawei, addressing complex business challenges. With a background in Electronics and Telecommunication, Kiran excels in market estimation, forecasting, and strategic analysis. His sharp analytical skills and industry knowledge consistently deliver actionable insights for diverse clients.
Co-Author
Co-Author Profile
Aarti Dhapte LinkedIn
AVP - Research
A consulting professional focused on helping businesses navigate complex markets through structured research and strategic insights. I partner with clients to solve high-impact business problems across market entry strategy, competitive intelligence, and opportunity assessment. Over the course of my experience, I have led and contributed to 100+ market research and consulting engagements, delivering insights across multiple industries and geographies, and supporting strategic decisions linked to $500M+ market opportunities. My core expertise lies in building robust market sizing, forecasting, and commercial models (top-down and bottom-up), alongside deep-dive competitive and industry analysis. I have played a key role in shaping go-to-market strategies, investment cases, and growth roadmaps, enabling clients to make confident, data-backed decisions in dynamic markets.

Research Approach


Secondary Research

The secondary research process involved comprehensive analysis of regulatory databases, peer-reviewed technology journals, IT infrastructure publications, and authoritative cybersecurity organizations. Key sources included the National Institute of Standards and Technology (NIST) Cybersecurity Framework, International Organization for Standardization (ISO) 27001/27002 standards, National Cyber Security Centre (NCSC-UK), European Union Agency for Cybersecurity (ENISA), US Department of Commerce Bureau of Industry and Security, Federal Communications Commission (FCC) connectivity reports, International Telecommunication Union (ITU) World Telecommunication/ICT Indicators Database, Organisation for Economic Co-operation and Development (OECD) Digital Economy Outlook, IDC Worldwide Mobility Management Software Tracker, Gartner Magic Quadrant for Unified Endpoint Management, Forrester Wave™ Enterprise Mobility Management reports, Cybersecurity and Infrastructure Security Agency (CISA) Mobile Device Management guidelines, Internet Corporation for Assigned Names and Numbers (ICANN) mobile security advisories, GSMA Intelligence Mobility Market data, and national digital transformation reports from key markets. These sources were used to collect adoption statistics, compliance frameworks, security incident data, BYOD (Bring Your Own Device) penetration rates, and market landscape analysis for Mobile Device Management (MDM), Mobile Application Management (MAM), Mobile Content Management (MCM), and Mobile Security Management technologies.


Primary Research

In order to gather both qualitative and quantitative insights, supply-side and demand-side stakeholders were interviewed during the primary research process. CEOs, CTOs, VPs of Product Development, Chief Information Security Officers (CISOs), and heads of mobile strategy from telecom companies, device makers, and business mobility management software vendors were among the supply-side sources. Chief Information Officers (CIOs), IT infrastructure directors, cybersecurity managers, procurement leads from Fortune 1000 companies, IT administrators in healthcare systems, government agency technology officers, and heads of retail operations technology were among the demand-side sources. Market segmentation, product roadmap timescales, and implementation patterns, licensing arrangements, and cloud migration dynamics were all confirmed by primary research.

Primary Respondent Breakdown:

Table

Copy

Category Segment Percentage

By Company Tier Tier 1 (>$50B revenue) 38%

Tier 2 ($5B-$50B revenue) 31%

By Designation C-level Executives 42%

Director Level 25%

Others (Managers, Specialists, Consultants) 33%

By Region North America 32%

Europe 29%

Asia-Pacific 28%

Rest of World (Middle East & Africa, Latin America) 11%


Market Size Estimation

Global market valuation was derived through revenue mapping and deployment volume analysis. The methodology included:

Identification of 50+ key technology providers across North America, Europe, Asia-Pacific, Middle East & Africa, and Latin America

Product mapping across Mobile Device Management (MDM), Mobile Application Management (MAM), Mobile Content Management (MCM), Mobile Security Management (MSM), and Unified Endpoint Management (UEM) solution categories

Analysis of reported and modeled annual revenues specific to enterprise mobility management portfolios

Coverage of vendors representing 75-80% of global market share in 2024

Extrapolation using bottom-up (licensed device volume × ARPU by country) and top-down (vendor revenue validation) approaches to derive segment-specific valuations across:

Deployment Modes: Cloud-Based and On-Premises

Enterprise Sizes: Small Enterprises, Medium Enterprises, and Large Enterprises

Industry Verticals: Healthcare, Retail, Government, IT & Telecommunications, Financial Services, Manufacturing, and Education

Cross-validation with IT spending data from national statistics offices and enterprise technology budget surveys

Download Free Sample

Kindly complete the form below to receive a free sample of this Report

Download PDF ×

We do not share your information with anyone. However, we may send you emails based on your report interest from time to time. You may contact us at any time to opt-out.

















