• Cat-intel
  • MedIntelliX
  • Resources
  • About Us
  • Hero Background
    English
    Chinese
    French
    Japanese
    Korean
    German
    Spanish

    Industrial Gearbox Service Market Analysis

    ID: MRFR/E&P/7052-CR
    155 Pages
    Chitranshi Jaiswal
    October 2019

    Industrial Gearbox Service Market Research Report Information By Type (Planetary, Helical, Bevel, Spur, Worm and Others), Design (Parallel axis, Angled Axis and Others), Part (Gear, Shaft and Bearings), Industry (Power Generation, Construction, Material Handling, Industrial, Wind Power, Marine and Others) And By Region (North America, Europe, Asia-Pacific, And Rest Of The World) – Market Foreca...

    Share:
    Download PDF ×

    We do not share your information with anyone. However, we may send you emails based on your report interest from time to time. You may contact us at any time to opt-out.

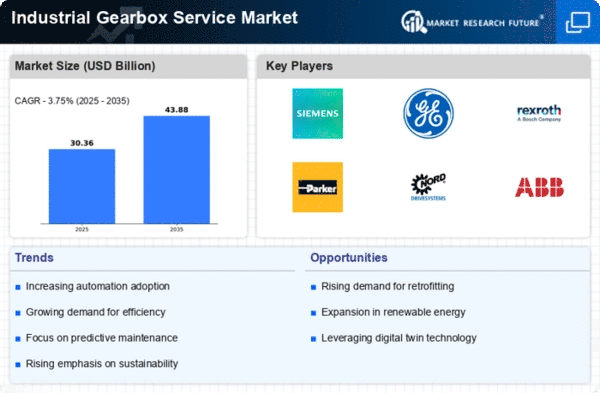
    Industrial Gearbox Service Market Infographic
    Purchase Options

    Market Analysis

    In-depth Analysis of Industrial Gearbox Service Market Industry Landscape

    Over the past few decades, the global population has been steadily increasing and is anticipated to continue growing in the coming years. This surge in population has resulted in a heightened demand for industrial automation on a global scale. The ongoing global trends of digitalization and automation in manufacturing processes have played a pivotal role in fostering market growth. Among the continents, Europe stands at the forefront in terms of automation and technological advancements in manufacturing and robotics. Notably, Germany, a key player in the European economic landscape, has showcased a robust utilization of industrial robots, particularly in the automotive industry. According to the Germany Trade & Invest, which is an economic development agency, the automotive sector in Germany has demonstrated the highest use of industrial robots. In the year 2017, the total turnover in robotics and automation in Germany amounted to a substantial USD 16.35 billion, as reported by the Mechanical Engineering Industry Association. Furthermore, the annual shipments of multipurpose industrial robots have exhibited an upward trajectory in leading European countries. The proliferation of multipurpose robots is poised to trigger significant investments in research and development (R&D), with Germany and Italy anticipated to witness the highest investments during the forecast period. The machinery and equipment companies in Germany, as reported by the Germany Trade & Invest, invested USD 6.30 billion in R&D activities in 2016. These investments are expected to elevate the level of industrial automation in both Germany and the wider European region. Industrial gearboxes play a crucial role in the realm of industrial automation by providing flexibility, reliability, speed, and movement across various applications. These applications encompass lifting systems, conveyors, feeder screws, and machine tools, showcasing the versatility and extensive usage of industrial gearboxes that are anticipated to propel market growth. Moreover, industrial gearboxes are recognized for their maximum torsional stiffness and low operational noise. Ensuring the proper functioning of industrial gearboxes enhances machine efficiency and augments production capacity. These gearboxes play a pivotal role in modifying the speed ratio to the transmitted power, thereby improving operational processes in industrial automation applications. The benefits offered by industrial gearboxes include heightened productivity and efficiency, reduced maintenance costs, and lower power consumption. The demand for industrial gearboxes is experiencing an upswing in robotic applications due to their ability to provide multiple gear ratios along with various other advantageous properties in terms of impedance, force, and speed. The increased adoption of industrial automation in Europe is anticipated to be a driving force behind the global growth of the industrial gearbox market. As automation continues to advance, the demand for efficient and versatile components like industrial gearboxes is expected to rise, shaping the trajectory of the market on a global scale.

    Author
    Chitranshi Jaiswal
    Research Analyst Level I

    In her 3 years of experience in the market research field, she has handled critical cross-domain projects. She has an in-depth knowledge of market estimation & analysis, problem-solving, primary as well as secondary research, and team management.She holds an engineering degree and is an MBA professional from a well-known university, capable of evaluating the market and competitive conditions. An exceptional strategist with excellent communication skills and a passion for delivering cutting-edge & practical insights for the market. Proficient in multi-tasking, and can successfully deal with competing demands, while maintaining complete confidentiality. Generated business through active client and project development, networking, and high-quality responses. Her knowledge and skills have helped in making solid business decisions, securing funding from investors, and avoiding business failures.

    Leave a Comment

    FAQs

    How much is the Industrial Gearbox Service market?

    The Industrial Gearbox Service market size was valued at USD 28.05 Billion in 2023.

    What is the growth rate of the Industrial Gearbox Service market?

    The market is projected to grow at a CAGR of 3.75% during the forecast period, 2024-2032.

    Which region held the largest market share in the Industrial Gearbox Service market?

    North America had the largest share in the market.

    Who are the key players in the Industrial Gearbox Service market?

    The key players in the market are Parsons Peebles LTD (UK), GBS Gearbox Services International (Switzerland), David Brown Santasalo (UK), Greater (US), Triveni Engineering & Industries Ltd. (India).

    Which design led the Industrial Gearbox Service market?

    The Parallel axis dominated the market in 2022.

    Which industry had the largest market share in the Industrial Gearbox Service market?

    The power generation had the largest share in the market.

    Market Summary

    As per Market Research Future Analysis, the Global Industrial Gearbox Service Market was valued at USD 29.26 Billion in 2024 and is projected to grow to USD 43.88 Billion by 2035, with a CAGR of 3.75% from 2025 to 2035. Key drivers include the expansion of the construction industry and increasing industrial automation, particularly in developing countries like India and China. The demand for gearboxes is also rising due to their efficiency in power usage and torque capabilities, especially in renewable energy sectors such as wind and solar power.

    Key Market Trends & Highlights

    The Industrial Gearbox Service market is witnessing significant growth driven by various factors.

    • Market Size in 2024: USD 29.26 Billion. Projected Market Size by 2035: USD 43.88 Billion. CAGR from 2025 to 2035: 3.75%. Planetary gearboxes account for 35% of market revenue due to high power density demand.

    Market Size & Forecast

    2024 Market Size USD 29.26 Billion
    2035 Market Size USD 43.88 Billion
    CAGR (2025-2035) 3.75%
    Largest Regional Market Share in 2024 North America.

    Major Players

    <p>Key players include Schneider Electric, Siemens Energy GmbH &amp; Co KG, Parsons Peebles LTD, GBS Gearbox Services International, and David Brown Santasalo.</p>

    Market Trends

    Expansion of the construction industry is driving the market growth

    Market CAGR for industrial gearbox service is being driven by the expansion of the construction industry. Governments are encouraging the development of infrastructure in every region. To improve their infrastructure and real estate markets, emerging countries are introducing different reforms and laws. These changes are anticipated to accelerate the expansion of the construction industry and propel the industrial gearbox market on a scale. In addition, since the population has expanded over the past few decades, there is a greater need for residential and commercial infrastructure.

    The need for gearboxes increases because they use less power, permit a wide range of torque, and have a high friction coefficient.

    India and China, two nations that have made significant infrastructure development investments, are anticipated to continue leading the way during the projection period. The India Brand Equity Foundation estimates that by 2022, India will need to invest around USD 777.30 billion in infrastructure for sustainable development. Additionally, many businesses in the nation are investing in building infrastructure, which will help the construction industry flourish. For instance, the National Investment & Infrastructure Fund (India) received a USD 200 million investment from the Asian Infrastructure Investment Bank (China) in June 2018. The country's infrastructure was to be developed due to this investment.

    For the wind turbines to operate properly, such factors are predicted to raise the gearbox demand. This will likely present a market opportunity for industrial gearboxes worldwide. Thus, driving the Industrial Gearbox Service market revenue.

    <p>The Global Industrial Gearbox Service Market is poised for growth as industries increasingly prioritize efficiency and reliability in their operations, reflecting a broader trend towards advanced manufacturing practices.</p>

    U.S. Department of Commerce

    Industrial Gearbox Service Market Market Drivers

    Rising Demand for Automation

    The Global Industrial Gearbox Service Market Industry experiences a notable surge in demand for automation across various sectors, including manufacturing and energy. As industries increasingly adopt automated systems to enhance efficiency and productivity, the need for reliable gearboxes becomes paramount. This trend is particularly evident in the manufacturing sector, where automated machinery relies heavily on high-performance gearboxes. The market is projected to reach 29.3 USD Billion in 2024, driven by this growing reliance on automation. Furthermore, the shift towards smart factories and Industry 4.0 initiatives is likely to further bolster the demand for advanced gearbox services.

    Expansion of Renewable Energy Sector

    The Global Industrial Gearbox Service Market Industry is significantly influenced by the expansion of the renewable energy sector. As countries worldwide prioritize sustainable energy sources, the demand for wind and solar power has surged. Wind turbines, which rely on specialized gearboxes for optimal performance, are particularly critical in this transition. The increasing installation of wind farms globally necessitates regular gearbox maintenance and servicing, thereby driving market growth. By 2035, the market is expected to grow to 43.9 USD Billion, reflecting the importance of gearbox services in supporting renewable energy infrastructure.

    Focus on Preventive Maintenance Strategies

    The Global Industrial Gearbox Service Market Industry is increasingly influenced by a focus on preventive maintenance strategies. Industries are recognizing the importance of regular maintenance to prevent unexpected failures and costly downtimes. This proactive approach not only enhances the reliability of machinery but also extends the lifespan of gearboxes. Companies are investing in advanced monitoring technologies to predict maintenance needs accurately. As a result, the demand for gearbox servicing is likely to rise, reflecting a shift towards more sustainable operational practices. This trend aligns with the overall growth expectations for the market in the coming years.

    Technological Advancements in Gearbox Design

    Technological advancements in gearbox design play a crucial role in shaping the Global Industrial Gearbox Service Market Industry. Innovations such as improved materials, enhanced lubrication systems, and advanced manufacturing techniques contribute to the development of more efficient and durable gearboxes. These advancements not only extend the lifespan of gearboxes but also reduce maintenance costs, making them more appealing to industries. As companies seek to optimize their operations, the demand for high-quality gearbox services is likely to increase. The anticipated CAGR of 3.75% from 2025 to 2035 underscores the market's potential growth driven by these technological innovations.

    Increasing Industrialization in Emerging Economies

    The Global Industrial Gearbox Service Market Industry is witnessing growth due to increasing industrialization in emerging economies. Countries such as India and Brazil are experiencing rapid industrial growth, leading to heightened demand for industrial machinery and equipment. This growth necessitates the use of gearboxes in various applications, from manufacturing to transportation. As these economies continue to develop, the need for reliable gearbox services becomes more pronounced. The market's expansion in these regions is expected to contribute significantly to the overall growth trajectory, aligning with the projected figures for the coming years.

    Market Segment Insights

    Industrial Gearbox Service Type Insights

    <p>The Industrial Gearbox Service market segmentation, based on type, includes planetary, helical, bevel, spur, worm and others. The planetary segment dominated the market, accounting for 35% of market revenue. This results from the growing demand for compact, lightweight gearboxes with high power densities. Compared to other designs, planetary gearboxes enable a better torque-to-weight ratio, which is advantageous in various industries, including robotics, aircraft, automotive, and other industries. The increasing demand for precision and accuracy across various industrial applications is another element boosting this segment's sales growth.</p>

    <p>Due to their design, which distributes the load across numerous gear teeth and enables smoother, more precisely regulated motion, planetary gearboxes exhibit notable precision. The characteristics above enable their use in robotics, printing presses, and Computer Numerical Control (CNC) machines, where accurate positioning and motion control are essential.</p>

    Industrial Gearbox Service Design Insights

    <p>Based on the design, the Industrial Gearbox Service market segmentation includes parallel axis, angled axis and others. The parallel axis segment dominated the market. The industrial gearbox with parallel axes has a straightforward mechanism for numerous industries. This industrial gearbox operates at low and medium speeds and is very effective. It is commonly utilized in industries that produce goods.</p>

    <p>Figure 1: Industrial Gearbox Service Market, by Design, 2024 &amp; 2032 (USD Billion)</p>

    <p>Source: Secondary Research, Primary Research, Market Research Future Database and Analyst Review</p>

    Industrial Gearbox Service Part Insights

    <p>Based on the part, the Industrial Gearbox Service market segmentation includes gear, shaft and bearings. The gear segment dominated the market. Vehicle sales have a direct impact on the growth of the gears market. Adopting more expensive and energy-efficient technologies, such as seven-speed and eight-speed automatic gearboxes, is another factor driving market growth in the automobile industry.</p>

    Industrial Gearbox Service Industry Insights

    <p>The Industrial Gearbox Service market segmentation, based on industry, includes power generation, construction, material handling, industrial, wind power, marine, etc. Power generation segment generated the most income. Power plants must run continuously, seven days a week, to meet demand. Electricity is always produced at maximum capacity thanks to power plants. Between the steam turbine and the electric generator are attached the high-speed gears. The gearbox's function is to reduce the extraordinarily high turbine speed to the designated generator speed. The transmissions are quite reliable and effective.</p>

    Get more detailed insights about Industrial Gearbox Service Market Research Report - Global Forecast till 2035

    Regional Insights

    By region, the study provides market insights into North America, Europe, Asia-Pacific and the Rest of the World. The North American Industrial Gearbox Service market will dominate this market; the sector's growth will be fueled by ongoing investments in cutting-edge machinery that will produce more accuracy. The increased demand for manufacturing plant operational cost reduction would fuel the company's necessity. Reduced waste of raw materials and production workflow errors can lead to lower costs.

    Further, the major countries studied in the market report are The US, Canada, German, France, the UK, Spain, Italy,  China, Japan, India, Australia, South Korea, and Brazil.

    Figure 2: Industrial Gearbox Service Market Share By Region 2022 (USD Billion)

    Industrial Gearbox Service Market Share By Region 2022 (USD Billion)

    Source: Secondary Research, Primary Research, Market Research Future Database and Analyst Review

    Europe's Industrial Gearbox Service market accounts for the second-largest market share. Precision gearboxes are employed in various industries and applications because they can accommodate various drive configurations and requirements. In Europe, each company established a name as one of the top producers of heavy-duty gearboxes. The UK Industrial Gearbox Service market grew at the highest rate in the European region, while the German Industrial Gearbox Service market had the largest market share.

    From 2023 to 2032, the Industrial Gearbox Service Market in Asia-Pacific is anticipated to experience the quickest CAGR growth. This is due to the increase in investment in residential and industrial infrastructure construction, particularly in developing economies like China, Japan, India, and South Korea. Moreover, China's Industrial Gearbox Service market held the largest market share, and the Indian Industrial Gearbox Service market was the fastest-growing market in the Asia-Pacific region.

    Key Players and Competitive Insights

    Leading market companies are extensively spending R&D on increasing their product lines, which will help the Industrial Gearbox Service market grow even more. Important market developments include new product releases, contractual agreements, acquisitions and mergers, greater investments, and collaboration with other organizations. The Industrial Gearbox Service industry must produce cost-effective merchandise to flourish and thrive in a more competitive and increasing market climate.

    Manufacturing locally to reduce operating costs is an effective business strategy manufacturers use in the worldwide Industrial Gearbox Service industry to serve clients and expand the market sector. The Industrial Gearbox Service industry has provided some of the most important benefits recently. Major players in the Industrial Gearbox Service market, including Schneider Electric, Siemens Energy GmbH & Co KG, and others, are attempting to increase market demand by investing in research and development operations.

    Leading international company Schneider Electric provides solutions for the digital transformation of the automation and energy management sectors. It offers goods and services for infrastructure, businesses, data centers, residences, and other structures. The business also provides comprehensive efficiency solutions that combine software, automation, and energy. Low voltage (building), medium voltage (infrastructure), industrial automation (industry), and secure power (IT) are its four business segments. The industrial automation part of its product line includes distributed control systems (DCS).

    In August 2020, ProLeiT AG, a supplier of integrated manufacturing Execution Systems (MES) and Process Control Systems (PCS), was bought by Schneider Electric, which aided in the expansion of its product line.

    Technology company Siemens concentrates on the infrastructure, mobility, and healthcare sectors. Enhanced healthcare, smarter buildings and grids, cleaner, more comfortable transportation, and more resource-efficient factories. It has particular expertise in the following areas: electrification, automation, innovation, digitalization, solutions, technology, engineering, artificial intelligence, manufacturing, the Internet of Things (IoT), cybersecurity, infrastructure, and mobility. The business is present both inside and outside of India. In November 2021, Siemens Energy GmbH & Co KG and Nanjing High Speed & Accurate Gear Group Co., Ltd. inked a master strategic frame agreement.

    Through reciprocal technological innovation, this agreement seeks to increase partnership in the energy, oil & gas, and new energy sectors in the future. This will result in cooperation that benefits all parties.

    Key Companies in the Industrial Gearbox Service Market market include

    Industry Developments

    May 2021: An SGT5-4000F gas turbine, an SST5-3000 steam turbine, a generator, a condenser, and an SPPA-T3000 control system were supplied by Siemens in collaboration with the Ivory Coast CCGT power plant.

    March 2021: For a 718 MW combined cycle power plant in Narayanganj, Bangladesh, General Electric collaborated with Reliance Bangladesh LNG & Power Ltd. to provide maintenance services and a range of digital technologies.

    Future Outlook

    Industrial Gearbox Service Market Future Outlook

    <p>The Global Industrial Gearbox Service Market is projected to grow at a 3.75% CAGR from 2025 to 2035, driven by technological advancements and increasing demand for automation.</p>

    New opportunities lie in:

    • <p>Invest in predictive maintenance technologies to enhance service efficiency. Expand service offerings to include retrofitting and upgrades for existing gearboxes. Develop strategic partnerships with OEMs for integrated service solutions.</p>

    <p>By 2035, the market is expected to achieve robust growth, reflecting evolving industrial needs and technological integration.</p>

    Market Segmentation

    Industrial Gearbox Service Part Outlook

    • Gear
    • Shaft
    • Bearings

    Industrial Gearbox Service Type Outlook

    • Planetary
    • Helical
    • Bevel
    • Spur
    • Worm
    • Others

    Industrial Gearbox Service Design Outlook

    • Parallel axis
    • Angled Axis
    • Others

    Industrial Gearbox Service Industry Outlook

    • Power Generation
    • Construction
    • Material Handling
    • Industrial
    • Wind Power
    • Marine
    • Others

    Industrial Gearbox Service Regional Outlook

    • {"North America"=>["US"
    • "Canada"]}
    • {"Europe"=>["Germany"
    • "France"
    • "UK"
    • "Italy"
    • "Spain"
    • "Rest of Europe"]}
    • {"Asia-Pacific"=>["China"
    • "Japan"
    • "India"
    • "Australia"
    • "South Korea"
    • "Rest of Asia-Pacific"]}
    • {"Rest of the World"=>["Middle East"
    • "Africa"
    • "Latin America"]}

    Report Scope

    Report Attribute/MetricDetails
    Market Size 2024USD 29.26 Billion
    Market Size 203543.88 (Value (USD Billion))
    Compound Annual Growth Rate (CAGR)3.75% (2025 - 2035)
    Base Year2024
    Market Forecast Period2025 - 2035
    Historical Data2018- 2022
    Market Forecast UnitsValue (USD Billion)
    Report CoverageRevenue Forecast, Market Competitive Landscape, Growth Factors, and Trends
    Segments CoveredType, Design, Part, Industry, and Region
    Geographies CoveredNorth America, Europe, Asia Pacific, and the Rest of the World
    Countries CoveredThe US, Canada, German, France, UK, Italy, Spain, China, Japan, India, Australia, South Korea, and Brazil
    Key Companies Profiled Parsons Peebles LTD (UK), GBS Gearbox Services International (Switzerland), David Brown Santasalo (UK), Greater (US), Triveni Engineering & Industries Ltd. (India), Kumera Corporation (Finland), , Sumitomo Heavy Industries, Ltd (Japan), Horner Industrial Group (Indiana), Sew-Eurodrive (Germany), Elecon Group Company Limited (India), Fluor Corporation (US), Artec Machine Systems (US), Dana Limited (US), PG Drive (India), and Unico Mechanical (US)
    Key Market OpportunitiesRise in the number of applications in renewable energy
    Key Market DynamicsRapid growth of the construction industry in developing nations
    Market Size 202530.36 (Value (USD Billion))

    FAQs

    How much is the Industrial Gearbox Service market?

    The Industrial Gearbox Service market size was valued at USD 28.05 Billion in 2023.

    What is the growth rate of the Industrial Gearbox Service market?

    The market is projected to grow at a CAGR of 3.75% during the forecast period, 2024-2032.

    Which region held the largest market share in the Industrial Gearbox Service market?

    North America had the largest share in the market.

    Who are the key players in the Industrial Gearbox Service market?

    The key players in the market are Parsons Peebles LTD (UK), GBS Gearbox Services International (Switzerland), David Brown Santasalo (UK), Greater (US), Triveni Engineering &amp; Industries Ltd. (India).

    Which design led the Industrial Gearbox Service market?

    The Parallel axis dominated the market in 2022.

    Which industry had the largest market share in the Industrial Gearbox Service market?

    The power generation had the largest share in the market.

    1. SECTION I: EXECUTIVE SUMMARY AND KEY HIGHLIGHTS
      1. | 1.1 EXECUTIVE SUMMARY
      2. | | 1.1.1 Market Overview
      3. | | 1.1.2 Key Findings
      4. | | 1.1.3 Market Segmentation
      5. | | 1.1.4 Competitive Landscape
      6. | | 1.1.5 Challenges and Opportunities
      7. | | 1.1.6 Future Outlook
    2. SECTION II: SCOPING, METHODOLOGY AND MARKET STRUCTURE
      1. | 2.1 MARKET INTRODUCTION
      2. | | 2.1.1 Definition
      3. | | 2.1.2 Scope of the study
      4. | | | 2.1.2.1 Research Objective
      5. | | | 2.1.2.2 Assumption
      6. | | | 2.1.2.3 Limitations
      7. | 2.2 RESEARCH METHODOLOGY
      8. | | 2.2.1 Overview
      9. | | 2.2.2 Data Mining
      10. | | 2.2.3 Secondary Research
      11. | | 2.2.4 Primary Research
      12. | | | 2.2.4.1 Primary Interviews and Information Gathering Process
      13. | | | 2.2.4.2 Breakdown of Primary Respondents
      14. | | 2.2.5 Forecasting Model
      15. | | 2.2.6 Market Size Estimation
      16. | | | 2.2.6.1 Bottom-Up Approach
      17. | | | 2.2.6.2 Top-Down Approach
      18. | | 2.2.7 Data Triangulation
      19. | | 2.2.8 Validation
    3. SECTION III: QUALITATIVE ANALYSIS
      1. | 3.1 MARKET DYNAMICS
      2. | | 3.1.1 Overview
      3. | | 3.1.2 Drivers
      4. | | 3.1.3 Restraints
      5. | | 3.1.4 Opportunities
      6. | 3.2 MARKET FACTOR ANALYSIS
      7. | | 3.2.1 Value chain Analysis
      8. | | 3.2.2 Porter's Five Forces Analysis
      9. | | | 3.2.2.1 Bargaining Power of Suppliers
      10. | | | 3.2.2.2 Bargaining Power of Buyers
      11. | | | 3.2.2.3 Threat of New Entrants
      12. | | | 3.2.2.4 Threat of Substitutes
      13. | | | 3.2.2.5 Intensity of Rivalry
      14. | | 3.2.3 COVID-19 Impact Analysis
      15. | | | 3.2.3.1 Market Impact Analysis
      16. | | | 3.2.3.2 Regional Impact
      17. | | | 3.2.3.3 Opportunity and Threat Analysis
    4. SECTION IV: QUANTITATIVE ANALYSIS
      1. | 4.1 Energy & Power, BY Type (USD Billion)
      2. | | 4.1.1 Planetary
      3. | | 4.1.2 Helical
      4. | | 4.1.3 Bevel
      5. | | 4.1.4 Spur
      6. | | 4.1.5 Worm
      7. | | 4.1.6 Others
      8. | 4.2 Energy & Power, BY Design (USD Billion)
      9. | | 4.2.1 Parallel axis
      10. | | 4.2.2 Angled axis
      11. | | 4.2.3 Others
      12. | 4.3 Energy & Power, BY Part (USD Billion)
      13. | | 4.3.1 Gear
      14. | | 4.3.2 Shaft
      15. | | 4.3.3 Bearings
      16. | 4.4 Energy & Power, BY Industry (USD Billion)
      17. | | 4.4.1 Power Generation
      18. | | 4.4.2 Construction
      19. | | 4.4.3 Material Handling
      20. | | 4.4.4 Industrial
      21. | | 4.4.5 Wind Power
      22. | | 4.4.6 Marine
      23. | | 4.4.7 Others
      24. | 4.5 Energy & Power, BY Region (USD Billion)
      25. | | 4.5.1 North America
      26. | | | 4.5.1.1 US
      27. | | | 4.5.1.2 Canada
      28. | | 4.5.2 Europe
      29. | | | 4.5.2.1 Germany
      30. | | | 4.5.2.2 UK
      31. | | | 4.5.2.3 France
      32. | | | 4.5.2.4 Russia
      33. | | | 4.5.2.5 Italy
      34. | | | 4.5.2.6 Spain
      35. | | | 4.5.2.7 Rest of Europe
      36. | | 4.5.3 APAC
      37. | | | 4.5.3.1 China
      38. | | | 4.5.3.2 India
      39. | | | 4.5.3.3 Japan
      40. | | | 4.5.3.4 South Korea
      41. | | | 4.5.3.5 Malaysia
      42. | | | 4.5.3.6 Thailand
      43. | | | 4.5.3.7 Indonesia
      44. | | | 4.5.3.8 Rest of APAC
      45. | | 4.5.4 South America
      46. | | | 4.5.4.1 Brazil
      47. | | | 4.5.4.2 Mexico
      48. | | | 4.5.4.3 Argentina
      49. | | | 4.5.4.4 Rest of South America
      50. | | 4.5.5 MEA
      51. | | | 4.5.5.1 GCC Countries
      52. | | | 4.5.5.2 South Africa
      53. | | | 4.5.5.3 Rest of MEA
    5. SECTION V: COMPETITIVE ANALYSIS
      1. | 5.1 Competitive Landscape
      2. | | 5.1.1 Overview
      3. | | 5.1.2 Competitive Analysis
      4. | | 5.1.3 Market share Analysis
      5. | | 5.1.4 Major Growth Strategy in the Energy & Power
      6. | | 5.1.5 Competitive Benchmarking
      7. | | 5.1.6 Leading Players in Terms of Number of Developments in the Energy & Power
      8. | | 5.1.7 Key developments and growth strategies
      9. | | | 5.1.7.1 New Product Launch/Service Deployment
      10. | | | 5.1.7.2 Merger & Acquisitions
      11. | | | 5.1.7.3 Joint Ventures
      12. | | 5.1.8 Major Players Financial Matrix
      13. | | | 5.1.8.1 Sales and Operating Income
      14. | | | 5.1.8.2 Major Players R&D Expenditure. 2023
      15. | 5.2 Company Profiles
      16. | | 5.2.1 Siemens AG (DE)
      17. | | | 5.2.1.1 Financial Overview
      18. | | | 5.2.1.2 Products Offered
      19. | | | 5.2.1.3 Key Developments
      20. | | | 5.2.1.4 SWOT Analysis
      21. | | | 5.2.1.5 Key Strategies
      22. | | 5.2.2 General Electric Company (US)
      23. | | | 5.2.2.1 Financial Overview
      24. | | | 5.2.2.2 Products Offered
      25. | | | 5.2.2.3 Key Developments
      26. | | | 5.2.2.4 SWOT Analysis
      27. | | | 5.2.2.5 Key Strategies
      28. | | 5.2.3 Schneider Electric SE (FR)
      29. | | | 5.2.3.1 Financial Overview
      30. | | | 5.2.3.2 Products Offered
      31. | | | 5.2.3.3 Key Developments
      32. | | | 5.2.3.4 SWOT Analysis
      33. | | | 5.2.3.5 Key Strategies
      34. | | 5.2.4 Rockwell Automation, Inc. (US)
      35. | | | 5.2.4.1 Financial Overview
      36. | | | 5.2.4.2 Products Offered
      37. | | | 5.2.4.3 Key Developments
      38. | | | 5.2.4.4 SWOT Analysis
      39. | | | 5.2.4.5 Key Strategies
      40. | | 5.2.5 ABB Ltd (CH)
      41. | | | 5.2.5.1 Financial Overview
      42. | | | 5.2.5.2 Products Offered
      43. | | | 5.2.5.3 Key Developments
      44. | | | 5.2.5.4 SWOT Analysis
      45. | | | 5.2.5.5 Key Strategies
      46. | | 5.2.6 Flender GmbH (DE)
      47. | | | 5.2.6.1 Financial Overview
      48. | | | 5.2.6.2 Products Offered
      49. | | | 5.2.6.3 Key Developments
      50. | | | 5.2.6.4 SWOT Analysis
      51. | | | 5.2.6.5 Key Strategies
      52. | | 5.2.7 Rexnord Corporation (US)
      53. | | | 5.2.7.1 Financial Overview
      54. | | | 5.2.7.2 Products Offered
      55. | | | 5.2.7.3 Key Developments
      56. | | | 5.2.7.4 SWOT Analysis
      57. | | | 5.2.7.5 Key Strategies
      58. | | 5.2.8 David Brown Santasalo (GB)
      59. | | | 5.2.8.1 Financial Overview
      60. | | | 5.2.8.2 Products Offered
      61. | | | 5.2.8.3 Key Developments
      62. | | | 5.2.8.4 SWOT Analysis
      63. | | | 5.2.8.5 Key Strategies
      64. | | 5.2.9 Nord Drivesystems (DE)
      65. | | | 5.2.9.1 Financial Overview
      66. | | | 5.2.9.2 Products Offered
      67. | | | 5.2.9.3 Key Developments
      68. | | | 5.2.9.4 SWOT Analysis
      69. | | | 5.2.9.5 Key Strategies
      70. | 5.3 Appendix
      71. | | 5.3.1 References
      72. | | 5.3.2 Related Reports
    6. LIST OF FIGURES
      1. | 6.1 MARKET SYNOPSIS
      2. | 6.2 NORTH AMERICA MARKET ANALYSIS
      3. | 6.3 US MARKET ANALYSIS BY TYPE
      4. | 6.4 US MARKET ANALYSIS BY DESIGN
      5. | 6.5 US MARKET ANALYSIS BY PART
      6. | 6.6 US MARKET ANALYSIS BY INDUSTRY
      7. | 6.7 CANADA MARKET ANALYSIS BY TYPE
      8. | 6.8 CANADA MARKET ANALYSIS BY DESIGN
      9. | 6.9 CANADA MARKET ANALYSIS BY PART
      10. | 6.10 CANADA MARKET ANALYSIS BY INDUSTRY
      11. | 6.11 EUROPE MARKET ANALYSIS
      12. | 6.12 GERMANY MARKET ANALYSIS BY TYPE
      13. | 6.13 GERMANY MARKET ANALYSIS BY DESIGN
      14. | 6.14 GERMANY MARKET ANALYSIS BY PART
      15. | 6.15 GERMANY MARKET ANALYSIS BY INDUSTRY
      16. | 6.16 UK MARKET ANALYSIS BY TYPE
      17. | 6.17 UK MARKET ANALYSIS BY DESIGN
      18. | 6.18 UK MARKET ANALYSIS BY PART
      19. | 6.19 UK MARKET ANALYSIS BY INDUSTRY
      20. | 6.20 FRANCE MARKET ANALYSIS BY TYPE
      21. | 6.21 FRANCE MARKET ANALYSIS BY DESIGN
      22. | 6.22 FRANCE MARKET ANALYSIS BY PART
      23. | 6.23 FRANCE MARKET ANALYSIS BY INDUSTRY
      24. | 6.24 RUSSIA MARKET ANALYSIS BY TYPE
      25. | 6.25 RUSSIA MARKET ANALYSIS BY DESIGN
      26. | 6.26 RUSSIA MARKET ANALYSIS BY PART
      27. | 6.27 RUSSIA MARKET ANALYSIS BY INDUSTRY
      28. | 6.28 ITALY MARKET ANALYSIS BY TYPE
      29. | 6.29 ITALY MARKET ANALYSIS BY DESIGN
      30. | 6.30 ITALY MARKET ANALYSIS BY PART
      31. | 6.31 ITALY MARKET ANALYSIS BY INDUSTRY
      32. | 6.32 SPAIN MARKET ANALYSIS BY TYPE
      33. | 6.33 SPAIN MARKET ANALYSIS BY DESIGN
      34. | 6.34 SPAIN MARKET ANALYSIS BY PART
      35. | 6.35 SPAIN MARKET ANALYSIS BY INDUSTRY
      36. | 6.36 REST OF EUROPE MARKET ANALYSIS BY TYPE
      37. | 6.37 REST OF EUROPE MARKET ANALYSIS BY DESIGN
      38. | 6.38 REST OF EUROPE MARKET ANALYSIS BY PART
      39. | 6.39 REST OF EUROPE MARKET ANALYSIS BY INDUSTRY
      40. | 6.40 APAC MARKET ANALYSIS
      41. | 6.41 CHINA MARKET ANALYSIS BY TYPE
      42. | 6.42 CHINA MARKET ANALYSIS BY DESIGN
      43. | 6.43 CHINA MARKET ANALYSIS BY PART
      44. | 6.44 CHINA MARKET ANALYSIS BY INDUSTRY
      45. | 6.45 INDIA MARKET ANALYSIS BY TYPE
      46. | 6.46 INDIA MARKET ANALYSIS BY DESIGN
      47. | 6.47 INDIA MARKET ANALYSIS BY PART
      48. | 6.48 INDIA MARKET ANALYSIS BY INDUSTRY
      49. | 6.49 JAPAN MARKET ANALYSIS BY TYPE
      50. | 6.50 JAPAN MARKET ANALYSIS BY DESIGN
      51. | 6.51 JAPAN MARKET ANALYSIS BY PART
      52. | 6.52 JAPAN MARKET ANALYSIS BY INDUSTRY
      53. | 6.53 SOUTH KOREA MARKET ANALYSIS BY TYPE
      54. | 6.54 SOUTH KOREA MARKET ANALYSIS BY DESIGN
      55. | 6.55 SOUTH KOREA MARKET ANALYSIS BY PART
      56. | 6.56 SOUTH KOREA MARKET ANALYSIS BY INDUSTRY
      57. | 6.57 MALAYSIA MARKET ANALYSIS BY TYPE
      58. | 6.58 MALAYSIA MARKET ANALYSIS BY DESIGN
      59. | 6.59 MALAYSIA MARKET ANALYSIS BY PART
      60. | 6.60 MALAYSIA MARKET ANALYSIS BY INDUSTRY
      61. | 6.61 THAILAND MARKET ANALYSIS BY TYPE
      62. | 6.62 THAILAND MARKET ANALYSIS BY DESIGN
      63. | 6.63 THAILAND MARKET ANALYSIS BY PART
      64. | 6.64 THAILAND MARKET ANALYSIS BY INDUSTRY
      65. | 6.65 INDONESIA MARKET ANALYSIS BY TYPE
      66. | 6.66 INDONESIA MARKET ANALYSIS BY DESIGN
      67. | 6.67 INDONESIA MARKET ANALYSIS BY PART
      68. | 6.68 INDONESIA MARKET ANALYSIS BY INDUSTRY
      69. | 6.69 REST OF APAC MARKET ANALYSIS BY TYPE
      70. | 6.70 REST OF APAC MARKET ANALYSIS BY DESIGN
      71. | 6.71 REST OF APAC MARKET ANALYSIS BY PART
      72. | 6.72 REST OF APAC MARKET ANALYSIS BY INDUSTRY
      73. | 6.73 SOUTH AMERICA MARKET ANALYSIS
      74. | 6.74 BRAZIL MARKET ANALYSIS BY TYPE
      75. | 6.75 BRAZIL MARKET ANALYSIS BY DESIGN
      76. | 6.76 BRAZIL MARKET ANALYSIS BY PART
      77. | 6.77 BRAZIL MARKET ANALYSIS BY INDUSTRY
      78. | 6.78 MEXICO MARKET ANALYSIS BY TYPE
      79. | 6.79 MEXICO MARKET ANALYSIS BY DESIGN
      80. | 6.80 MEXICO MARKET ANALYSIS BY PART
      81. | 6.81 MEXICO MARKET ANALYSIS BY INDUSTRY
      82. | 6.82 ARGENTINA MARKET ANALYSIS BY TYPE
      83. | 6.83 ARGENTINA MARKET ANALYSIS BY DESIGN
      84. | 6.84 ARGENTINA MARKET ANALYSIS BY PART
      85. | 6.85 ARGENTINA MARKET ANALYSIS BY INDUSTRY
      86. | 6.86 REST OF SOUTH AMERICA MARKET ANALYSIS BY TYPE
      87. | 6.87 REST OF SOUTH AMERICA MARKET ANALYSIS BY DESIGN
      88. | 6.88 REST OF SOUTH AMERICA MARKET ANALYSIS BY PART
      89. | 6.89 REST OF SOUTH AMERICA MARKET ANALYSIS BY INDUSTRY
      90. | 6.90 MEA MARKET ANALYSIS
      91. | 6.91 GCC COUNTRIES MARKET ANALYSIS BY TYPE
      92. | 6.92 GCC COUNTRIES MARKET ANALYSIS BY DESIGN
      93. | 6.93 GCC COUNTRIES MARKET ANALYSIS BY PART
      94. | 6.94 GCC COUNTRIES MARKET ANALYSIS BY INDUSTRY
      95. | 6.95 SOUTH AFRICA MARKET ANALYSIS BY TYPE
      96. | 6.96 SOUTH AFRICA MARKET ANALYSIS BY DESIGN
      97. | 6.97 SOUTH AFRICA MARKET ANALYSIS BY PART
      98. | 6.98 SOUTH AFRICA MARKET ANALYSIS BY INDUSTRY
      99. | 6.99 REST OF MEA MARKET ANALYSIS BY TYPE
      100. | 6.100 REST OF MEA MARKET ANALYSIS BY DESIGN
      101. | 6.101 REST OF MEA MARKET ANALYSIS BY PART
      102. | 6.102 REST OF MEA MARKET ANALYSIS BY INDUSTRY
      103. | 6.103 KEY BUYING CRITERIA OF ENERGY & POWER
      104. | 6.104 RESEARCH PROCESS OF MRFR
      105. | 6.105 DRO ANALYSIS OF ENERGY & POWER
      106. | 6.106 DRIVERS IMPACT ANALYSIS: ENERGY & POWER
      107. | 6.107 RESTRAINTS IMPACT ANALYSIS: ENERGY & POWER
      108. | 6.108 SUPPLY / VALUE CHAIN: ENERGY & POWER
      109. | 6.109 ENERGY & POWER, BY TYPE, 2024 (% SHARE)
      110. | 6.110 ENERGY & POWER, BY TYPE, 2024 TO 2035 (USD Billion)
      111. | 6.111 ENERGY & POWER, BY DESIGN, 2024 (% SHARE)
      112. | 6.112 ENERGY & POWER, BY DESIGN, 2024 TO 2035 (USD Billion)
      113. | 6.113 ENERGY & POWER, BY PART, 2024 (% SHARE)
      114. | 6.114 ENERGY & POWER, BY PART, 2024 TO 2035 (USD Billion)
      115. | 6.115 ENERGY & POWER, BY INDUSTRY, 2024 (% SHARE)
      116. | 6.116 ENERGY & POWER, BY INDUSTRY, 2024 TO 2035 (USD Billion)
      117. | 6.117 BENCHMARKING OF MAJOR COMPETITORS
    7. LIST OF TABLES
      1. | 7.1 LIST OF ASSUMPTIONS
      2. | | 7.1.1
      3. | 7.2 North America MARKET SIZE ESTIMATES; FORECAST
      4. | | 7.2.1 BY TYPE, 2025-2035 (USD Billion)
      5. | | 7.2.2 BY DESIGN, 2025-2035 (USD Billion)
      6. | | 7.2.3 BY PART, 2025-2035 (USD Billion)
      7. | | 7.2.4 BY INDUSTRY, 2025-2035 (USD Billion)
      8. | 7.3 US MARKET SIZE ESTIMATES; FORECAST
      9. | | 7.3.1 BY TYPE, 2025-2035 (USD Billion)
      10. | | 7.3.2 BY DESIGN, 2025-2035 (USD Billion)
      11. | | 7.3.3 BY PART, 2025-2035 (USD Billion)
      12. | | 7.3.4 BY INDUSTRY, 2025-2035 (USD Billion)
      13. | 7.4 Canada MARKET SIZE ESTIMATES; FORECAST
      14. | | 7.4.1 BY TYPE, 2025-2035 (USD Billion)
      15. | | 7.4.2 BY DESIGN, 2025-2035 (USD Billion)
      16. | | 7.4.3 BY PART, 2025-2035 (USD Billion)
      17. | | 7.4.4 BY INDUSTRY, 2025-2035 (USD Billion)
      18. | 7.5 Europe MARKET SIZE ESTIMATES; FORECAST
      19. | | 7.5.1 BY TYPE, 2025-2035 (USD Billion)
      20. | | 7.5.2 BY DESIGN, 2025-2035 (USD Billion)
      21. | | 7.5.3 BY PART, 2025-2035 (USD Billion)
      22. | | 7.5.4 BY INDUSTRY, 2025-2035 (USD Billion)
      23. | 7.6 Germany MARKET SIZE ESTIMATES; FORECAST
      24. | | 7.6.1 BY TYPE, 2025-2035 (USD Billion)
      25. | | 7.6.2 BY DESIGN, 2025-2035 (USD Billion)
      26. | | 7.6.3 BY PART, 2025-2035 (USD Billion)
      27. | | 7.6.4 BY INDUSTRY, 2025-2035 (USD Billion)
      28. | 7.7 UK MARKET SIZE ESTIMATES; FORECAST
      29. | | 7.7.1 BY TYPE, 2025-2035 (USD Billion)
      30. | | 7.7.2 BY DESIGN, 2025-2035 (USD Billion)
      31. | | 7.7.3 BY PART, 2025-2035 (USD Billion)
      32. | | 7.7.4 BY INDUSTRY, 2025-2035 (USD Billion)
      33. | 7.8 France MARKET SIZE ESTIMATES; FORECAST
      34. | | 7.8.1 BY TYPE, 2025-2035 (USD Billion)
      35. | | 7.8.2 BY DESIGN, 2025-2035 (USD Billion)
      36. | | 7.8.3 BY PART, 2025-2035 (USD Billion)
      37. | | 7.8.4 BY INDUSTRY, 2025-2035 (USD Billion)
      38. | 7.9 Russia MARKET SIZE ESTIMATES; FORECAST
      39. | | 7.9.1 BY TYPE, 2025-2035 (USD Billion)
      40. | | 7.9.2 BY DESIGN, 2025-2035 (USD Billion)
      41. | | 7.9.3 BY PART, 2025-2035 (USD Billion)
      42. | | 7.9.4 BY INDUSTRY, 2025-2035 (USD Billion)
      43. | 7.10 Italy MARKET SIZE ESTIMATES; FORECAST
      44. | | 7.10.1 BY TYPE, 2025-2035 (USD Billion)
      45. | | 7.10.2 BY DESIGN, 2025-2035 (USD Billion)
      46. | | 7.10.3 BY PART, 2025-2035 (USD Billion)
      47. | | 7.10.4 BY INDUSTRY, 2025-2035 (USD Billion)
      48. | 7.11 Spain MARKET SIZE ESTIMATES; FORECAST
      49. | | 7.11.1 BY TYPE, 2025-2035 (USD Billion)
      50. | | 7.11.2 BY DESIGN, 2025-2035 (USD Billion)
      51. | | 7.11.3 BY PART, 2025-2035 (USD Billion)
      52. | | 7.11.4 BY INDUSTRY, 2025-2035 (USD Billion)
      53. | 7.12 Rest of Europe MARKET SIZE ESTIMATES; FORECAST
      54. | | 7.12.1 BY TYPE, 2025-2035 (USD Billion)
      55. | | 7.12.2 BY DESIGN, 2025-2035 (USD Billion)
      56. | | 7.12.3 BY PART, 2025-2035 (USD Billion)
      57. | | 7.12.4 BY INDUSTRY, 2025-2035 (USD Billion)
      58. | 7.13 APAC MARKET SIZE ESTIMATES; FORECAST
      59. | | 7.13.1 BY TYPE, 2025-2035 (USD Billion)
      60. | | 7.13.2 BY DESIGN, 2025-2035 (USD Billion)
      61. | | 7.13.3 BY PART, 2025-2035 (USD Billion)
      62. | | 7.13.4 BY INDUSTRY, 2025-2035 (USD Billion)
      63. | 7.14 China MARKET SIZE ESTIMATES; FORECAST
      64. | | 7.14.1 BY TYPE, 2025-2035 (USD Billion)
      65. | | 7.14.2 BY DESIGN, 2025-2035 (USD Billion)
      66. | | 7.14.3 BY PART, 2025-2035 (USD Billion)
      67. | | 7.14.4 BY INDUSTRY, 2025-2035 (USD Billion)
      68. | 7.15 India MARKET SIZE ESTIMATES; FORECAST
      69. | | 7.15.1 BY TYPE, 2025-2035 (USD Billion)
      70. | | 7.15.2 BY DESIGN, 2025-2035 (USD Billion)
      71. | | 7.15.3 BY PART, 2025-2035 (USD Billion)
      72. | | 7.15.4 BY INDUSTRY, 2025-2035 (USD Billion)
      73. | 7.16 Japan MARKET SIZE ESTIMATES; FORECAST
      74. | | 7.16.1 BY TYPE, 2025-2035 (USD Billion)
      75. | | 7.16.2 BY DESIGN, 2025-2035 (USD Billion)
      76. | | 7.16.3 BY PART, 2025-2035 (USD Billion)
      77. | | 7.16.4 BY INDUSTRY, 2025-2035 (USD Billion)
      78. | 7.17 South Korea MARKET SIZE ESTIMATES; FORECAST
      79. | | 7.17.1 BY TYPE, 2025-2035 (USD Billion)
      80. | | 7.17.2 BY DESIGN, 2025-2035 (USD Billion)
      81. | | 7.17.3 BY PART, 2025-2035 (USD Billion)
      82. | | 7.17.4 BY INDUSTRY, 2025-2035 (USD Billion)
      83. | 7.18 Malaysia MARKET SIZE ESTIMATES; FORECAST
      84. | | 7.18.1 BY TYPE, 2025-2035 (USD Billion)
      85. | | 7.18.2 BY DESIGN, 2025-2035 (USD Billion)
      86. | | 7.18.3 BY PART, 2025-2035 (USD Billion)
      87. | | 7.18.4 BY INDUSTRY, 2025-2035 (USD Billion)
      88. | 7.19 Thailand MARKET SIZE ESTIMATES; FORECAST
      89. | | 7.19.1 BY TYPE, 2025-2035 (USD Billion)
      90. | | 7.19.2 BY DESIGN, 2025-2035 (USD Billion)
      91. | | 7.19.3 BY PART, 2025-2035 (USD Billion)
      92. | | 7.19.4 BY INDUSTRY, 2025-2035 (USD Billion)
      93. | 7.20 Indonesia MARKET SIZE ESTIMATES; FORECAST
      94. | | 7.20.1 BY TYPE, 2025-2035 (USD Billion)
      95. | | 7.20.2 BY DESIGN, 2025-2035 (USD Billion)
      96. | | 7.20.3 BY PART, 2025-2035 (USD Billion)
      97. | | 7.20.4 BY INDUSTRY, 2025-2035 (USD Billion)
      98. | 7.21 Rest of APAC MARKET SIZE ESTIMATES; FORECAST
      99. | | 7.21.1 BY TYPE, 2025-2035 (USD Billion)
      100. | | 7.21.2 BY DESIGN, 2025-2035 (USD Billion)
      101. | | 7.21.3 BY PART, 2025-2035 (USD Billion)
      102. | | 7.21.4 BY INDUSTRY, 2025-2035 (USD Billion)
      103. | 7.22 South America MARKET SIZE ESTIMATES; FORECAST
      104. | | 7.22.1 BY TYPE, 2025-2035 (USD Billion)
      105. | | 7.22.2 BY DESIGN, 2025-2035 (USD Billion)
      106. | | 7.22.3 BY PART, 2025-2035 (USD Billion)
      107. | | 7.22.4 BY INDUSTRY, 2025-2035 (USD Billion)
      108. | 7.23 Brazil MARKET SIZE ESTIMATES; FORECAST
      109. | | 7.23.1 BY TYPE, 2025-2035 (USD Billion)
      110. | | 7.23.2 BY DESIGN, 2025-2035 (USD Billion)
      111. | | 7.23.3 BY PART, 2025-2035 (USD Billion)
      112. | | 7.23.4 BY INDUSTRY, 2025-2035 (USD Billion)
      113. | 7.24 Mexico MARKET SIZE ESTIMATES; FORECAST
      114. | | 7.24.1 BY TYPE, 2025-2035 (USD Billion)
      115. | | 7.24.2 BY DESIGN, 2025-2035 (USD Billion)
      116. | | 7.24.3 BY PART, 2025-2035 (USD Billion)
      117. | | 7.24.4 BY INDUSTRY, 2025-2035 (USD Billion)
      118. | 7.25 Argentina MARKET SIZE ESTIMATES; FORECAST
      119. | | 7.25.1 BY TYPE, 2025-2035 (USD Billion)
      120. | | 7.25.2 BY DESIGN, 2025-2035 (USD Billion)
      121. | | 7.25.3 BY PART, 2025-2035 (USD Billion)
      122. | | 7.25.4 BY INDUSTRY, 2025-2035 (USD Billion)
      123. | 7.26 Rest of South America MARKET SIZE ESTIMATES; FORECAST
      124. | | 7.26.1 BY TYPE, 2025-2035 (USD Billion)
      125. | | 7.26.2 BY DESIGN, 2025-2035 (USD Billion)
      126. | | 7.26.3 BY PART, 2025-2035 (USD Billion)
      127. | | 7.26.4 BY INDUSTRY, 2025-2035 (USD Billion)
      128. | 7.27 MEA MARKET SIZE ESTIMATES; FORECAST
      129. | | 7.27.1 BY TYPE, 2025-2035 (USD Billion)
      130. | | 7.27.2 BY DESIGN, 2025-2035 (USD Billion)
      131. | | 7.27.3 BY PART, 2025-2035 (USD Billion)
      132. | | 7.27.4 BY INDUSTRY, 2025-2035 (USD Billion)
      133. | 7.28 GCC Countries MARKET SIZE ESTIMATES; FORECAST
      134. | | 7.28.1 BY TYPE, 2025-2035 (USD Billion)
      135. | | 7.28.2 BY DESIGN, 2025-2035 (USD Billion)
      136. | | 7.28.3 BY PART, 2025-2035 (USD Billion)
      137. | | 7.28.4 BY INDUSTRY, 2025-2035 (USD Billion)
      138. | 7.29 South Africa MARKET SIZE ESTIMATES; FORECAST
      139. | | 7.29.1 BY TYPE, 2025-2035 (USD Billion)
      140. | | 7.29.2 BY DESIGN, 2025-2035 (USD Billion)
      141. | | 7.29.3 BY PART, 2025-2035 (USD Billion)
      142. | | 7.29.4 BY INDUSTRY, 2025-2035 (USD Billion)
      143. | 7.30 Rest of MEA MARKET SIZE ESTIMATES; FORECAST
      144. | | 7.30.1 BY TYPE, 2025-2035 (USD Billion)
      145. | | 7.30.2 BY DESIGN, 2025-2035 (USD Billion)
      146. | | 7.30.3 BY PART, 2025-2035 (USD Billion)
      147. | | 7.30.4 BY INDUSTRY, 2025-2035 (USD Billion)
      148. | 7.31 PRODUCT LAUNCH/PRODUCT DEVELOPMENT/APPROVAL
      149. | | 7.31.1
      150. | 7.32 ACQUISITION/PARTNERSHIP
      151. | | 7.32.1

    Industrial Gearbox Service Market Segmentation

    Industrial Gearbox Type Outlook (USD Billion, 2018-2032)

    Planetary

    Helical

    Bevel

    Spur

    Worm

    Others

    Industrial Gearbox Service Design Outlook (USD Billion, 2018-2032)

    Parallel axis

    Angled Axis

    Others

    Industrial Gearbox Service Part Outlook (USD Billion, 2018-2032)

    Gear

    Shaft

    Bearings

    Industrial Gearbox Service Industry Outlook (USD Billion, 2018-2032)

    Power Generation

    Construction

    Material Handling

    Industrial

    Wind Power

    Marine

    Others

    Industrial Gearbox Regional Outlook (USD Billion, 2018-2032)

    North America Outlook (USD Billion, 2018-2032)

    North America Industrial Gearbox by Type

    Planetary

    Helical

    Bevel

    Spur

    Worm

    Others

    North America Industrial Gearbox Service by Design

    Parallel axis

    Angled Axis

    Others

    North America Industrial Gearbox Service by Part

    Gear

    Shaft

    Bearings

    North America Industrial Gearbox Service by Industry

    Power Generation

    Construction

    Material Handling

    Industrial

    Wind Power

    Marine

    Others

    US Outlook (USD Billion, 2018-2032)

    US Industrial Gearbox by Type

    Planetary

    Helical

    Bevel

    Spur

    Worm

    Others

    US Industrial Gearbox Service by Design

    Parallel axis

    Angled Axis

    Others

    US Industrial Gearbox Service by Part

    Gear

    Shaft

    Bearings

    US Industrial Gearbox Service by Industry

    Power Generation

    Construction

    Material Handling

    Industrial

    Wind Power

    Marine

    Others

    CANADA Outlook (USD Billion, 2018-2032)

    CANADA Industrial Gearbox by Type

    Planetary

    Helical

    Bevel

    Spur

    Worm

    Others

    CANADA Industrial Gearbox Service by Design

    Parallel axis

    Angled Axis

    Others

    CANADA Industrial Gearbox Service by Part

    Gear

    Shaft

    Bearings

    CANADA Industrial Gearbox Service by Industry

    Power Generation

    Construction

    Material Handling

    Industrial

    Wind Power

    Marine

    Others

    Europe Outlook (USD Billion, 2018-2032)

    Europe Industrial Gearbox by Type

    Planetary

    Helical

    Bevel

    Spur

    Worm

    Others

    Europe Industrial Gearbox Service by Design

    Parallel axis

    Angled Axis

    Others

    Europe Industrial Gearbox Service by Part

    Gear

    Shaft

    Bearings

    Europe Industrial Gearbox Service by Industry

    Power Generation

    Construction

    Material Handling

    Industrial

    Wind Power

    Marine

    Others

    Germany Outlook (USD Billion, 2018-2032)

    Germany Industrial Gearbox by Type

    Planetary

    Helical

    Bevel

    Spur

    Worm

    Others

    Germany Industrial Gearbox Service by Design

    Parallel axis

    Angled Axis

    Others

    Germany Industrial Gearbox Service by Part

    Gear

    Shaft

    Bearings

    Germany Industrial Gearbox Service by Industry

    Power Generation

    Construction

    Material Handling

    Industrial

    Wind Power

    Marine

    Others

    France Outlook (USD Billion, 2018-2032)

    France Industrial Gearbox by Type

    Planetary

    Helical

    Bevel

    Spur

    Worm

    Others

    France Industrial Gearbox Service by Design

    Parallel axis

    Angled Axis

    Others

    France Industrial Gearbox Service by Part

    Gear

    Shaft

    Bearings

    France Industrial Gearbox Service by Industry

    Power Generation

    Construction

    Material Handling

    Industrial

    Wind Power

    Marine

    Others

    UK Outlook (USD Billion, 2018-2032)

    UK Industrial Gearbox by Type

    Planetary

    Helical

    Bevel

    Spur

    Worm

    Others

    UK Industrial Gearbox Service by Design

    Parallel axis

    Angled Axis

    Others

    UK Industrial Gearbox Service by Part

    Gear

    Shaft

    Bearings

    UK Industrial Gearbox Service by Industry

    Power Generation

    Construction

    Material Handling

    Industrial

    Wind Power

    Marine

    Others

    ITALY Outlook (USD Billion, 2018-2032)

    ITALY Industrial Gearbox by Type

    Planetary

    Helical

    Bevel

    Spur

    Worm

    Others

    ITALY Industrial Gearbox Service by Design

    Parallel axis

    Angled Axis

    Others

    ITALY Industrial Gearbox Service by Part

    Gear

    Shaft

    Bearings

    ITALY Industrial Gearbox Service by Industry

    Power Generation

    Construction

    Material Handling

    Industrial

    Wind Power

    Marine

    Others

    SPAIN Outlook (USD Billion, 2018-2032)

    Spain Industrial Gearbox by Type

    Planetary

    Helical

    Bevel

    Spur

    Worm

    Others

    Spain Industrial Gearbox Service by Design

    Parallel axis

    Angled Axis

    Others

    Spain Industrial Gearbox Service by Part

    Gear

    Shaft

    Bearings

    Spain Industrial Gearbox Service by Industry

    Power Generation

    Construction

    Material Handling

    Industrial

    Wind Power

    Marine

    Others

    Rest Of Europe Outlook (USD Billion, 2018-2032)

    Rest Of Europe Industrial Gearbox by Type

    Planetary

    Helical

    Bevel

    Spur

    Worm

    Others

    Rest Of Europe Industrial Gearbox Service by Design

    Parallel axis

    Angled Axis

    Others

    Rest Of Europe Industrial Gearbox Service by Part

    Gear

    Shaft

    Bearings

    Rest Of Europe Industrial Gearbox Service by Industry

    Power Generation

    Construction

    Material Handling

    Industrial

    Wind Power

    Marine

    Others

    Asia-Pacific Outlook (USD Billion, 2018-2032)

    Asia-Pacific Industrial Gearbox by Type

    Planetary

    Helical

    Bevel

    Spur

    Worm

    Others

    Asia-Pacific Industrial Gearbox Service by Design

    Parallel axis

    Angled Axis

    Others

    Asia-Pacific Industrial Gearbox Service by Part

    Gear

    Shaft

    Bearings

    Asia-Pacific Industrial Gearbox Service by Industry

    Power Generation

    Construction

    Material Handling

    Industrial

    Wind Power

    Marine

    Others

    China Outlook (USD Billion, 2018-2032)

    China Industrial Gearbox by Type

    Planetary

    Helical

    Bevel

    Spur

    Worm

    Others

    China Industrial Gearbox Service by Design

    Parallel axis

    Angled Axis

    Others

    China Industrial Gearbox Service by Part

    Gear

    Shaft

    Bearings

    China Industrial Gearbox Service by Industry

    Power Generation

    Construction

    Material Handling

    Industrial

    Wind Power

    Marine

    Others

    Japan Outlook (USD Billion, 2018-2032)

    Japan Industrial Gearbox by Type

    Planetary

    Helical

    Bevel

    Spur

    Worm

    Others

    Japan Industrial Gearbox Service by Design

    Parallel axis

    Angled Axis

    Others

    Japan Industrial Gearbox Service by Part

    Gear

    Shaft

    Bearings

    Japan Industrial Gearbox Service by Industry

    Power Generation

    Construction

    Material Handling

    Industrial

    Wind Power

    Marine

    Others

    India Outlook (USD Billion, 2018-2032)

    India Industrial Gearbox by Type

    Planetary

    Helical

    Bevel

    Spur

    Worm

    Others

    India Industrial Gearbox Service by Design

    Parallel axis

    Angled Axis

    Others

    India Industrial Gearbox Service by Part

    Gear

    Shaft

    Bearings

    India Industrial Gearbox Service by Industry

    Power Generation

    Construction

    Material Handling

    Industrial

    Wind Power

    Marine

    Others

    Australia Outlook (USD Billion, 2018-2032)

    Australia Industrial Gearbox by Type

    Planetary

    Helical

    Bevel

    Spur

    Worm

    Others

    Australia Industrial Gearbox Service by Design

    Parallel axis

    Angled Axis

    Others

    Australia Industrial Gearbox Service by Part

    Gear

    Shaft

    Bearings

    Australia Industrial Gearbox Service by Industry

    Power Generation

    Construction

    Material Handling

    Industrial

    Wind Power

    Marine

    Others

    Rest of Asia-Pacific Outlook (USD Billion, 2018-2032)

    Rest of Asia-Pacific Industrial Gearbox by Type

    Planetary

    Helical

    Bevel

    Spur

    Worm

    Others

    Rest of Asia-Pacific Industrial Gearbox Service by Design

    Parallel axis

    Angled Axis

    Others

    Rest of Asia-Pacific Industrial Gearbox Service by Part

    Gear

    Shaft

    Bearings

    Rest of Asia-Pacific Industrial Gearbox Service by Industry

    Power Generation

    Construction

    Material Handling

    Industrial

    Wind Power

    Marine

    Others

    Rest of the World Outlook (USD Billion, 2018-2032)

    Rest of the World Industrial Gearbox by Type

    Planetary

    Helical

    Bevel

    Spur

    Worm

    Others

    Rest of the World Industrial Gearbox Service by Design

    Parallel axis

    Angled Axis

    Others

    Rest of the World Industrial Gearbox Service by Part

    Gear

    Shaft

    Bearings

    Rest of the World Industrial Gearbox Service by Industry

    Power Generation

    Construction

    Material Handling

    Industrial

    Wind Power

    Marine

    Others

    Middle East Outlook (USD Billion, 2018-2032)

    Middle East Industrial Gearbox by Type

    Planetary

    Helical

    Bevel

    Spur

    Worm

    Others

    Middle East Industrial Gearbox Service by Design

    Parallel axis

    Angled Axis

    Others

    Middle East Industrial Gearbox Service by Part

    Gear

    Shaft

    Bearings

    Middle East Industrial Gearbox Service by Industry

    Power Generation

    Construction

    Material Handling

    Industrial

    Wind Power

    Marine

    Others

    Africa Outlook (USD Billion, 2018-2032)

    Africa Industrial Gearbox by Type

    Planetary

    Helical

    Bevel

    Spur

    Worm

    Others

    Africa Industrial Gearbox Service by Design

    Parallel axis

    Angled Axis

    Others

    Africa Industrial Gearbox Service by Part

    Gear

    Shaft

    Bearings

    Africa Industrial Gearbox Service by Industry

    Power Generation

    Construction

    Material Handling

    Industrial

    Wind Power

    Marine

    Others

    Latin America Outlook (USD Billion, 2018-2032)

    Latin America Industrial Gearbox by Type

    Planetary

    Helical

    Bevel

    Spur

    Worm

    Others

    Latin America Industrial Gearbox Service by Design

    Parallel axis

    Angled Axis

    Others

    Latin America Industrial Gearbox Service by Part

    Gear

    Shaft

    Bearings

    Latin America Industrial Gearbox Service by Industry

    Power Generation

    Construction

    Material Handling

    Industrial

    Wind Power

    Marine

    Others

    Infographic

    Free Sample Request

    Kindly complete the form below to receive a free sample of this Report

    Get Free Sample

    Customer Strories

    “I am very pleased with how market segments have been defined in a relevant way for my purposes (such as "Portable Freezers & refrigerators" and "last-mile"). In general the report is well structured. Thanks very much for your efforts.”

    Victoria Milne

    Founder
    Case Study
    Chemicals and Materials

    Compare Licence

    ×
    Features License Type
    Single User Multiuser License Enterprise User
    Price $4,950 $5,950 $7,250
    Maximum User Access Limit 1 User Upto 10 Users Unrestricted Access Throughout the Organization
    Free Customization
    Direct Access to Analyst
    Deliverable Format
    Platform Access
    Discount on Next Purchase 10% 15% 15%
    Printable Versions