Infant Nutrition Market (2026 - 2035)

Infant Nutrition Market Size, Share, Industry Trend & Analysis Research Report By Product Category (Infant Formula, Baby Cereals, Prepared Baby Food, Snacks & Finger Foods), By Age Group (0–6 Months, 6–12 Months, 12–24 Months, 24–36 Months), By Formula Form (Powder, Liquid Concentrate, Ready-to-Feed), By Nature (Conventional, Organic, Clean Label / No Added Sugars & Additives), By Distribution Channel (Supermarkets / Hypermarkets, Pharmacy / Drug Stores, Specialty Stores, Online Retail) - Forecast to 2035
ID: MRFR/FnB/10934-HCR
200 Pages
Snehal Singh
Last Updated: July 12, 2026
Infant Nutrition Market
Market Size
Forecast Period2026-2035
CAGR (2026-2035)7.12%
2025 Market SizeUSD 53.26 Billion
2035 Market SizeUSD 105.95 Billion
Key Players
Nestlé S.A.
Danone S.A.
Reckitt Benckiser
Abbott Laboratories
FrieslandCampina
Hain Celestial Group
Opportunities
  • Personalized Nutrition and AI-Driven Product Matching
  • Emerging Market Penetration in Sub-Saharan Africa
  • Plant-Based and Allergen-Free Formulations

Infant Nutrition Market Summary

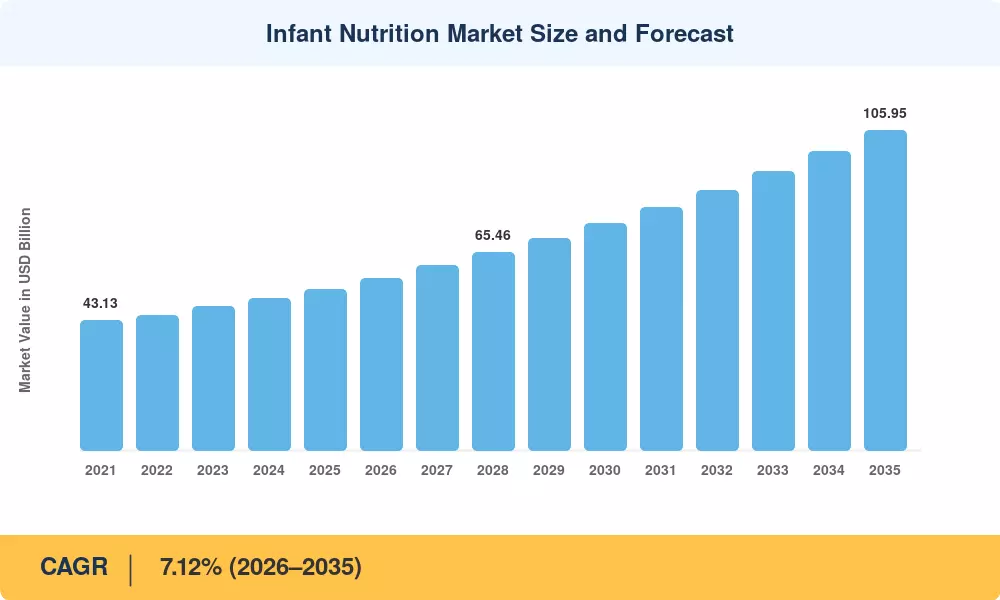
The Infant Nutrition Market reached a valuation of USD 53.26 billion in 2025, and Market Research Future (MRFR) projects it will expand from USD 57.05 billion in 2026 to USD 105.95 billion by 2035, registering a CAGR of 7.12% during 2026–2035. This growth trajectory is anchored in tightening food safety regulations across both developed and developing economies, alongside rising parental willingness to spend on premium, science-backed nutritional products. The WHO's continued emphasis on complementary feeding guidelines and government-led nutrition subsidy programs in nations such as India and China has further catalyzed category expansion [1][2].

A major change in product science is reshaping the Infant Nutrition Market environment. Traditional milk-based powders are being replaced by formulations using human milk oligosaccharides (HMOs), specific probiotic strains and precision-fermented proteins. Ingredient-level innovation is fetching price premiums of 15-25% over traditional solutions, substantiated by clinical research published in journals such as The Lancet and JAMA Pediatrics that show demonstrable developmental outcomes [3]. In 2024, global investment in baby nutrition R&D was above USD 2.8 billion, demonstrating industry confidence in next-generation formulations [4].


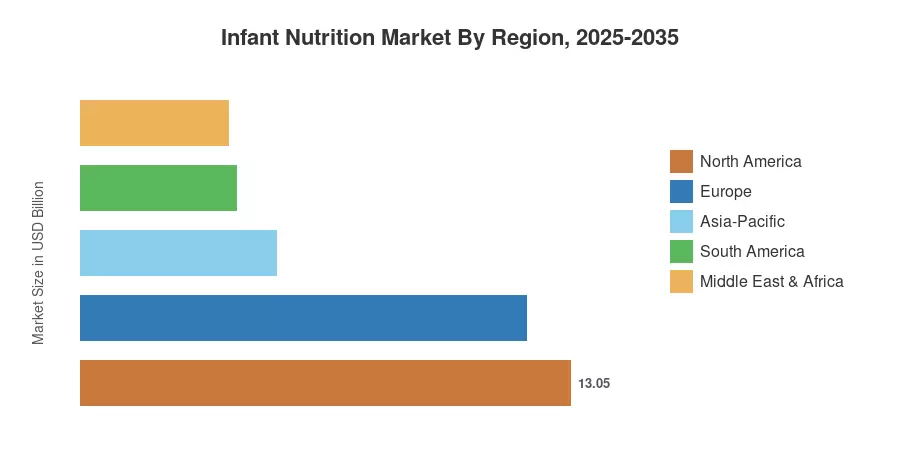
The Asia-Pacific region is a leader in the Infant Nutrition Market, accounting for around 39.7% of the revenue in 2025. This region's dominance is propelled by fast urbanization, rising dual-income households, and shifting nutritional preferences in nations such as China, India, and Southeast Asia. The area also leads the growth with a projected CAGR of 9.8% through 2035. The largest region is North America with over 24.5% market share, thanks to strict FDA monitoring and a strong direct-to-consumer environment. Next is Europe, with roughly 22.3%, helped by the EU’s clean-label regulatory regime. The Infant Nutrition Market is likely to experience large new pools of demand over the next decade as income levels rise in Africa and Latin America.


Key Report Takeaways

• By Product Category

  • Infant formula accounted for approximately 50.1% of the 2025 Infant Nutrition Market value, maintaining its position as the dominant product segment.
  • Prepared baby food is projected to expand at an 8.5% CAGR through 2035, driven by convenience-oriented purchasing behavior.

• By Distribution Channel

  • Supermarkets and hypermarkets held roughly 34.6% of the 2025 value, serving as the primary retail touchpoint.
  • Online retail is forecast to grow at a 10.7% CAGR through 2035, fueled by cross-border e-commerce and subscription models.

• By Geography

Infant Nutrition Market Size and Forecast (2021–2035)

Market Research Future’s (MRFR) sizing methodology incorporates bottom-up revenue modeling from company filings, trade databases, and government nutrition program expenditure data. Demand-side validation: Cross-references birth rate statistics, breastfeeding prevalence surveys and household expenditure panels in 40+ countries. Historical statistics (2021-2024) are based on audited figures, while projected predictions (2026-2035) utilize a calibrated 7.12% CAGR with adjustments for predicted legislative changes and demographic inflection points.
Infant Nutrition Market Size and Forecast
Our Impact
Enabled $4.3B Revenue Impact for Fortune 500 and Leading Multinationals
Partnering with 2000+ Global Organizations Each Year
30K+ Citations by Top-Tier Firms in the Industry

Driver Impact Analysis

Driver ~% Impact on CAGR Geographic Relevance Impact Timeline
Rising dual-income households and urbanization ~18% Asia-Pacific, South America Long-term (≥4 yr)
HMO and probiotic formulation innovation ~16% Global Medium-term (2–4 yr)
Tightening food safety and labeling regulations ~14% North America, Europe Short-term (≤2 yr)
Digital and cross-border e-commerce expansion ~13% Asia-Pacific, MEA Medium-term (2–4 yr)
Government-sponsored nutrition programs ~12% India, China, Brazil Long-term (≥4 yr)
Premiumization and clean-label consumer demand ~15% North America, Europe Medium-term (2–4 yr)
Declining breastfeeding rates in urban centers ~12% Global Long-term (≥4 yr)


Urbanization and Dual-Income Household Growth

The global urban population is projected to reach approximately 6 billion by 2035. Concurrently, dual-income households have become the dominant structure in several major Asian economies, with participation rates for families with children now exceeding 60%. This structural shift continues to influence feeding practices, fueling demand for convenient, nutritionally complete infant formula alternatives. While market growth in regions like China and India remains strong—driven by rising middle-class disposable income and the expansion of organized retail in Tier-2 and Tier-3 cities—the pace of growth varies by specific sub-segment and regional economic conditions.


Ingredient Science and Formulation Breakthroughs

The infant nutrition sector is increasingly focused on evidence-based formulation. Recent technical reviews from organizations like ESPGHAN continue to evaluate the role of Human Milk Oligosaccharides (HMOs) in infant health, noting that while research is promising, the clinical benefit of specific formulations depends on individual product composition and rigorous independent study. As parents become more science-literate and attentive to product labeling, brands are prioritizing clinical backing to differentiate their offerings. Research into advanced ingredients, such as precision-fermented lactoferrin, is ongoing, with such technologies representing the next frontier for potential mainstream integration.


Regulatory Tailwinds in Key Markets

The regulatory landscape for infant nutrition remains highly stringent to ensure safety and transparency. In the United States, the FDA continues to enforce comprehensive safety and labeling requirements under existing frameworks, focusing on supply chain robustness and nutritional integrity. Similarly, the European Union maintains rigorous standards for infant formula, as established under Regulation (EU) 2016/127, which requires strict compliance with compositional and labeling protocols. In India, the FSSAI continues to update and enforce food safety standards to professionalize the domestic market further and ensure that all infant food products meet high-quality benchmarks regarding protein content and safety testing.


Digital Commerce and Direct-to-Consumer Disruption

Digital transformation is reshaping how consumers purchase infant nutrition. Online retail channels have seen a significant increase in market share, although penetration varies widely by geography. In regions like Southeast Asia, e-commerce platforms such as Shopee and Lazada have become critical infrastructure, allowing consumers to access a broader range of products and bypass traditional distribution limitations. Furthermore, subscription-based business models are gaining traction in several markets, as brands leverage direct-to-consumer strategies to improve customer engagement and long-term brand loyalty.


Restraints Impact Analysis

Restraint ~% Drag on CAGR Geographic Relevance Impact Timeline
Aggressive breastfeeding promotion policies ~(−6%) Global (WHO-aligned nations) Long-term (≥4 yr)
Raw material price volatility ~(−5%) Global Short-term (≤2 yr)
Regulatory fragmentation across jurisdictions ~(−4%) Emerging markets Medium-term (2–4 yr)
Contamination recalls and reputational risk ~(−3%) North America, Europe Short-term (≤2 yr)
Declining birth rates in developed economies ~(−5%) Europe, East Asia Long-term (≥4 yr)


Breastfeeding Advocacy and Regulatory Restrictions

The WHO's International Code of Marketing of Breast-milk Substitutes, reinforced by the 2024 World Health Assembly resolution, restricts advertising of infant formulas for children under 12 months across 136 signatory nations [10]. Countries including the Philippines, Pakistan, and several African nations have enacted strict marketing bans that limit brand visibility and promotional spending, directly constraining the addressable Infant Nutrition Market in high-birth-rate geographies.

Commodity Price Exposure

Dairy protein concentrates, whey permeate, and vegetable oils constitute 45–55% of infant formula production costs. Global dairy commodity indices rose 22% between Q1 2023 and Q3 2024, squeezing manufacturer margins and forcing selective price increases that risk volume erosion in price-sensitive markets such as India and Nigeria [11]. Palm oil supply disruptions linked to Indonesian export levies added further cost pressure during 2023–2024.

Demographic Headwinds in Mature Markets

Total fertility rates in Japan (1.20), South Korea (0.72), and several European nations have fallen below replacement levels, structurally capping volume growth in these markets [13]. While premiumization partially offsets unit declines through higher average selling prices, the overall addressable population of infants is contracting in these regions, redirecting growth toward emerging economies with healthier demographic profiles.


Infant Nutrition Market Opportunities

Personalized Nutrition and AI-Driven Product Matching

Machine-learning platforms analyzing infant gut microbiome data are beginning to inform formula recommendations tailored to individual digestive profiles. Startups in the U.S. and Israel raised over USD 350 million in 2024 for microbiome-based pediatric nutrition solutions [14]. This personalization trend creates a premium sub-segment within the Infant Nutrition Market that could command 20–30% price premiums over standard products.

Emerging Market Penetration in Sub-Saharan Africa

Sub-Saharan Africa's infant population is projected to exceed 45 million annually by 2030, yet organized infant nutrition penetration remains below 15% in most countries [15]. Government-NGO partnership models, such as the African Union's Africa CDC Nutrition Initiative, are establishing distribution frameworks that can be leveraged by commercial players to extend reach into peri-urban and rural zones.

Plant-Based and Allergen-Free Formulations

Approximately 3–5% of infants globally exhibit cow's milk protein allergy, and parental demand for plant-based alternatives is growing across North America and Europe [16]. Soy-free, rice-protein, and oat-based formulations represent an underpenetrated niche where innovation can capture health-conscious consumers willing to pay premiums. Regulatory pathways for novel plant-based infant formulas are being formalized in the EU and Australia.

Data Monetization Through Connected Feeding Devices

Smart bottle and feeding-tracker devices, now in use by an estimated 2.5 million households globally, generate behavioral data on feeding frequency, volume, and timing. Manufacturers capable of integrating this data into their product development and personalization platforms can build recurring revenue streams and deepen consumer relationships beyond the transactional purchase cycle.

Clean-Label and Transparency-First Branding

Consumer surveys in 2024 indicated that 68% of millennial and Gen-Z parents rank ingredient transparency as their top purchase criterion [9]. Brands investing in blockchain-verified sourcing, QR-code-accessible supply chain information, and third-party certification (USDA Organic, EU Organic, Non-GMO Project) can differentiate meaningfully in a market where trust directly translates to pricing power.


Infant Nutrition Market Future Outlook

Precision Nutrition and Microbiome-Informed Products

By 2030, gut microbiome sequencing costs are expected to fall below USD 50 per test, making individualized nutrition profiling economically viable for mass-market infant products [14]. Brands that integrate microbiome data into formulation R&D and consumer-facing recommendation engines will capture a disproportionate share in the premium tier of the Infant Nutrition Market.

Sustainability-Driven Supply Chain Transformation

The infant nutrition sector consumes approximately 12% of global dairy whey production. As ESG reporting requirements expand under frameworks such as the EU Corporate Sustainability Reporting Directive (CSRD), manufacturers face pressure to reduce carbon intensity per unit of product by 30–40% before 2030 [18]. Regenerative dairy farming partnerships and alternative protein sourcing will reshape cost structures and brand positioning.

Digital-First Parenting Ecosystems

Connected parenting platforms — integrating telehealth, feeding tracking, milestone monitoring, and product purchasing — are creating closed-loop ecosystems where infant nutrition brands can embed their products within daily parental routines. An estimated 35% of first-time parents in developed markets used at least one connected feeding device in 2024. The Infant Nutrition Market will increasingly reward companies that own the consumer relationship beyond the retail shelf.

Regulatory Convergence and Global Trade Facilitation

APEC and WTO-led harmonization initiatives targeting infant food safety standards could reduce non-tariff trade barriers by up to 20% across participating nations by 2032 [19]. Mutual recognition agreements between the EU and Australia/New Zealand already serve as templates for broader alignment. This convergence will facilitate cross-border supply chains, lower compliance costs for multinational players, and expand consumer access to diverse product portfolios.


Infant Nutrition Market Segmentation

By Product Category

Segment Key Metric Primary Demand Driver
Infant Formula 50.1% share (2025) Nutritional completeness for non-breastfed infants
Baby Cereals USD 8.41 Billion (2025) First-food introduction; fortification with iron/zinc
Prepared Baby Food 8.5% CAGR (2026–2035) Convenience for time-constrained parents
Snacks & Finger Foods USD 4.15 Billion (2025) Self-feeding development; on-the-go consumption


Infant formula remains the cornerstone of the Infant Nutrition Market, accounting for just over half of total revenue. Growth in this segment is driven by continued formulation upgrades — particularly the incorporation of HMOs and lactoferrin — that narrow the compositional gap with breast milk. Prepared baby food is gaining ground rapidly as parents in urban Asia-Pacific and Latin American markets favor pouched and jarred options that eliminate preparation time without sacrificing nutritional integrity.

By Age Group

Segment Key Metric Primary Demand Driver
0–6 Months (Stage 1) 42.2% share (2025) Exclusive formula feeding; supplementation
6–12 Months (Stage 2) USD 13.78 Billion (2025) Complementary feeding initiation
12–24 Months (Stage 3) 6.8% CAGR (2026–2035) Growing-up milk category expansion
24–36 Months 9.0% CAGR (2026–2035) Extended nutrition supplementation trends


The 0–6 months segment dominates the Infant Nutrition Market by value, reflecting the critical nutritional dependency of early-stage infants. The 24–36 months cohort is the fastest-growing age bracket, propelled by the expanding "toddler milk" category and parental concern about micronutrient adequacy during the transition to family foods.

By Formula Form

Segment Key Metric Primary Demand Driver
Powder 63.3% share (2025) Cost efficiency; shelf stability; global availability
Liquid Concentrate USD 4.69 Billion (2025) Convenience; moderate price point
Ready-to-Feed 10.7% CAGR (2026–2035) Maximum convenience; sterile format


Powder dominates globally due to its favorable economics and extended shelf life. Ready-to-feed formats are experiencing the fastest growth, particularly in North America and Western Europe, where willingness to pay for sterile, zero-preparation feeding solutions aligns with on-the-go parenting lifestyles.

By Nature

Segment Key Metric Primary Demand Driver
Conventional 57.3% share (2025) Broad accessibility; established brand loyalty
Organic 10.0% CAGR (2026–2035) Clean-label demand; certified ingredient sourcing
Clean Label / No Added Sugars & Additives USD 5.86 Billion (2025) Health-conscious parenting; transparency trends


Conventional products retain the majority of the Infant Nutrition Market, but organic and clean-label alternatives are eroding that share at a meaningful pace. Organic infant nutrition is projected to grow at 10.0% CAGR, outpacing the overall market by nearly 3 percentage points, as parents increasingly treat certification labels as proxies for safety and quality [9].

By Distribution Channel

Segment Key Metric Primary Demand Driver
Supermarkets / Hypermarkets 34.6% share (2025) One-stop shopping; in-store promotions
Pharmacy / Drug Stores USD 10.45 Billion (2025) Trust association; pharmacist recommendations
Specialty Stores 5.4% CAGR (2026–2035) Curated assortments; expert advice
Online Retail 10.7% CAGR (2026–2035) Subscription models; cross-border access


Online retail is the fastest-expanding channel in the Infant Nutrition Market, driven by subscription box models, algorithm-driven product recommendations, and the ability to access imported brands unavailable in domestic physical retail. Supermarkets retain the largest share but face gradual erosion as digital-native millennial and Gen-Z parents shift purchasing online [7].


Regional Market Share Analysis

Region Key Metric Primary Investment Themes
Asia-Pacific 9.8% CAGR (2026–2035) Urban dual-income demand; cross-border e-commerce
North America 24.5% share (2025) Premium innovation; regulatory compliance
Europe USD 11.88 Billion (2025) Clean-label regulation; organic growth
South America 7.8% share (2025) Middle-class expansion; retail modernization
Middle East & Africa 7.4% CAGR (2026–2035) Government nutrition programs; distribution buildout
Total USD 53.26 Billion (2025)

The Infant Nutrition Market exhibits pronounced regional variation driven by demographic structures, regulatory environments, and income levels. Asia-Pacific's dominance reflects both population scale and rapid premiumization, while mature markets in North America and Europe sustain growth through value-driven product upgrades.


North America

Country Key Metric Key Driver
United States 78.2% of regional value FDA regulatory framework; DTC innovation
Canada 6.1% CAGR (2026–2035) Immigration-driven birth rate stability
Mexico USD 1.92 Billion (2025) Expanding middle class; modern trade growth


North America's Infant Nutrition Market benefits from high per-capita spending, averaging USD 1,450 per infant annually — among the highest globally. The 2022 formula shortage prompted legislative action, including the FORMULA Act, which diversified import pathways and accelerated FDA approval for European-manufactured formulas [12]. This regulatory opening is expected to sustain competitive dynamics and product diversity through 2035.

Europe

Country Key Metric Key Driver
Germany 22.4% of the regional value Scientific R&D cluster; export hub
United Kingdom 5.8% CAGR (2026–2035) Post-Brexit regulatory divergence
France USD 1.85 Billion (2025) Strong organic certification ecosystem
Italy 10.3% of regional value Domestic dairy supply chain integration
Spain 5.5% CAGR (2026–2035) Growing immigrant population demographics
Nordic Countries USD 0.94 Billion (2025) Sustainability-led purchasing behavior
Russia 8.1% of regional value Import substitution strategies
Rest of Europe 5.2% CAGR (2026–2035) EU harmonization; Eastern European expansion


The continent's rigorous regulatory architecture shapes the European Infant Nutrition Market. EU Delegated Regulation 2016/127, updated in 2024, mandates compositional limits on protein, added sugars, and specific micronutrient ratios [6]. Germany serves as both a manufacturing powerhouse and export hub, while France and the Netherlands lead in organic infant food innovation. Immigration-driven population inflows partially offset declining fertility rates across Southern and Eastern Europe.

Asia-Pacific

Country Key Metric Key Driver
China 38.5% of regional value Premiumization post-2008 safety reform
India 10.2% CAGR (2026–2035) Government nutrition programs; urbanization
Japan USD 3.12 Billion (2025) Ultra-premium positioning; aging demographics
South Korea 4.8% of regional value Low birth rate; high per-infant spending
ASEAN 8.9% CAGR (2026–2035) Rising middle class; modern retail expansion
Rest of Asia-Pacific 7.6% of regional value Australia and New Zealand export dynamics


Asia-Pacific dominates the global Infant Nutrition Market, with China alone representing over 38% of regional revenue. China's 2008 melamine crisis permanently shifted consumer preference toward imported premium brands, a structural change that persists today. India's POSHAN Abhiyaan (National Nutrition Mission), backed by USD 1.3 billion in government funding, is driving awareness of complementary feeding practices in rural communities [8]. Southeast Asian markets, particularly Vietnam and Indonesia, exhibit double-digit growth in organized infant nutrition retail channels.

South America

Country Key Metric Key Driver
Brazil 58.3% of regional value Largest population base; retail consolidation
Argentina 5.9% CAGR (2026–2035) Economic recovery; import normalization
Rest of South America USD 0.89 Billion (2025) Colombia, Chile and emerging demand


Brazil's extensive pharmacy and supermarket networks make it the gateway to the South American Infant Nutrition Market. Government programs such as Bolsa Família, which provide conditional cash transfers linked to child health checkups, indirectly support nutritional product adoption among lower-income families [15].

Middle East & Africa

Country Key Metric Key Driver
Saudi Arabia 28.7% of the regional value High per-capita income; expatriate demand
UAE 7.8% CAGR (2026–2035) Premium retail infrastructure
South Africa USD 0.54 Billion (2025) Largest organized retail in Sub-Saharan Africa
Egypt 8.6% CAGR (2026–2035) Population growth; urbanization
Rest of MEA 31.2% of regional value NGO-supported distribution expansion


The Middle East & Africa region presents a dual-speed Infant Nutrition Market. Gulf Cooperation Council states exhibit purchasing patterns comparable to European markets, while Sub-Saharan Africa remains dominated by informal channels and low product penetration. Egypt's population growth rate of 1.7% annually positions it as one of the fastest-growing national markets in the region [15].


Infant Nutrition Market By Region, 2025-2035

Competitive Benchmarking

Medium concentration in the Infant Nutrition Market. The top five players account for an estimated 52-58% of revenue globally. An estimated Herfindahl-Hirschman Index of about 850 to 1,000 suggests a moderately competitive organization. Significant barriers to entry exist in the form of scale advantages in dairy sourcing, regulatory compliance infrastructure and brand trust. Digital-native firms have successfully challenged incumbents in some premium categories.

Company Est. Revenue Share Range Key Offerings Strategic Positioning
Nestlé S.A. ~14–18% NAN, Gerber, Cerelac, Illuma Full-spectrum global leader; R&D depth
Danone S.A. ~10–14% Aptamil, Nutrilon, Cow & Gate Science-led differentiation; strong in Europe/Asia
Reckitt Benckiser (Mead Johnson) ~8–11% Enfamil, Enfinitas Pediatric clinical heritage; U.S. market strength
Abbott Laboratories ~7–10% Similac, PediaSure, EleCare Hospital channel dominance; specialty formulas
FrieslandCampina ~4–6% Friso, Fristi Integrated dairy supply chain; premium positioning
Hain Celestial Group ~2–4% Earth's Best Organic Organic-first brand identity; U.S. distribution
Perrigo Company ~3–5% Store-brand infant formula Private-label manufacturing scale
Hero Group ~2–3% Hero Baby, Semper European heritage; natural ingredient focus
HiPP GmbH ~2–3% HiPP Organic, HiPP Combiotic Organic pioneer; family-owned brand trust
Fonterra Co-operative ~2–4% Karicare, Anmum New Zealand dairy sourcing; Asia-Pacific exports


Recent News & Developments

  • Nestlé (2025): In late 2025, Nestlé initiated a precautionary voluntary recall of specific NAN formula batches in Europe and the Philippines due to the potential presence of Bacillus cereus bacteria.


  • FSSAI (India) (January 2025): Enacted revised infant food safety standards mandating maximum permissible limits for lead, arsenic, and cadmium in all commercially sold infant nutrition products [8].


Infant Nutrition Market Report Scope

Parameter Detail
Market Scope Global Infant Nutrition Market across product categories, age groups, formula forms, nature, and distribution channels
Study Period 2021–2035
CAGR 7.12% (2026–2035)
Market Size (2025) USD 53.26 Billion
Market Size (2035) USD 105.95 Billion
Fastest Growing Segment Online Retail (by distribution), Organic (by nature), Ready-to-Feed (by form)
Companies Profiled 10 major players, including Nestlé, Danone, Abbott, Reckitt, FrieslandCampina, and others
Valuation Currency USD Billion


FAQs

How does the Infant Nutrition Market address allergen-free product demand?
Brands are expanding hydrolyzed protein and amino acid-based formulas for the 3–5% of infants with confirmed cow's milk protein allergy. Regulatory pathways in the EU and U.S. now accelerate novel allergen-free product approvals [16].
What procurement factors should institutional buyers prioritize in the Infant Nutrition Market?
Institutional buyers should evaluate supplier compliance with Codex Alimentarius standards, supply chain redundancy, and traceability documentation. Shelf-life guarantees and cold-chain capabilities are critical for ready-to-feed formats [6].
How are private-label brands reshaping the Infant Nutrition Market?
Private-label formulas now capture 12–15% of U.S. volume, offering 25–40% cost savings versus branded equivalents. FDA compositional equivalence requirements ensure comparable nutritional profiles [12].
What role does blockchain play in infant nutrition supply chains?
Blockchain enables end-to-end ingredient traceability from dairy farm to retail shelf. Several European manufacturers use distributed ledger systems to verify organic certification and sourcing origin in real time [18].
How do Infant Nutrition Market dynamics differ between urban and rural consumers?
Urban consumers prioritize premium, science-backed formulations, while rural buyers favor affordability and availability. Government subsidy programs increasingly bridge this gap in India and Brazil [8].
What is the impact of precision fermentation on the Infant Nutrition Market cost structures?
Precision fermentation can reduce key ingredient costs by 15–20% at scale by producing bioidentical lactoferrin and casein without dairy farming inputs. Commercialization is expected by 2028–2029 [14].
How do cross-border e-commerce regulations affect the Infant Nutrition Market?
Customs duties, labeling re-certification, and import safety testing create 8–12 week lead times for cross-border shipments. APEC harmonization efforts aim to reduce these barriers by 2032 [19].    
Author
Author
Author Profile
Snehal Singh LinkedIn
Manager - Research
High acumen in analyzing complex macro & micro markets with more than 6 years of work experience in the field of market research. By implementing her analytical skills in forecasting and estimation into market research reports, she has expertise in Packaging, Construction, and Equipment domains. She handles a team size of 20-25 resources and ensures smooth running of the projects, associated marketing activities, and client servicing.

Research Approach


Secondary Research

The secondary research process involved comprehensive analysis of regulatory databases, peer-reviewed medical and nutritional journals, clinical publications, and authoritative health organizations. Key sources included the US Food & Drug Administration (FDA) Center for Food Safety and Applied Nutrition, European Food Safety Authority (EFSA), Codex Alimentarius Commission (CAC) of FAO/WHO, European Commission Directorate-General for Health and Food Safety (DG SANTE), US Department of Agriculture (USDA) Economic Research Service and Food and Nutrition Service, Centers for Disease Control and Prevention (CDC) National Center for Health Statistics, National Institutes of Health (NIH) National Institute of Child Health and Human Development, National Center for Biotechnology Information (NCBI/PubMed), World Health Organization (WHO) Global Nutrition Targets and Global Health Observatory, UNICEF Global Infant Feeding Database, EU Eurostat Population and Health Statistics, World Bank Health, Nutrition and Population Statistics, China National Health Commission (NHC), Food Standards Australia New Zealand (FSANZ), Health Canada Food Directorate, National Institute of Nutrition (NIN) India, Brazilian Health Regulatory Agency (ANVISA), and national health ministry reports from key markets including birth statistics, breastfeeding prevalence surveys, and regulatory frameworks governing infant formula composition, labeling, and marketing.

Birth rate statistics, breastfeeding initiation and duration data, clinical safety and efficacy studies, regulatory approval data for novel ingredients (HMOs, probiotics, prebiotics), demographic trends, and competitive landscape analysis for infant formula, baby foods, and breastfeeding accessories across standard, organic, and specialty nutrition categories were all gathered from these sources.


Primary Research

In order to gather both qualitative and quantitative insights, supply-side and demand-side stakeholders were interviewed during the primary research process. CEOs, VPs of Product Development and Innovation, Chief Scientific Officers, heads of regulatory affairs, and commercial directors from baby feeding manufacturers, suppliers of ingredients (HMO, probiotics, DHA/ARA), and contract manufacturers/OEMs were examples of supply-side sources. Board-certified pediatricians, neonatologists, registered dietitians and nutritionists with expertise in maternal and child health, lactation consultants, hospital procurement managers, retail pharmacy directors, supermarket category managers for baby products, and e-commerce platform merchandising leads with expertise in mother and baby categories were among the demand-side sources. Primary research obtained information on clinical adoption patterns, prescription-to-switch dynamics, pricing strategies, reimbursement schemes, and distribution channel evolution. It also validated market segmentation across product types (infant formula, baby foods, breastfeeding accessories), formulation types (powder, liquid, ready-to-feed), and nutritional requirements (standard, organic, specialty).

Primary Respondent Breakdown:

By Designation: C-level Executives (41%), Director Level (31%), Others (28%)

By Region: North America (32%), Europe (25%), Asia-Pacific (34%), Rest of World (9%)


Market Size Estimation

Revenue mapping, production volume analysis, and consumption pattern evaluation were used to determine the global market valuation. The methodology comprised:

Finding more than fifty-five major producers and suppliers of ingredients in North America, Europe, Asia-Pacific, Latin America, the Middle East, and Africa

Product mapping for baby meals (cereals, purees, snacks), breastfeeding accessories (pumps, bottles, nipples, storage systems), and infant formula (standard, specialist, organic)

Examination of reported and projected yearly income for infant feeding portfolios, taking into consideration regional pricing differences and segment-specific gross margins

Coverage of producers accounting for 75–80% of the world market in 2024

Extrapolation of segment-specific valuations utilizing top-down (manufacturer revenue validation, trade flow analysis) and bottom-up (birth rates × breastfeeding cessation rates × formula consumption per infant × ASP by country/region) methods

Download Free Sample

Kindly complete the form below to receive a free sample of this Report

Download PDF ×

We do not share your information with anyone. However, we may send you emails based on your report interest from time to time. You may contact us at any time to opt-out.
















