Interactive Kiosk Market (2026 - 2035)

Interactive Kiosk Market Size, Share and Research Report By Type (ATM Kiosks, Information Kiosks, Ticketing Kiosks, Other Kiosks (Check-in, Vending, Photo)), By Component (Hardware, Software, Services), By Deployment (Indoor Kiosks, Outdoor Kiosks), By End-User Industry (Retail, BFSI, Healthcare, Transportation & Logistics, Government, Hospitality & Entertainment) and By Region (North America, Europe, Asia-Pacific, South America, Middle East & Africa) – Industry Forecast to 2035.
ID: MRFR/SEM/3127-HCR
200 Pages
Nirmit Biswas, Aarti Dhapte
Last Updated: July 10, 2026
Interactive Kiosk Market
Market Size
Forecast Period2026-2035
CAGR (2026-2035)4.68%
2025 Market SizeUSD 38.70 billion
2035 Market SizeUSD 61.15 billion
Key Players
NCR Voyix
Diebold Nixdorf
KIOSK Information Systems
Elo Touch Solutions
Meridian Kiosks
Olea Kiosks
Opportunities
  • AI-Powered Personalization and Upselling Engines
  • Telehealth and Remote Diagnostic Kiosks
  • Emerging-Market Government Services Digitization

Interactive Kiosk Market Summary

The Interactive Kiosk Market reached USD 38.70 billion in 2025 and is projected to grow from USD 40.51 billion in 2026 to USD 61.15 billion by 2035, registering a CAGR of 4.68% during the forecast period (2026–2035). Two catalysts anchor this trajectory: a post-pandemic shift toward contactless self-service infrastructure and aggressive government digitization mandates — the European Commission's Digital Decade program alone channels EUR 7.5 billion toward citizen-facing digital service points by 2030 [1]. Retail chains, airports, and municipal service centers are replacing staffed counters with intelligent terminals at a pace not seen in the previous decade.

The technology transition of the Interactive Kiosk Market is the shift away from old resistive-touch, single-function hardware to modular, cloud-connected platforms driven by energy-efficient ARM processors. Multi-service capabilities such as bill payment, identity verification and telehealth intake are adding to the industry’s backbone of traditional ATM deployments. It is predicted that U.S. banking institutions invested USD 2.1 billion in next-generation branch automation alone in 2024, indicating that hardware refresh cycles are getting shorter [2].


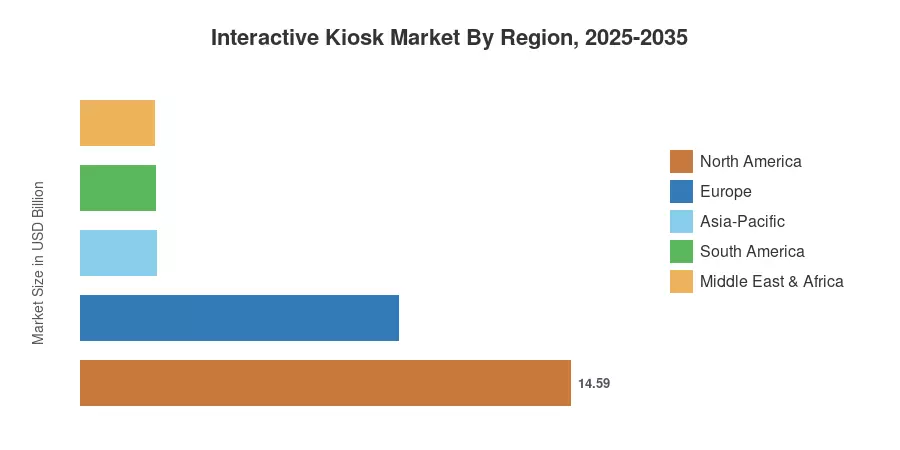
North America held the highest share of 37.70% of the Interactive Kiosk Market in 2025 due to the developed retail and BFSI ecosystems. Asia-Pacific is the fastest-growing market with a CAGR of 5.86%, driven by the smart-city projects in China, India, and ASEAN countries. The second largest is Europe, with around 24.50%, where the transit authority modernization and healthcare digitization are driving uptake. Over the next decade, emerging markets in the Middle East and South America will scale digital governance programs, closing the deployment gap.


Key Report Takeaways

• By Type

  • ATM kiosks captured 34.10% of the Interactive Kiosk Market in 2025, reflecting sustained demand from banking branch transformation programs.
  • Ticketing kiosks are forecast to grow at a 5.58% CAGR through 2035, propelled by transit modernization and live-event venue upgrades.

• By Component

  • Hardware accounted for 59.40% of the Interactive Kiosk Market in 2025, though the software-and-services mix is gaining ground rapidly.
  • Managed services are advancing at a 4.88% CAGR as fleet operators shift from CAPEX to OPEX models.

• By Geography

  • North America led the Interactive Kiosk Market with 37.70% revenue share, anchored by the United States' retail and financial sectors.
  • Asia-Pacific is on track for a 5.86% CAGR, with China and India accounting for the bulk of new installations.

Market Size and Forecast (2021–2035)

Market Research Future (MRFR) applies a sizing technique that includes bottom-up tracking of hardware shipments, analysis of software licensing revenues, and data from managed-service contracts for 42 nations. Historical figures (2021-2024) are derived from verified corporate filings and customs-trade databases. Forecast estimations (2026-2035) are derived from scenario-weighted CAGR modeling, cross-verified with macroeconomic data and regional deployment pipelines.
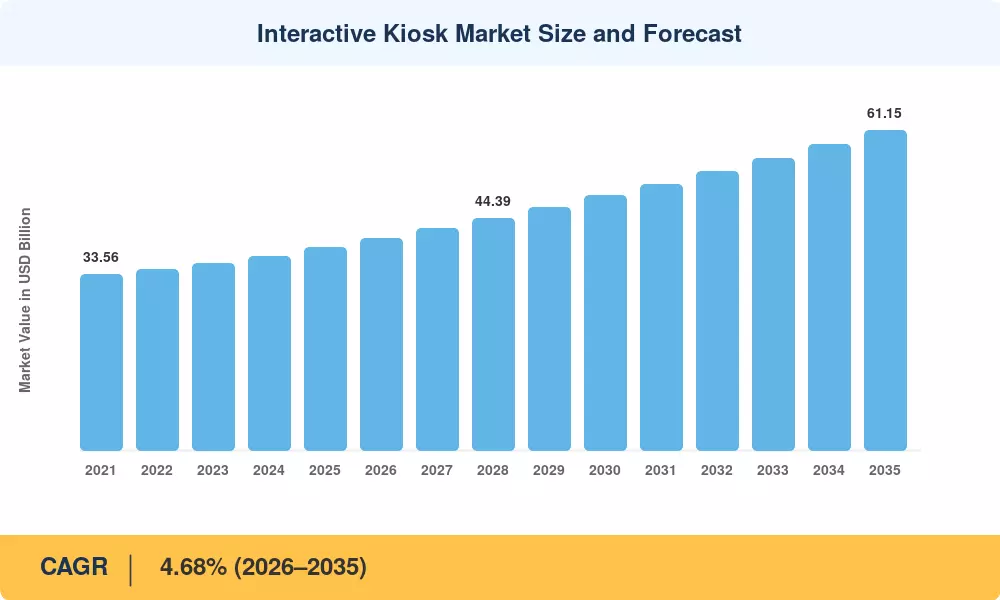
Interactive Kiosk Market Size and Forecast
Our Impact
Enabled $4.3B Revenue Impact for Fortune 500 and Leading Multinationals
Partnering with 2000+ Global Organizations Each Year
30K+ Citations by Top-Tier Firms in the Industry

Driver Impact Analysis

Driver ~% Impact on CAGR Geographic Relevance Impact Timeline
Retail self-service & checkout automation ~18% Global Short-term (≤2 yr)
Contactless and NFC payment mandates ~16% North America, Europe Short-term (≤2 yr)
Government digital service delivery programs ~15% Asia-Pacific, MEA Medium-term (2–4 yr)
Healthcare patient-intake digitization ~14% North America, Europe Medium-term (2–4 yr)
Smart-city wayfinding and transit ticketing ~13% Asia-Pacific, Europe Long-term (≥4 yr)
AI-driven personalization and analytics ~12% Global Long-term (≥4 yr)
Cloud-managed kiosk fleet platforms ~12% North America, APAC Medium-term (2–4 yr)


Retail Self-Service and Checkout Automation

Major grocery and convenience chains are replacing traditional checkout lanes with self-service kiosk clusters at a rate that reshapes store economics. Walmart's 2024 announcement to deploy 8,500 additional self-checkout units across U.S. locations — representing an estimated USD 680 Million capital commitment — illustrates the scale of investment flowing into the Interactive Kiosk Market from retail alone [4]. Labor-cost pressures, combined with consumer preference for speed, create a self-reinforcing cycle: once a flagship store converts, franchisees and competitors follow within 12–18 months.

Contactless and NFC Payment Mandates

The European Payment Services Directive (PSD3), expected to be finalized in 2026, mandates interoperable contactless acceptance across all public-facing transaction terminals, which directly stimulates kiosk hardware refresh cycles [7]. In North America, Visa and Mastercard's contactless-first roadmaps are pushing operators to retrofit or replace legacy magnetic-stripe units. Combined, these regulatory and network mandates affect an estimated 4.2 million kiosk terminals globally, generating a replacement demand wave through 2029.

Government Digital Service Delivery

India's Common Service Centre (CSC) network surpassed 530,000 digital access points in 2024, many of which incorporate interactive kiosk terminals for benefit disbursement, identity enrollment, and utility payments [5]. Similar programs in Saudi Arabia's Vision 2030 and Indonesia's Satu Data initiative are channeling public-sector budgets toward citizen-facing kiosk installations, extending the Interactive Kiosk Market's addressable base into regions that previously relied on manual service windows.

Healthcare Patient-Intake Digitization

U.S. hospital systems processed an estimated 38% of patient check-ins via kiosk or tablet terminals in 2024, up from 21% in 2020, according to HIMSS survey data [8]. The cost reduction is measurable: automated intake reduces front-desk staffing requirements by roughly 1.5 full-time equivalents per clinic location. As CMS reimbursement frameworks increasingly tie efficiency metrics to incentive payments, healthcare providers view kiosk deployment as both an operational and a financial imperative for the Interactive Kiosk Market.

Restraints Impact Analysis

Restraint ~% Drag on CAGR Geographic Relevance Impact Timeline
High maintenance costs of outdoor installations ~–20% Global Ongoing
Cybersecurity and data-privacy compliance burden ~–18% North America, Europe Medium-term
Component supply-chain volatility ~–15% Global Short-term
Accessibility and ADA/EAA compliance costs ~–12% North America, Europe Medium-term
Consumer resistance in low-digital-literacy regions ~–10% South America, MEA, rural APAC Long-term


High Maintenance Cost of Outdoor Installations

Outdoor kiosks face environmental stressors — temperature extremes, moisture ingress, vandalism — that inflate the total cost of ownership by 35–50% compared to indoor units [12]. A 2024 assessment estimated average annual maintenance costs for outdoor interactive kiosks at USD 3,200 per unit versus USD 1,900 for indoor counterparts. This cost differential discourages deployment in price-sensitive municipal applications and limits the Interactive Kiosk Market's penetration in emerging economies where maintenance infrastructure is thin.

Cybersecurity and Data-Privacy Compliance

Kiosks that process personal data — healthcare intake, banking transactions, government IDs — must comply with GDPR, CCPA, and sector-specific regulations like HIPAA. Compliance auditing, encryption upgrades, and penetration-testing cycles add an estimated 8–12% to per-unit software costs annually [13]. For mid-sized operators managing 500–2,000 units, this translates to USD 1.2–2.8 Million in recurring compliance spend, a burden that consolidates the market toward larger players and constrains new entrants in the Interactive Kiosk Market.

Component Supply-Chain Volatility

Touchscreen panel and semiconductor shortages during 2021–2023 extended lead times from 8 weeks to 22 weeks for certain kiosk OEMs [14]. Although supply has stabilized, geopolitical tensions around Taiwan-sourced display drivers and Chinese rare-earth export controls introduce persistent uncertainty, causing operators to hold larger safety stocks and pushing up working-capital requirements across the Interactive Kiosk Market.

Interactive Kiosk Market Opportunities

AI-Powered Personalization and Upselling Engines

Interactive kiosks equipped with computer vision and natural-language processing can tailor menu displays, product recommendations, and promotional offers in real time. Quick-service restaurant trials show a 12–18% average ticket uplift when kiosks deploy AI-driven suggestive selling [10]. This revenue-enhancement capability converts the kiosk from a cost-reduction tool into a profit center, fundamentally altering the ROI calculus for operators evaluating the Interactive Kiosk Market.

Telehealth and Remote Diagnostic Kiosks

Rural and underserved communities represent a greenfield opportunity for kiosks integrated with vital-sign monitoring peripherals — blood-pressure cuffs, pulse oximeters, dermatoscopes — connected to remote physicians via video link. The U.S. HRSA allocated USD 90 million in 2024 for telehealth infrastructure in Federally Qualified Health Centers, a portion of which targets kiosk-based delivery models [8]. This opens a new vertical for the Interactive Kiosk Market beyond traditional check-in functions.

Emerging-Market Government Services Digitization

Countries in the Middle East, Southeast Asia, and Sub-Saharan Africa are fast-tracking e-governance platforms that rely on citizen-facing kiosk terminals for ID enrollment, tax filing, and subsidy disbursement. Saudi Arabia's Absher platform and the UAE's Smart Government initiative collectively plan to add over 6,000 service kiosks by 2028 [17]. This geographic gap represents one of the highest-growth pockets within the Interactive Kiosk Market.

Data Monetization through Kiosk Analytics Platforms

Aggregated, anonymized foot-traffic and interaction data captured by kiosk networks hold value for real-estate developers, advertisers, and urban planners. Operators who build analytics dashboards atop their fleet management platforms can unlock a recurring SaaS revenue stream independent of hardware sales, diversifying their business model within the Interactive Kiosk Market.

Outdoor Ruggedized Kiosks for Smart-City Infrastructure

Outdoor deployment — currently 33.50% of revenue — is expanding as fanless enclosures, sunlight-readable displays, and IP65-rated designs reduce failure rates. Smart-city transit hubs, parking management, and EV-charging payment stations represent untapped verticals where outdoor kiosks can integrate multiple municipal services into a single terminal.

Interactive Kiosk Market Future Outlook

AI-Autonomous Kiosk Operations

By 2030, the Interactive Kiosk Market will see a majority of new deployments ship with embedded edge-AI processors capable of running computer-vision, voice-recognition, and predictive-maintenance models locally, reducing cloud-latency dependency. projects that 65% of enterprise kiosk fleets will incorporate some form of autonomous fault detection by 2032, cutting unplanned downtime by up to 40% [10].

Platform Economics and Kiosk-as-a-Service

The shift from outright hardware purchase to subscription-based Kiosk-as-a-Service (KaaS) models is restructuring the competitive landscape of the Interactive Kiosk Market. KaaS bundles hardware, software, connectivity, and maintenance into a per-unit monthly fee, lowering the barrier to entry for small retailers and municipal agencies. BloombergNEF estimates that KaaS contracts will represent 30% of new kiosk deployments globally by 2029 [21].

Sustainability and Circular-Economy Design

ESG reporting requirements under the EU's Corporate Sustainability Reporting Directive (CSRD) are pushing Interactive Kiosk Market manufacturers toward modular, repairable designs with standardized component interfaces. Lifecycle-extension strategies — field-swappable displays, upgradable compute modules — reduce e-waste and lower total cost of ownership, creating a competitive advantage for vendors who embrace circular-economy principles [22].

Biometric Identity and Digital-Wallet Convergence

The convergence of biometric authentication (facial recognition, palm-vein scanning) with digital-wallet platforms will redefine the Interactive Kiosk Market's transaction layer by 2033. Mastercard's biometric checkout program, piloting in five countries as of 2025, eliminates physical card and phone requirements entirely, creating frictionless kiosk interactions that could accelerate adoption in high-throughput environments like stadiums and airports [23].

Interactive Kiosk Market Segmentation

By Type

Segment Key Metric Primary Demand Driver
ATM Kiosks 34.10% share (2025) Banking branch transformation
Information Kiosks USD 7.35 billion (2025) Wayfinding and digital directories
Ticketing Kiosks 5.58% CAGR Transit and event-venue modernization
Other Kiosks (check-in, vending, photo) USD 5.82 billion (2025) Healthcare intake, retail returns


ATM kiosks remain the single largest type within the Interactive Kiosk Market, although their dominance is gradually eroding as banks consolidate physical footprints and migrate routine transactions to mobile channels. The segment's staying power lies in its evolution toward multi-function terminals that combine cash dispensing with account opening, loan applications, and video-banker access. Financial institutions view these upgraded ATM kiosks as a cost-effective alternative to staffed teller windows, preserving physical presence while reducing per-transaction costs by 55–70% [2].

Ticketing kiosks represent the fastest-growing type segment in the Interactive Kiosk Market. Transit authorities in London, Singapore, and Tokyo are replacing legacy magnetic-card dispensers with contactless-enabled touchscreen terminals that also display real-time route information. Live-entertainment venues are similarly adopting will-call kiosks that scan mobile barcodes and print wristbands, reducing lobby congestion by an estimated 35% at major arenas [9].

By Component

Segment Key Metric Primary Demand Driver
Hardware 59.40% share (2025) New installations and refresh cycles
Software 4.72% CAGR Cloud CMS and analytics platforms
Services 4.88% CAGR Managed services and maintenance contracts


Hardware continues to dominate the Interactive Kiosk Market's component mix, driven by the sheer volume of new installations in retail, transit, and government verticals. Display panels, enclosures, and payment peripherals account for the majority of hardware revenue. The software segment is gaining momentum as operators invest in cloud-based content management systems (CMS) that enable centralized fleet control across thousands of terminals. Services — including installation, remote monitoring, and field repair — are transitioning to managed-service agreements that generate predictable recurring revenue for integrators.

By Deployment

Segment Key Metric Primary Demand Driver
Indoor Kiosks 66.50% share (2025) Retail, banking and healthcare lobbies
Outdoor Kiosks 6.48% CAGR Transit hubs, smart-city infrastructure


Indoor units dominate the Interactive Kiosk Market due to lower installation complexity and reduced maintenance requirements. Outdoor kiosks, while smaller in absolute terms, are the faster-growing deployment segment, propelled by smart-city wayfinding programs and the proliferation of EV-charging payment terminals that require weather-resistant, vandal-proof enclosures.

By End-User Industry

Segment Key Metric Primary Demand Driver
Retail 33.90% share (2025) Self-checkout and product-catalog browsing
BFSI USD 8.52 billion (2025) ATM modernization and branch automation
Healthcare 6.28% CAGR Patient check-in and telehealth intake
Transportation & Logistics 5.40% CAGR Ticketing and wayfinding
Government USD 3.10 billion (2025) Citizen services digitization
Hospitality & Entertainment 4.95% CAGR Hotel check-in and venue ticketing


Retail leads the Interactive Kiosk Market's end-user landscape by a wide margin. Self-checkout kiosks, price-check stations, and endless-aisle catalog terminals collectively account for the segment's dominance. Healthcare is the fastest-growing end-user vertical, as hospitals and ambulatory clinics deploy patient-intake kiosks that verify insurance eligibility, collect copayments, and update medical histories — workflows that previously required 8–12 minutes of staff time per patient visit [8].

Regional Market Share Analysis

Region Key Metric (2025) Primary Investment Themes
North America 37.70% share Retail automation, banking branch transformation
Europe 24.50% share Transit ticketing, healthcare digitization
Asia-Pacific 5.86% CAGR (2026–2035) Smart-city programs, government kiosks
South America USD 2.24 billion Banking inclusion, retail modernization
Middle East & Africa USD 2.21 billion E-governance, tourism wayfinding
Total USD 38.70 billion

The Interactive Kiosk Market exhibits a clear geographic hierarchy, with North America and Asia-Pacific collectively accounting for over 64% of global revenue.


North America

Country Key Metric Key Driver
United States 78.40% of regional share Retail self-checkout and banking kiosks
Canada 12.80% of regional share Airport and transit authority modernization
Mexico 8.80% of regional share BFSI inclusion and retail expansion


The U.S. dominates the Interactive Kiosk Market in North America through a combination of mature retail infrastructure and regulatory push toward ADA-compliant digital interfaces. Canada's federal investment of CAD 320 million into airport passenger-processing technology between 2023 and 2027 is generating a concentrated deployment wave for check-in and border-control kiosks [18]. Mexico's growing modern-retail footprint — led by OXXO's 21,000+ convenience outlets — creates an expanding base for self-service payment terminals.

Europe

Country Key Metric Key Driver
Germany 4.82% CAGR Industrial and transit kiosk integration
United Kingdom USD 2.08 billion NHS digital check-in rollout
France 16.30% of regional share Retail and hospitality automation
Italy 10.50% of regional share Tourism and cultural-venue ticketing
Spain 8.20% of regional share Banking branch consolidation
Nordic Countries 7.60% of regional share Smart-city leadership
Russia 5.10% of regional share Government service terminals
Rest of Europe 14.80% of regional share Varied public-sector programs


Europe's Interactive Kiosk Market benefits from strong regulatory frameworks mandating digital accessibility in public transport and healthcare. The UK's NHS deployed over 4,200 patient self-check-in terminals across England's hospital trusts during 2024, with plans to extend coverage to GP surgeries by 2028 [19]. Germany's Deutsche Bahn continues its EUR 420 million platform-modernization program that includes next-generation ticketing kiosks across 900 stations.

Asia-Pacific

Country Key Metric Key Driver
China 34.80% of regional share Transit, retail, and government kiosks
India 6.15% CAGR CSC network and banking inclusion
Japan USD 2.45 billion Convenience-store and vending integration
South Korea 5.92% CAGR QSR and unmanned-store adoption
ASEAN 14.60% of regional share Airport and smart-city deployments
Rest of Asia-Pacific 8.40% of regional share Tourism and hospitality terminals


Asia-Pacific is the fastest-growing theater within the Interactive Kiosk Market, driven by China's massive transit network expansion and India's financial-inclusion mandate. South Korea's rapid adoption of unmanned convenience stores — over 7,800 in operation by end-2024 — has turned the country into a test bed for fully automated retail kiosk ecosystems [20]. Japan's integration of kiosk functionality into its konbini (convenience store) ecosystem creates a unique hybrid deployment model.

South America

Country Key Metric Key Driver
Brazil 62.50% of regional share Banking kiosks and retail POS
Argentina 18.70% of regional share Financial services digitization
Rest of South America 18.80% of regional share Government service terminals


Brazil's Interactive Kiosk Market is anchored by the country's banking sector, where institutions like Banco do Brasil and Itaú Unibanco operate combined kiosk fleets exceeding 45,000 units for bill payment and account services. Argentina's Mercado Pago ecosystem is driving QR-enabled kiosk deployments in urban retail corridors, linking physical terminals to mobile-wallet infrastructure.

Middle East & Africa

Country Key Metric Key Driver
Saudi Arabia 28.50% of regional share Vision 2030 e-governance
UAE 24.30% of regional share Smart-government and tourism
South Africa 18.10% of regional share Banking and retail inclusion
Egypt 12.40% of regional share Government digitization
Rest of MEA 16.70% of regional share Airport and hospitality kiosks


The Middle East & Africa segment of the Interactive Kiosk Market is expanding on the back of ambitious national digitization strategies. The UAE's Smart Government program targets 100% digital service delivery by 2027, with interactive kiosk terminals serving as physical access points for residents who prefer in-person interactions over mobile apps [17]. South Africa's major banks are deploying kiosk terminals in underserved townships where full-service branches remain economically unviable.

Interactive Kiosk Market By Region, 2025-2035

Competitive Benchmarking

The Interactive Kiosk Market has a moderate level of concentration with an estimated top five share of 28-35% and an HHI below 600, suggesting a fragmented competitive landscape. Large ATM and POS incumbents face competition from niche kiosk OEMs, regional integrators and software-platform vendors. Differentiation is less and less about only hardware and more about managed-service capabilities, cloud analytics platforms and vertical-specific solution bundles.

Company Est. Revenue Share Range Key Offerings for the Interactive Kiosk Market Strategic Positioning
NCR Voyix ~7–10% Self-checkout, ATM, digital banking kiosks Full-stack retail and banking platform
Diebold Nixdorf ~6–9% ATM, cash-recycling, retail POS kiosks Banking-automation specialist
KIOSK Information Systems ~4–6% Custom kiosks, bill-pay, wayfinding U.S.-centric custom-design leader
Elo Touch Solutions ~3–5% Touchscreen hardware, POS terminals OEM touch-technology provider
Meridian Kiosks ~2–4% Indoor/outdoor custom enclosures Quick-turn custom manufacturing
Olea Kiosks ~2–4% Healthcare, government, retail kiosks Sector-focused design studio
GRGBanking ~3–5% ATMs, intelligent deposit machines Asia-Pacific banking hardware leader
Fujitsu ~3–5% Retail POS, palm-vein biometric terminals Biometric authentication integration
Advantech ~2–4% Industrial computing, kiosk platforms Embedded computing and IoT modules
Source Technologies (ST) ~1–3% Receipt printers, thermal kiosk components Component and peripheral specialist


Recent News & Developments


  • Diebold Nixdorf (March 2024): Launched the DN Series 200 ATM platform featuring a 15.6-inch touchscreen, contactless card reader, and cloud-native software stack designed for managed-service deployment models [25].


  • Fujitsu (September 2024): Introduced PalmSecure ID Login for kiosk terminals, enabling palm-vein biometric authentication for hospital patient check-in applications across Japan and the United Kingdom [8].
  • European Commission (January 2025): Published updated accessibility standards under the European Accessibility Act (EAA), requiring all public-facing Interactive Kiosk Market terminals in the EU to meet EN 301 549 compliance by June 2025 [15].


  • Olea Kiosks (August 2024): Unveiled a telehealth-ready kiosk with integrated vital-sign peripherals and HIPAA-compliant video-conferencing, targeting Federally Qualified Health Centers in the U.S. Interactive Kiosk Market [8].

Interactive Kiosk Market Report Scope

Parameter Detail
Market Scope Global Interactive Kiosk Market covering hardware, software, and services across indoor and outdoor deployments.
Study Period 2021–2035
CAGR 4.68% (2026–2035)
Base Year Market Size USD 38.70 billion (2025)
Forecast Endpoint USD 61.15 billion (2035)
Fastest Growing Segment Healthcare end-user (6.28% CAGR); Outdoor deployment (6.48% CAGR)
Companies Profiled NCR Voyix, Diebold Nixdorf, KIOSK Information Systems, Elo Touch Solutions, Meridian Kiosks, Olea Kiosks, GRGBanking, Fujitsu, Advantech, Source Technologies
Valuation Currency USD billion


FAQs

What total cost of ownership should a retailer expect per self-checkout kiosk unit annually?
A typical indoor self-checkout unit runs USD 18,000–25,000 in year-one costs (hardware, software license, installation) and USD 3,500–5,000 annually thereafter for maintenance and software updates [12]. Most retailers achieve payback within 14–20 months based on labor-savings offsets.
How does the kiosk procurement cycle differ between banking and retail verticals?
Banking kiosk procurement typically follows 12–18 month RFP cycles with stringent security certifications, while retail buyers often use 4–8 week purchase-order processes through distributor channels [2]. Retail deals close faster but tend to involve smaller per-unit configurations.
What interoperability standards should buyers evaluate when selecting a kiosk platform?
Prioritize platforms supporting OPOS/JavaPOS peripheral drivers, PCI PTS 6.x payment-security certification, and RESTful API integration with existing ERP and CRM systems [7]. These standards ensure peripheral compatibility and future upgrade flexibility.
How are kiosk operators addressing ADA and EAA accessibility compliance?
Operators are adopting height-adjustable pedestals, screen-reader audio jacks, and Braille-labeled keypads to meet ADA Section 508 and EU EN 301 549 requirements [15]. Non-compliance risks fines exceeding USD 75,000 per violation in the United States.
What edge-computing configurations are emerging for high-traffic kiosk deployments?
Leading deployments pair ARM-based system-on-module boards with 8–16 GB RAM and local NVMe storage, enabling real-time AI inference without cloud round-trips [10]. This reduces per-transaction latency to under 200 milliseconds even during network outages.
How do Kiosk-as-a-Service contracts typically structure pricing?
KaaS providers charge USD 250–600 per unit per month, bundling hardware, software, connectivity, and maintenance into a single operating-expense line item [21]. Contract terms range from 36 to 60 months with refresh options at the midpoint.
What cybersecurity frameworks are most relevant for unattended payment kiosks?
PCI DSS 4.0, NIST SP 800-53, and ISO 27001 form the primary compliance triad for payment-processing kiosks [13]. Operators should also implement tamper-detection sensors and encrypted boot sequences to mitigate physical-attack vectors.    
Author
Author
Author Profile
Nirmit Biswas LinkedIn
Senior Research Analyst
With 5+ years of expertise in Market Intelligence and Strategic Research, Nirmit Biswas specializes in ICT, Semiconductors, and BFSI. Backed by an MBA in Financial Services and a Computer Science foundation, Nirmit blends technical depth with business acumen. He has successfully led 100+ projects for global enterprises and startups, including Amazon, Cisco, L&T and Huawei, delivering market estimations, competitive benchmarking, and GTM strategies. His focus lies in transforming complex data into clear, actionable insights that drive growth, innovation, and investment decisions. Recognized for bridging engineering innovation with executive strategy, Nirmit helps businesses navigate dynamic markets with confidence.
Co-Author
Co-Author Profile
Aarti Dhapte LinkedIn
AVP - Research
A consulting professional focused on helping businesses navigate complex markets through structured research and strategic insights. I partner with clients to solve high-impact business problems across market entry strategy, competitive intelligence, and opportunity assessment. Over the course of my experience, I have led and contributed to 100+ market research and consulting engagements, delivering insights across multiple industries and geographies, and supporting strategic decisions linked to $500M+ market opportunities. My core expertise lies in building robust market sizing, forecasting, and commercial models (top-down and bottom-up), alongside deep-dive competitive and industry analysis. I have played a key role in shaping go-to-market strategies, investment cases, and growth roadmaps, enabling clients to make confident, data-backed decisions in dynamic markets.

Research Approach


Secondary Research

The secondary research approach included a thorough examination of regulatory databases, industry publications, technological standards, and authoritative governmental and non-governmental organizations.

Key sources included:

Regulatory & Standards Bodies:

US Federal Communications Commission (FCC) – Equipment authorization and telecommunications standards

European Telecommunications Standards Institute (ETSI) – Digital signage and kiosk communication protocols

International Organization for Standardization (ISO) – ISO 9241 (ergonomics of human-system interaction) and ISO 27001 (information security management)

National Institute of Standards and Technology (NIST) – Cybersecurity framework for connected devices

US Access Board – Section 508 accessibility standards for electronic and information technology

Government & Public Sector Sources:

US General Services Administration (GSA) – Federal procurement data and smart government initiatives

US Department of Transportation (DOT) – Intelligent Transportation Systems (ITS) deployment statistics

US Department of Health and Human Services (HHS) – Healthcare IT adoption and patient engagement technologies

EU Digital Strategy & European Commission – Digital transformation in public services

UK Department for Transport – Transport technology and passenger information systems

National e-Governance Division (NeGD), Ministry of Electronics & Information Technology, Government of India – Digital India kiosk deployments

Singapore Infocomm Media Development Authority (IMDA) – Smart Nation sensor and kiosk infrastructure

Industry & Trade Associations:

Self-Service Innovation Summit (SSIS) & Kiosk Marketplace Association

Digital Signage Federation (DSF)

Electronic Transactions Association (ETA) – Payment technology standards

International Association of Airport Executives (IAAE) – Airport self-service technology adoption

National Retail Federation (NRF) – Retail technology investment surveys

Hospitality Technology Next Generation (HTNG) – Hotel technology standards

Technology & Market Intelligence:

International Data Corporation (IDC) – Worldwide quarterly smart city spending guide

Gartner – Hype Cycle for Digital Workplace Applications and Smart City Technologies

Counterpoint Research – Point-of-sale and self-service terminal market tracking

Juniper Research – Contactless payment and interactive display forecasts

Academic & Research Institutions:

IEEE Xplore Digital Library – Human-computer interaction and touchscreen technology research

ACM Digital Library – Interactive display and ubiquitous computing studies

MIT Media Lab – Tangible media and interface design research

These resources were used to gather deployment statistics, regulatory compliance requirements, technology adoption trends, security standards, and competitive landscape analyses for information kiosks, ticketing systems, self-service terminals, and wayfinding solutions in retail, healthcare, hospitality, transportation, and education.


Primary Research

In the primary research process, supply-side and demand-side stakeholders were interviewed to

Download Free Sample

Kindly complete the form below to receive a free sample of this Report

Download PDF ×

We do not share your information with anyone. However, we may send you emails based on your report interest from time to time. You may contact us at any time to opt-out.

















