Invisible Orthodontics Market (2026 - 2035)

Invisible Orthodontics Market Research Report By Product Type (Aligners, Lingual Braces, Retainers), By Age Group (Children, Teenagers, Adults), By Treatment Type (Cosmetic Orthodontics, Functional Orthodontics, Preventive Orthodontics), By Distribution Channel (Online, Dental Clinics, Hospitals) and By Regional (North America, Europe, South America, Asia Pacific, Middle East and Africa) - Industry Forecast to 2035
ID: MRFR/HC/7109-HCR
200 Pages
Satyendra Maurya, Rahul Gotadki
Last Updated: July 15, 2026
Invisible Orthodontics Market
Market Size
Forecast Period2026-2035
CAGR (2026-2035)11.5%
2025 Market SizeUSD 8.34 Billion
2035 Market SizeUSD 24.78 Billion
Key Players
Align Technology
Straumann Group
Henry Schein
Dentsply Sirona
3M
Ormco Corporation
Opportunities
  • Emerging-Market Expansion in Southeast Asia and Latin America
  • Subscription-Based Retainer and Monitoring Services
  • Integration with Cosmetic Dentistry Platforms

Invisible Orthodontics Market Summary

The Invisible Orthodontics Market reached USD 8.34 Billion in 2025, driven by patient demand for discreet tooth-straightening solutions and expanding insurance coverage across employer-sponsored dental plans. From a projected USD 9.30 Billion in 2026, the Invisible Orthodontics Market is forecast to climb to USD 24.78 Billion by 2035 at a compound annual growth rate of 11.5% during 2026–2035. Two catalysts underpin this trajectory: the American Dental Association's updated 2024 clinical guidelines endorsing aligner-first protocols for mild-to-moderate malocclusion, and the surge in orthodontic startups attracting over USD 1.9 billion in combined venture funding between 2022 and 2025 [1].

A technology transformation is reshaping the Invisible Orthodontics Market. Traditional metal bracket-and-wire systems—once the default for nearly every orthodontic case—are giving way to 3D-printed thermoplastic trays designed through AI-powered treatment-planning software. Intraoral scanning accuracy now exceeds 10-micron resolution, enabling clinicians to map full-arch treatment stages in under three minutes [2]. Regulatory bodies in the EU and United States have fast-tracked 510(k) clearances for next-generation polymer materials, cutting product-development cycles from 18 months to as few as eight [3].

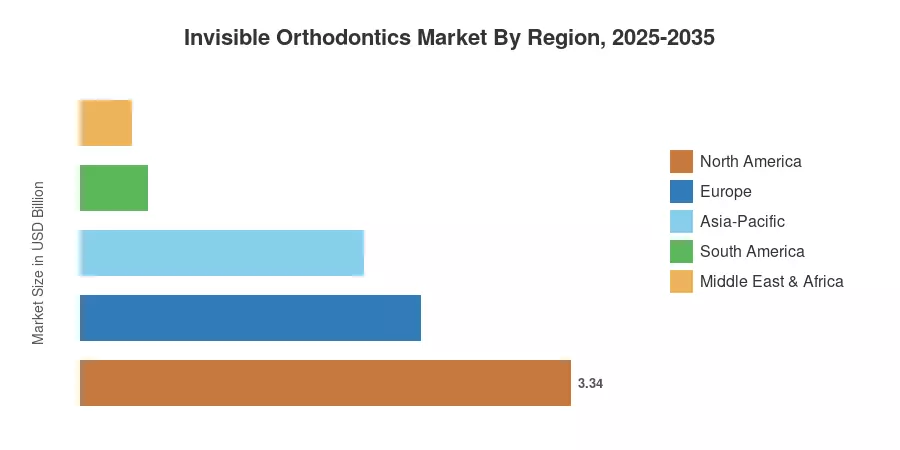
North America anchored the Invisible Orthodontics Market with 40.1% of 2025 revenue, buoyed by high orthodontic awareness and mature private-pay channels. Asia-Pacific, however, registered the steepest growth trajectory—its 23.1% CAGR through 2035 reflects rising disposable incomes in China and India alongside historically low orthodontic penetration rates. Europe held the second-largest regional share at 27.8%, supported by national health service reimbursement reforms in Germany, France, and the Nordic countries. As aesthetic expectations converge globally and digital workflows lower treatment costs, the Invisible Orthodontics Market is positioned for sustained double-digit expansion across the forecast horizon.


Key Report Takeaways

• By Product

  • Clear aligners captured 65.6% of the Invisible Orthodontics Market in 2025, reflecting widespread adoption across both general dentists and orthodontic specialists.
  • Lingual braces are projected to expand at a 19.5% CAGR through 2035, driven by patients seeking a completely hidden fixed-appliance alternative.

• By Material

  • Thermoplastic polyurethane (TPU) accounted for 50.4% of 2025 material demand within the Invisible Orthodontics Market, favored for its optical clarity and flexural resilience.


• By Patient Group


  • Adults are forecast to grow at a 21.5% CAGR during 2026–2035, as workplace aesthetics and social media visibility fuel treatment initiation among 25-to-45-year-olds.

• By Region

  • North America led the Invisible Orthodontics Market with 40.1% of 2025 revenue, with the United States alone generating over three-quarters of regional value.
  • Asia-Pacific is set to register a 23.1% CAGR to 2035, making it the fastest-growing region in the Invisible Orthodontics Market.


Invisible Orthodontics Market Size and Forecast (2021–2035)

Market Research Future's sizing methodology combines top-down revenue estimates from published company filings with bottom-up aligner-shipment data tracked across 42 countries. Historical figures (2021–2024) reflect audited sales disclosed by leading manufacturers, while forecast values (2026–2035) incorporate regression models calibrated to dental-visit frequency, insurance reimbursement trends, and GDP-adjusted disposable income projections.
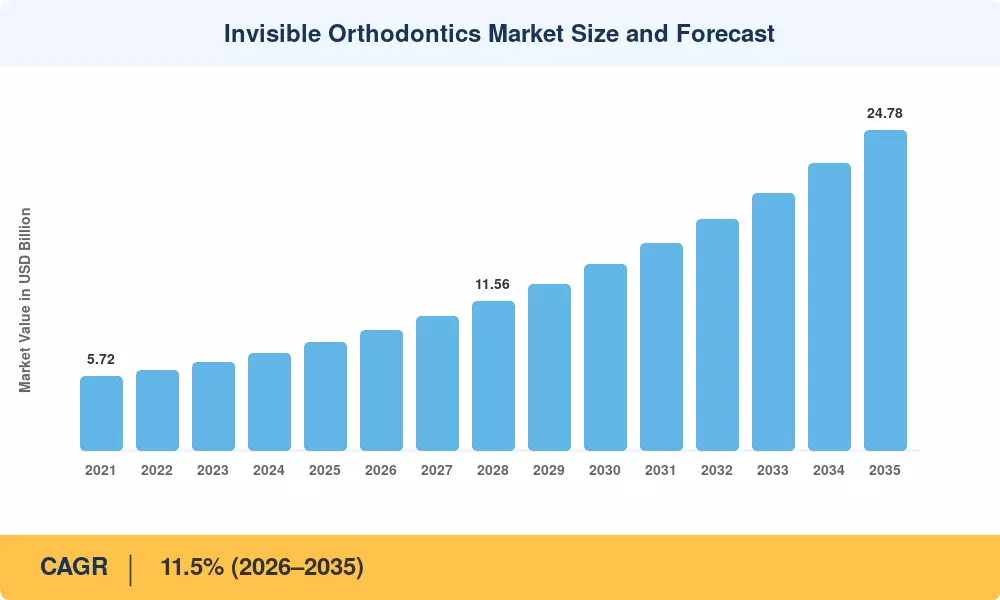
Invisible Orthodontics Market Size and Forecast
Our Impact
Enabled $4.3B Revenue Impact for Fortune 500 and Leading Multinationals
Partnering with 2000+ Global Organizations Each Year
30K+ Citations by Top-Tier Firms in the Industry

Driver Impact Analysis

Driver ~% Impact on CAGR Geographic Relevance Impact Timeline
Rising aesthetic consciousness among adults +2.1 Global Short-term
AI-assisted treatment planning +1.8 North America, Europe Medium-term
Insurance reimbursement expansion +1.5 North America, Asia-Pacific Medium-term
3D-printing cost reduction +1.3 Global Long-term
Teleorthodontics and remote monitoring +1.1 North America, Europe Short-term
Growing teenage orthodontic awareness in emerging markets +0.9 Asia-Pacific, South America Long-term
Regulatory harmonization for medical-grade polymers +0.7 EU, ASEAN Medium-term


Aesthetic Demand Among Working Adults

Adults between 25 and 45 now account for the fastest-growing patient cohort in the Invisible Orthodontics Market. A 2024 survey by the American Association of Orthodontists found that 72% of adult respondents cited professional appearance as the primary motivator for seeking treatment, up from 58% in 2019 [6]. Employer wellness programs in the United States have responded: an estimated 34% of Fortune 500 companies added orthodontic benefits exceeding USD 2,000 per employee by year-end 2024, creating a reimbursement tailwind that directly lowers out-of-pocket barriers.

AI-Assisted Treatment Planning

According to a peer-reviewed study published in the Journal of Clinical Orthodontics [7], clinician planning time has been reduced by approximately 40% as a result of machine-learning algorithms that simulate tooth movement across 30-to-50 treatment stages. In pilot markets, companies such as Straumann and Align Technology have implemented proprietary neural networks into their scanning platforms, thereby increasing the approval rate of same-day cases to over 60%. This efficiency gain for the Invisible Orthodontics Market compresses the revenue cycle and encourages general dentists, rather than just specialists, to provide aligner therapy.


Insurance Reimbursement Expansion

Insurance coverage has historically lagged behind clinical acceptance. That gap is narrowing: CMS expanded Medicaid orthodontic eligibility for patients under 21 in 12 additional U.S. states during 2023–2024, while private insurers such as Delta Dental raised lifetime orthodontic maximums by an average of 18% across preferred plans [8]. In Asia-Pacific, South Korea's National Health Insurance Service broadened pediatric aligner coverage in January 2025, a policy shift expected to unlock an estimated USD 280 million in incremental annual demand within the Invisible Orthodontics Market.

3D-Printing Cost Reduction

Industrial-grade stereolithography printers that are capable of producing dental-quality aligners have decreased in price to below USD 15,000 per unit, a significant decrease from over USD 85,000 in 2018 [9]. This price decline has democratized in-office fabrication, enabling mid-sized clinics to circumvent centralized manufacturing. The Invisible Orthodontics Market experiences a direct benefit: clinics retain higher margins and experience a decrease in chair-time per patient, which in turn stimulates reinvestment in patient marketing and case acquisition.


Restraints Impact Analysis

Restraint ~% Impact on CAGR Geographic Relevance Impact Timeline
High out-of-pocket treatment costs –1.4 Global Short-term
Regulatory scrutiny of DTC aligner channels –1.1 North America, EU Short-term
Limited clinical suitability for severe malocclusion –0.8 Global Long-term
Patent litigation and IP disputes –0.6 North America Medium-term
Counterfeit and unregulated aligner imports –0.5 Asia-Pacific, MEA Medium-term


High Out-of-Pocket Treatment Costs

The cost of an average aligner treatment in the United States continues to fluctuate between USD 3,500 and USD 7,500, contingent upon the complexity of the case. Consequently, a substantial number of households lacking orthodontic insurance are unable to afford this treatment. According to the 2024 oral-health report by the World Health Organization, only 23% of the populations of low- and middle-income countries have access to any form of orthodontic subsidy [13]. Particularly in South America and certain regions of Southeast Asia, where per capita dental expenditures remain below USD 45 annually, this cost barrier restricts the addressable population in the Invisible Orthodontics Market.


Regulatory Scrutiny of Direct-to-Consumer Channels

Several U.S. state dental boards have introduced legislation requiring in-person diagnostic scans before aligner dispensing, and the FDA issued warning letters to three DTC aligner companies in 2023, citing inadequate clinical supervision [14]. The channel risk was emphasized by Dentsply Sirona's withdrawal of its Byte DTC brand in 2024. In the Invisible Orthodontics Market, the volume contribution of mail-order models may be slowed by tightening regulations, despite the fact that they are improving patient-safety outcomes.


Clinical Limitations for Complex Cases

Aligners perform optimally for mild-to-moderate crowding, spacing, and Class I malocclusion. Severe skeletal discrepancies, open bites, and significant rotations still require fixed-appliance or surgical intervention. A 2024 meta-analysis in the European Journal of Orthodontics reported that treatment predictability for complex cases treated with aligners alone dropped to 61%, compared with 89% for conventional brackets [15]. This clinical ceiling caps the Invisible Orthodontics Market's penetration among roughly 30% of orthodontic patients globally.


Invisible Orthodontics Market Opportunities

Emerging-Market Expansion in Southeast Asia and Latin America

Orthodontic penetration in Indonesia, Vietnam, and Colombia sits below 3% of the treatable population, presenting a vast greenfield opportunity for the Invisible Orthodontics Market. Government-backed dental-health campaigns in these countries—coupled with a young, smartphone-connected demographic—create fertile ground for hybrid teleorthodontic delivery models.

Subscription-Based Retainer and Monitoring Services

Post-treatment retention represents a recurring-revenue stream that most incumbents have undermonetized. Aligner companies that bundle Vivera-style retainers with app-based compliance monitoring can convert one-time case revenue into 3-to-5-year subscription relationships, boosting patient lifetime value by an estimated 35–45%.

Integration with Cosmetic Dentistry Platforms

Teeth whitening, veneer preparation, and gum-contouring services are increasingly packaged alongside orthodontic correction. Clinics offering bundled aesthetic workflows report 28% higher case-acceptance rates, according to a 2024 Dental Economics survey [18]. The Invisible Orthodontics Market stands to benefit as platform-based dental chains expand these integrated offerings globally.

AI-Driven Outcome Prediction and Data Monetization

Aggregated anonymized treatment datasets—spanning millions of completed cases—hold significant value for material-science R&D, insurance actuarial modeling, and academic research. Companies that license predictive-analytics modules to third-party insurers and research institutions can create new revenue verticals without incremental patient-acquisition cost.

Chairside 3D-Printing in Rural and Underserved Clinics

Decentralized manufacturing through compact desktop printers reduces dependency on centralized aligner labs and cuts delivery lead times from 14 days to under 48 hours. For rural practitioners in India, Brazil, and sub-Saharan Africa, this capability effectively opens the Invisible Orthodontics Market to patient populations previously excluded by logistics constraints.


Invisible Orthodontics Market Future Outlook

AI-Driven Autonomous Treatment Planning

By 2030, fully autonomous treatment-staging algorithms are expected to handle up to 70% of mild-to-moderate cases without manual clinician adjustment, according to projections from the International Association for Dental Research [7]. This shift will compress case-setup time and allow general dentists to manage orthodontic workflows currently reserved for specialists, widening the provider base for the Invisible Orthodontics Market.

Material Science and Biocompatible Polymer Innovation

Next-generation shape-memory polymers and antimicrobial-coated trays are entering clinical trials, with commercialization timelines targeting 2028–2030. These materials promise to reduce tray-change frequency from biweekly to monthly, cutting total treatment cost by an estimated 20–25% and improving patient compliance metrics across the Invisible Orthodontics Market [9].

Platform Economics and Vertical Integration

The orthodontic value chain—from intraoral scanning to aligner fabrication to retention—is consolidating onto vertically integrated digital platforms. Companies controlling the full scan-to-delivery pipeline capture higher margins and generate proprietary datasets that strengthen AI model accuracy. This platform dynamic will intensify competitive concentration within the Invisible Orthodontics Market over the next decade.

ESG and Sustainability in Dental Manufacturing

Single-use plastic consumption in aligner production has drawn scrutiny from healthcare sustainability advocates. The WHO's 2025 Global Oral Health Action Plan includes targets for recyclable dental-device packaging and reduced polymer waste [19]. Manufacturers investing in closed-loop recycling programs and biodegradable tray materials will differentiate on sustainability—a dimension increasingly weighted by institutional procurement committees evaluating the Invisible Orthodontics Market.


Invisible Orthodontics Market Segmentation

By Product

Segment Key Metric Primary Demand Driver
Clear Aligners 65.6% of 2025 share Patient preference for removable, nearly invisible trays
Lingual Braces 19.5% CAGR (2026–2035) Demand for fixed yet hidden appliances
Ceramic Braces USD 1.36 Billion (2025) Cost-effective aesthetic alternative


Clear aligners dominate the Invisible Orthodontics Market, propelled by ease of use, removability for eating and oral hygiene, and the expanding clinical indication range validated by recent FDA clearances. The segment benefits from high direct-to-consumer visibility and aggressive marketing by leading brands. Lingual braces, while a smaller share, are carving a niche among adult professionals who require absolute discretion and are willing to pay a premium for custom-fitted appliances bonded to the tooth's lingual surface.

By Material

Segment Key Metric Primary Demand Driver
Thermoplastic Polyurethane (TPU) 50.4% of 2025 share Superior optical clarity and flexibility
PETG 22.5% CAGR (2026–2035) Cost efficiency and thermoformability
Other Materials USD 0.98 Billion (2025) Specialty polymers for niche applications


TPU's dominance in the Invisible Orthodontics Market reflects its balanced performance profile—high transparency, controlled force delivery, and resistance to staining. PETG, historically used in retainers and simpler appliances, is gaining share as manufacturers optimize its formulation for multi-stage aligner therapy, offering clinics a lower-cost alternative without sacrificing clinical outcomes.

By Patient Group

Segment Key Metric Primary Demand Driver
Teenagers 48.0% of 2025 share Parental preference for aesthetic, removable options
Adults 21.5% CAGR (2026–2035) Professional appearance, social media influence
Children USD 0.54 Billion (2025) Interceptive orthodontic protocols


Teenagers represent the largest patient group in the Invisible Orthodontics Market, driven by parental willingness to invest in aesthetic solutions and the growing clinical evidence supporting aligner use in adolescent dentitions. Adults, however, are the growth engine—social media-fueled awareness, workplace aesthetics, and improved insurance coverage are converting latent demand into active treatment starts at rates not seen a decade ago.

By End User

Segment Key Metric Primary Demand Driver
Dental & Orthodontic Clinics 65.9% of 2025 share In-person diagnosis and treatment supervision
Direct-to-Consumer Services 18.1% CAGR (2026–2035) Convenience and lower price points
Hospitals & Academic Centers USD 0.72 Billion (2025) Complex-case referrals and research


Dental and orthodontic clinics dominate the market because patients still prefer in-person doctor visits to manage their treatment. Meanwhile, direct-to-consumer services are growing rapidly due to their lower prices and convenience, while hospitals and academic centers handle the smallest share, focusing purely on research and highly complex cases.

By Sales Channel

Segment Key Metric Primary Demand Driver
Dentist-Led In-Office 63.4% of 2025 share Clinical trust and supervised treatment
Mail-Order/Online 23.0% CAGR (2026–2035) Convenience-driven younger demographics


Dentist-led in-office treatments hold the largest share of the market because patients deeply trust having a professional supervise their care in person. At the same time, mail-order and online options are growing at a rapid pace, heavily driven by younger generations who prioritize lower costs and the convenience of treating their teeth from home.


Regional Market Share Analysis

Region Key Metric Primary Investment Themes
North America 40.1% of 2025 revenue Insurance expansion, AI-platform integration
Europe 27.8% of 2025 revenue NHS/social-insurance reform, lingual braces demand
Asia-Pacific 23.1% CAGR (2026–2035) Rising incomes, low penetration, DTC channels
South America USD 0.46 Billion (2025) Public dental campaigns, urbanization
Middle East & Africa 4.2% of 2025 revenue Medical tourism, premium-clinic buildout
Total USD 8.34 Billion (2025)

The Invisible Orthodontics Market exhibits pronounced regional asymmetry. Mature markets in North America and Europe dominate absolute revenue, while volume growth concentrates in Asia-Pacific and select Latin American economies where orthodontic awareness is accelerating from a low base.


North America

Country Key Metric Key Driver
United States 78.3% of regional share Employer dental benefits, DTC penetration
Canada 14.1% of regional share Provincial orthodontic subsidies for minors
Mexico 12.8% CAGR (2026–2035) Growing middle-class dental spending


The United States remains the single largest country-level contributor to the Invisible Orthodontics Market, anchored by a well-developed private-pay infrastructure and a network of over 11,000 certified aligner providers. Canada's growth is sustained by expanding provincial coverage for pediatric orthodontics, while Mexico's rapidly urbanizing population and cross-border dental-tourism corridors fuel double-digit growth rates [8].

Europe

Country Key Metric Key Driver
Germany 24.6% of regional share Statutory health-insurance reform
United Kingdom 19.3% of regional share NHS orthodontic commissioning
France 15.7% of regional share Sécurité Sociale reimbursement updates
Italy 11.4% CAGR (2026–2035) Aesthetic-dentistry culture
Spain 10.8% CAGR (2026–2035) Dental-tourism influx
Nordic Countries 8.9% of regional share Universal pediatric dental coverage
Russia 12.1% CAGR (2026–2035) Private-clinic expansion
Rest of Europe 7.2% of regional share Varied reimbursement frameworks


Germany leads European demand in the Invisible Orthodontics Market thanks to statutory health insurance reforms that progressively expanded orthodontic eligibility to patients up to age 21. The UK's NHS orthodontic band system channels significant volume toward aligner providers, and France's 2024 Sécurité Sociale update raised lifetime maximums for Class II and III malocclusion treatments [12].

Asia-Pacific

Country Key Metric Key Driver
China 34.2% of regional share Middle-class expansion, domestic aligner brands
India 25.7% CAGR (2026–2035) Low penetration, teledentistry growth
Japan 18.4% of regional share Aging population seeking aesthetic solutions
South Korea 14.8% CAGR (2026–2035) NHIS coverage expansion for pediatric aligners
ASEAN 22.3% CAGR (2026–2035) Urbanization, rising dental awareness
Rest of Asia-Pacific 6.1% of regional share Early-stage market development


Asia-Pacific represents the highest-growth theater for the Invisible Orthodontics Market. China's domestic manufacturers—led by Angelalign Technology—have compressed price points by 35–40% relative to imported brands, unlocking demand in Tier 2 and Tier 3 cities. India's orthodontic penetration sits below 2%, yet a burgeoning network of teledentistry platforms is rapidly expanding patient access beyond metropolitan centers [11].

South America

Country Key Metric Key Driver
Brazil 62.4% of regional share Largest dental-professional workforce in the region
Argentina 13.5% CAGR (2026–2035) Private-insurance orthodontic coverage growth
Rest of South America 18.6% of regional share Incremental public-health investment


Brazil's outsized share stems from one of the world's highest per-capita ratios of dental professionals and a culturally strong orientation toward aesthetic treatments. Argentina's recovery from macroeconomic turbulence is channeling renewed consumer spending into elective dental procedures, lifting the Invisible Orthodontics Market across the Southern Cone [11].

Middle East & Africa

Country Key Metric Key Driver
Saudi Arabia 28.9% of regional share Vision 2030 healthcare investment
UAE 24.6% of regional share Medical-tourism hub, premium clinics
South Africa 14.2% CAGR (2026–2035) Private dental-insurance expansion
Egypt 13.8% CAGR (2026–2035) Young demographic, growing urban clinics
Rest of MEA 19.3% of regional share Fragmented, early-adoption pockets


The Gulf states drive MEA demand within the Invisible Orthodontics Market, supported by government healthcare spending under Saudi Arabia's Vision 2030 and the UAE's positioning as a regional medical-tourism destination. South Africa and Egypt present nascent but promising growth corridors tied to private dental-insurance penetration and youthful population demographics [11].


Invisible Orthodontics Market By Region, 2025-2035

Competitive Benchmarking

The Invisible Orthodontics Market exhibits medium concentration, with the top five companies holding an estimated 55–62% combined revenue share. The Herfindahl-Hirschman Index sits in the 1,200–1,600 range, indicating a moderately competitive structure. Align Technology retains clear market leadership through its vertically integrated Invisalign ecosystem, but patent expiries and aggressive pricing from Asian manufacturers are steadily eroding margin premiums and fragmenting the competitive field [16].

Company Est. Revenue Share Range Key Offerings Strategic Positioning
Align Technology ~28–33% Invisalign system, iTero scanners, Vivera retainers Vertically integrated platform leader
Straumann Group (ClearCorrect) ~7–10% ClearCorrect aligners, digital workflows Implant-to-ortho cross-sell ecosystem
Henry Schein ~5–8% Distribution of multiple aligner brands, practice-management software Channel-dominant distributor
Dentsply Sirona ~4–7% SureSmile aligners, CEREC integration CAD/CAM ecosystem leverage
3M ~3–6% Clarity aligners, ceramic brackets Material-science heritage
Ormco Corporation (Envista) ~3–5% Spark aligners, Damon system Hybrid bracket-aligner portfolio
Angelalign Technology ~4–6% Angelalign system, AI treatment planning Price leader in China/Asia-Pacific
TP Orthodontics ~1–3% Custom lingual brackets, ortho supplies Specialist niche positioning
American Orthodontics ~1–3% Empower brackets, aligner accessories Value-oriented North American focus
G&H Orthodontics ~1–2% Wire, bracket, and aligner accessories Component-supplier specialization


Recent News & Developments

  • Align Technology (September 2024): Launched Invisalign Palatal Expander System, the first aligner-based palatal expansion device cleared by the FDA, broadening pediatric treatment indications for the Invisible Orthodontics Market [20].
  • Straumann Group (June 2024): Acquired a majority stake in a Berlin-based AI orthodontic-planning startup for approximately USD 185 million, accelerating ClearCorrect's digital-workflow capabilities [21].


  • Ormco Corporation (August 2023): Received CE Mark approval for its next-generation Spark aligner material featuring enhanced stain resistance and force retention over 14-day wear cycles [24].


Invisible Orthodontics Market Report Scope

Parameter Detail
Market Scope Global Invisible Orthodontics Market covering products, materials, patient groups, end users, sales channels, and five geographic regions
Study Period 2021–2035
CAGR (Forecast Period) 11.5% (2026–2035)
Market Size (2025) USD 8.34 Billion
Market Size (2035) USD 24.78 Billion
Fastest Growing Segment Mail-Order/Online (by sales channel); Asia-Pacific (by region)
Companies Profiled Align Technology, Straumann Group, Henry Schein, Dentsply Sirona, 3M, Ormco Corporation, Angelalign Technology, TP Orthodontics, American Orthodontics, G&H Orthodontics
Valuation Currency USD Billion


FAQs

How does aligner treatment cost compare with traditional metal braces for adult patients?
Aligners typically run 15–25% higher than metal braces in the United States, averaging USD 4,800 versus USD 3,900. Insurance reimbursement parity initiatives are narrowing that gap in several states.
What clinical training is required for a general dentist to prescribe aligners?
Most manufacturers mandate a certification course of 8–16 hours plus supervised case submissions. Board-certified orthodontists may bypass introductory modules but still complete brand-specific platform training.
How do regulatory requirements differ between in-office and mail-order aligner channels?
In-office channels require a licensed provider's direct diagnosis, while mail-order models face emerging state-level mandates for pre-treatment imaging. FDA oversight is tightening across both pathways [14].
What role do intraoral scanners play in aligner adoption rates?
Scanners eliminate messy physical impressions, reducing patient drop-off at the diagnostic stage by roughly 30%. Clinics investing in scanners report higher case-acceptance rates and faster treatment starts [2].
How are sustainability concerns influencing aligner material selection?
Biodegradable and recyclable polymer research is accelerating, with three major manufacturers piloting closed-loop tray-recycling programs targeting commercial launch by 2028 [19].
What IP risks should new entrants consider before entering aligner manufacturing?
Key Align Technology patents began expiring in 2017–2022, but the company holds over 1,400 active patents. New entrants must conduct thorough freedom-to-operate analyses to avoid litigation [16].
How does the Invisible Orthodontics Market address patients with mixed dentition?
Phase-one interceptive aligners designed for children aged 6–10 with mixed dentition are gaining clinical validation. Early intervention can reduce the complexity and cost of Phase-two treatment in adolescence.    
Author
Author
Author Profile
Satyendra Maurya LinkedIn
Research Analyst
An accomplished research analyst with high proficiency in market forecasting, data visualization, competitive benchmarking, and others. He holds a pronounced track record in research and consulting projects for sectors such as life sciences, medical devices, and healthcare IT. His capabilities in qualitative and quantitative analysis have resulted in positive client outcomes. Working on niche market trends, opportunities, sales, and forecasted value is part of his skill set.
Co-Author
Co-Author Profile
Rahul Gotadki LinkedIn
Research Manager
He holds an experience of about 9+ years in Market Research and Business Consulting, working under the spectrum of Life Sciences and Healthcare domains. Rahul conceptualizes and implements a scalable business strategy and provides strategic leadership to the clients. His expertise lies in market estimation, competitive intelligence, pipeline analysis, customer assessment, etc.
Download Free Sample

Kindly complete the form below to receive a free sample of this Report

Download PDF ×

We do not share your information with anyone. However, we may send you emails based on your report interest from time to time. You may contact us at any time to opt-out.
















