Mental Health Apps Market (2026 - 2035)

Mental Health Apps Market Research Report: Size, Share, Trend Analysis By Applications (Stress Management, Meditation, Therapy, Mood Tracking, Self-Help), By User Type (Individuals, Healthcare Professionals, Corporate Employees, Students), By Platform (iOS, Android, Web, Wearable Devices), By Pricing Model (Subscription, One-Time Purchase, Freemium, In-App Purchases) and By Regional (North America, Europe, South America, Asia Pacific, Middle East and Africa) - Growth Outlook & Industry Forecast 2025 To 2035

Forecast Period
2026-2035
CAGR
14.0%
2025 Market Size
USD 7.88 Billion
2035 Market Size
USD 29.20 Billion
Healthcare Services ● Updated August 24, 2026 Report ID: MRFR/HS/17677-HCR | Pages: 128 | Author: Vikita Thakur, Rahul Gotadki

Mental Health Apps Market Summary

The Mental Health Apps Market closed 2025 at USD 7.88 billion and enters the forecast window at USD 8.98 billion in 2026, expanding to USD 29.20 billion by 2035 at a 14.0% CAGR. Two catalysts explain the slope. Reimbursement finally arrived: the U.S. Centers for Medicare & Medicaid Services established payment pathways for FDA-cleared digital mental health treatment devices beginning January 2025, converting consumer downloads into billable clinical episodes [1]. Capital followed. Behavioral health digital ventures absorbed roughly USD 2.7 billion in disclosed funding during 2024–2025, a share of overall digital health investment that has grown for four consecutive years [2].

Underneath the headline number sits a genuine architecture shift. Standalone meditation timers and static mood diaries — the 2015-era product template — are giving way to clinically validated therapeutic software: adaptive CBT engines, conversational agents with escalation logic, passive sensing from wearables, and measurement-based care dashboards that feed structured outcome data back to prescribing clinicians. The National Health Service allocated approximately GBP 70 million toward digital therapeutics assessment and deployment through its Talking Therapies modernisation programme, a signal that payers now want evidence, not engagement metrics [3]. Vendors that cannot produce randomized trial data are being squeezed out of the Mental Health Apps Market's institutional channel.

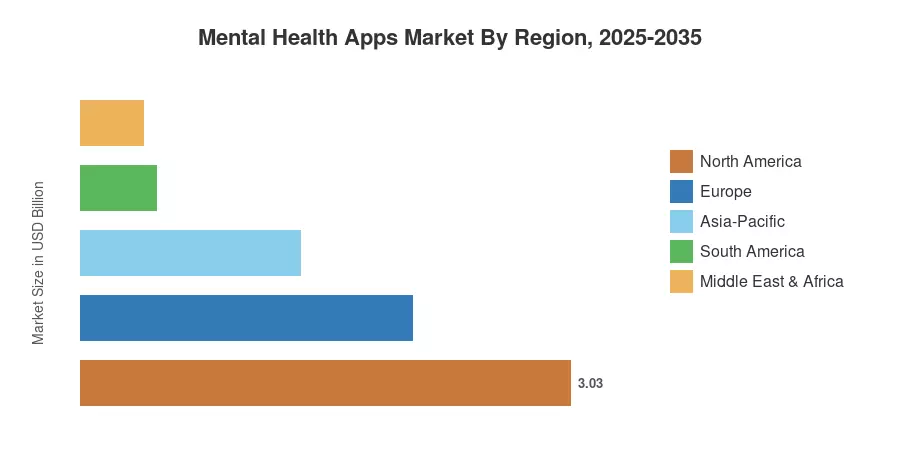
Regionally, North America holds 38.5% of 2025 revenue, anchored by employer-sponsored behavioural benefits and an unusually permissive reimbursement environment. Asia-Pacific grows fastest at a 17.2% CAGR through 2035, propelled by India's Tele-MANAS rollout and China's National Mental Health Action Plan. Europe ranks second on share, where the German DiGA fast-track remains the world's most-copied prescription pathway. The Mental Health Apps Market is moving from wellness accessory to reimbursed care infrastructure, and the next decade will separate the two categories permanently.


Key Report Takeaways

• By Platform

  • iOS accounts for 38.0% of 2025 platform revenue, reflecting higher paid-conversion economics in North America and Western Europe
  • Wearables-first deployments post the steepest trajectory within the Mental Health Apps Market at a 19.4% CAGR, driven by passive sleep and heart-rate-variability sensing

• By Application

  • Depression & Anxiety Management generated USD 2.64 billion in 2025, the largest application pool
  • Substance Use & Addiction Recovery expands at a 15.8% CAGR as state opioid settlement funds route toward digital aftercare

• By Region

  • North America commands 38.5% of Mental Health Apps Market revenue, led by U.S. employer benefit spend
  • Asia-Pacific delivers a 17.2% CAGR, the fastest of any region
  • Europe contributed USD 2.05 billion in 2025


Market Size and Forecast (2021–2035)

Sizing combines vendor revenue disclosures, app-store gross billings adjusted for platform commission, employer and payer contract values sourced from benefits consultancies, and prescription digital therapeutic claims data. Consumer subscription revenue is recognised net of refunds and trial churn; enterprise contracts are recognised on annualised committed value. Historical years were reconciled against reported financials from publicly traded and late-stage private operators.
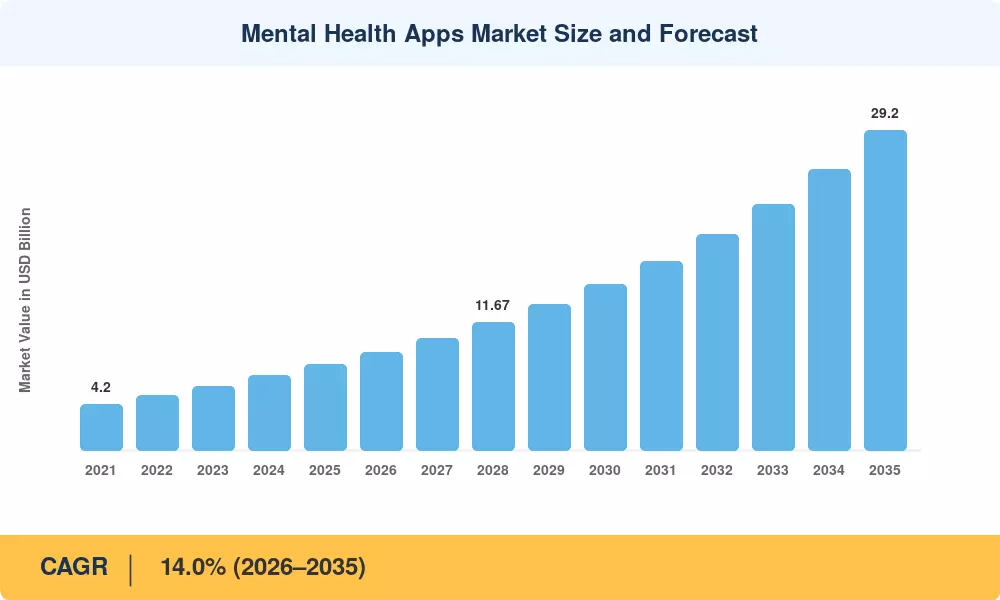
Mental Health Apps Market Size and Forecast
Our Impact
Enabled $4.3B Revenue Impact for Fortune 500 and Leading Multinationals
Partnering with 2000+ Global Organizations Each Year
30K+ Citations by Top-Tier Firms in the Industry

Driver Impact Analysis

Impact percentages below are directional weightings assigned by analyst scoring of each driver's contribution to growth momentum in the Mental Health Apps Market. They are not additive to the headline CAGR and should not be summed.

Driver ~% Impact on CAGR Geographic Relevance Impact Timeline
Reimbursement pathways for digital therapeutics 3.4 North America, Europe Short-term (≤2 yr)
Clinician shortage and access gaps 2.9 Global Long-term (≥4 yr)
Employer behavioural benefit expansion 2.4 North America, Europe Short-term (≤2 yr)
Generative AI conversational agents 2.2 Global Medium-term (2–4 yr)
Smartphone and wearable penetration in APAC 1.8 Asia-Pacific Medium-term (2–4 yr)
Adolescent mental health policy funding 1.4 North America, Europe Medium-term (2–4 yr)
Destigmatisation and self-directed care norms 1.1 Global Long-term (≥4 yr)


Reimbursement Finally Arrives

Payment, not product, was the binding constraint. CMS finalised HCPCS codes covering FDA-cleared digital mental health treatment devices with national payment amounts effective January 2025, and Germany's DiGA directory now lists prescription apps reimbursed at roughly EUR 200–500 per patient per quarter across statutory sickness funds [1][12]. That converts a USD 60 annual consumer subscription into a several-hundred-dollar clinical episode. The revenue-per-user delta is the single most consequential economic change in the Mental Health Apps Market since app stores launched.

The Supply Side Cannot Scale

Employers Are Buying Outcomes

Large U.S. employers now report behavioural health as their top-cited benefit priority, with roughly 77% flagging worsening workforce mental health in recent benefits surveys [5]. Purchasing has shifted from headcount-based EAP contracts to per-employee-per-month platform fees with utilisation and outcome guarantees. Vendors that publish depression symptom reduction data win those renewals.

Conversational AI Changes Unit Economics

Large language models cut the marginal cost of a guided therapeutic conversation to near zero, and 2024–2025 trial results for structured AI-delivered CBT showed clinically meaningful symptom improvement in supervised settings [8]. Regulators have responded cautiously — several U.S. states passed statutes in 2025 restricting unsupervised AI therapy claims — but the cost curve is now permanently altered.


Restraints Impact Analysis

Restraint ~% Drag on CAGR Geographic Relevance Impact Timeline
Poor long-term user retention -2.6 Global Short-term (≤2 yr)
Privacy and data-sharing scrutiny -2.1 North America, Europe Medium-term (2–4 yr)
Thin clinical evidence base -1.7 Global Medium-term (2–4 yr)
Regulatory fragmentation across jurisdictions -1.3 Global Long-term (≥4 yr)
Clinical liability and crisis-escalation risk -0.9 North America Long-term (≥4 yr)


Retention Is the Industry's Structural Weakness

Real-world engagement studies consistently find that fewer than 4% of mental health app downloaders remain active after 30 days, an order of magnitude below trial-setting adherence [13]. Because subscription revenue compounds only with retained cohorts, customer acquisition cost payback periods stretch past 14 months for consumer-first vendors. Enterprise and payer channels partly solve this by removing the renewal decision from the individual.

Privacy Enforcement Has Teeth

The U.S. Federal Trade Commission's actions against mental health platforms for sharing user data with advertising networks produced multimillion-dollar orders and permanent conduct restrictions [14]. European regulators applied comparable pressure under GDPR special-category provisions. Compliance costs are now a meaningful line item, and data monetisation strategies that once subsidised free tiers have narrowed sharply.

Evidence Quality Remains Uneven

Systematic reviews of publicly available mental health applications find that only a small minority are supported by any peer-reviewed efficacy study, and fewer still by adequately powered randomized controlled trials [15]. Payers increasingly demand what most vendors cannot supply, which slows institutional adoption even as consumer demand grows.


Mental Health Apps Market Opportunities

Prescription-Grade Products for Adolescents

Pediatric behavioural demand outpaces every other cohort, yet almost no cleared digital therapeutic targets under-18 populations at scale. Vendors that clear regulatory review for adolescent depression or ADHD-adjacent anxiety would enter a demand pool where school districts and pediatric health systems are already holding budget. The Mental Health Apps Market rewards first movers in narrow indications disproportionately.

Payer-Integrated Measurement-Based Care

Insurers want symptom trajectory data to tier network referrals. Applications that export validated PHQ-9 and GAD-7 sequences into payer analytics environments become infrastructure rather than point solutions, which changes contract duration from annual to multi-year.

Emerging-Market Vernacular Deployment

India's Tele-MANAS network handled millions of helpline contacts across more than 20 languages, creating a triage funnel with no scaled digital step-down layer [17]. Southeast Asia and Sub-Saharan Africa present similar structures: national helplines exist, follow-on care does not. Low-bandwidth, vernacular-first products addressing that gap face almost no incumbent competition.

De-Identified Outcome Data as a Commercial Asset

Pharmaceutical developers running CNS trials pay substantially for real-world symptom and adherence datasets. Platforms holding consented longitudinal cohorts can license de-identified evidence packages — a second revenue line that does not depend on subscriber growth, and one that repositions the Mental Health Apps Market participant as a data infrastructure business.

Wearable-Native Passive Detection

Sleep architecture, heart-rate variability, and movement variance predict depressive episode onset with growing accuracy. Bundling detection into devices consumers already wear removes the daily-open requirement that kills retention.


Mental Health Apps Market Future Outlook

Regulated AI Becomes the Default Interface

By 2030, most guided therapeutic interactions in the Mental Health Apps Market will be AI-mediated with human clinical oversight rather than fully human-delivered. The EU AI Act classifies health-adjacent systems as high-risk with conformity obligations phasing through 2027, which will professionalise the category and eliminate the current tier of unregulated chatbot products [6].

Platform Economics Consolidate Around Distribution

Standalone consumer applications struggle as employers, insurers, and health systems become the buyers. Expect continued absorption of point solutions into behavioural platforms, mirroring the pattern already visible in 2023–2025 acquisition activity. Distribution, not product differentiation, decides survivorship.

Outcome Data Becomes the Balance Sheet Asset

Longitudinal, consented symptom datasets will be valued independently of subscriber revenue. Pharmaceutical and payer demand for real-world CNS evidence supports licensing models that mature after 2028.

Passive Sensing Displaces Self-Report

Wearable-derived biomarkers will supplement questionnaire-based assessment across a growing share of deployments, reducing the engagement burden that currently caps retention. This is the most probable path to structurally higher lifetime value in the Mental Health Apps Market.


Mental Health Apps Market Segmentation

The Mental Health Apps Market is segmented by platform, application, end user, age group, and subscription model.

By Platform

Segment Share (2025) Primary Demand Driver
iOS 38.0% Higher paid-conversion in developed markets
Android 34.0% Volume reach across Asia-Pacific and Africa
Cross-platform/Hybrid 21.0% Enterprise deployment cost efficiency
Wearables-First 7.0% Passive sensing and continuous monitoring


iOS leads revenue despite trailing Android on installed base, a persistent gap explained by subscriber willingness-to-pay in North America and Western Europe. Cross-platform builds are gaining institutional preference because employer and payer contracts require device-agnostic coverage across an entire population, and maintaining two native codebases raises the cost of clinical updates within the Mental Health Apps Market.

By Application

Segment Value (2025, USD B) Primary Demand Driver
Depression & Anxiety Management 2.64 Highest prevalence and reimbursement coverage
Stress & Sleep Management 1.89 Employer wellbeing programmes
Meditation & Mindfulness Wellness 1.54 Consumer subscription retention
Substance Use & Addiction Recovery 0.95 Opioid settlement fund allocation
Other Applications 0.86 Eating disorders, PTSD, bipolar support


Depression and anxiety management captures the largest pool because it maps directly to reimbursable diagnostic codes. Addiction recovery is the notable accelerator — U.S. state opioid settlement disbursements have funded digital aftercare procurement at a pace few forecasters anticipated, and recovery products benefit from unusually high engagement given the stakes for users in the Mental Health Apps Market.

By End User

Segment Share (2025) Primary Demand Driver
Homecare/Individuals 52.0% Direct-to-consumer subscription access
Employers & Payers 24.0% Benefit cost containment
Providers & Clinics 17.0% Waiting-list step-care management
Educational Institutions 7.0% Campus counselling capacity constraints


Individual consumers still account for the majority of spending, but their share is declining every year. Employer and payer channels grow faster because they eliminate the monthly renewal decision, and that structural difference is reshaping product design across the Mental Health Apps Market toward outcome reporting rather than engagement gamification.

By Age Group

Segment CAGR (2026–2035) Primary Demand Driver
Children & Adolescents ≤17 16.9% School and pediatric programme funding
Adults 18–44 13.4% Workplace stress and digital-native behaviour
Adults 45–64 14.2% Chronic condition comorbidity management
Seniors 65+ 15.1% Medicare coverage and loneliness interventions


The mental health applications industry is mostly used by adults aged 18-44 years, who have significant smartphone penetration, are under stress at work and prefer a digital first approach to wellbeing. Meanwhile, children and adolescents (≤ 17) are the fastest increasing group, spurred by the growing youth mental health efforts, specific funding for school-based digital programs and urgent clinical interventions.


By Subscription Model

Segment Share (2025) Primary Demand Driver
Freemium 41.0% Low-friction acquisition funnel
Paid Subscription 33.0% Recurring consumer revenue
Employer/Payer-Sponsored 17.0% Zero-cost access at point of use
One-Time Purchase 9.0% Niche self-help and course products


Facilitating the global scaling of customer bases through low-friction user acquisition funnels has allowed freemium models to continue to dominate the subscription part of the mental health apps market. Meanwhile, employer- and payer-sponsored models are an emerging distribution channel, driven by corporate wellness initiatives, health plan integrations and zero-cost access methods aimed at reducing workplace absenteeism and healthcare expenditures.


Regional Market Share Analysis

Region Metric (2025) Primary Investment Themes
North America 38.5% share Reimbursed digital therapeutics; employer platforms
Europe USD 2.05 Billion Prescription app pathways; GDPR-compliant design
Asia-Pacific 17.2% CAGR (2026–2035) Vernacular access; public tele-mental-health
South America 6.0% share Private insurer bundles; Portuguese/Spanish content
Middle East & Africa USD 0.39 Billion National wellbeing strategies; youth programmes
Total USD 7.88 Billion

Regional performance in the Mental Health Apps Market tracks reimbursement architecture more closely than smartphone penetration or disease burden.


North America

Country Share of Region (2025) Key Driver
US 86.0% CMS digital therapeutic payment codes
Canada 9.5% Provincial virtual care funding
Mexico 4.5% Employer wellbeing adoption in Monterrey/CDMX corridors


The U.S. dominates the Mental Health Apps Market because three payment channels operate simultaneously: self-insured employers, commercial insurers, and now Medicare. Canada's contribution is smaller but structurally stable, with several provinces funding population-wide access to cognitive behavioural programmes at no user cost. Mexico's growth is concentrated in multinational employer populations rather than public provision.

Europe

Country Metric (2025) Key Driver
Germany 24.0% share of region DiGA prescription reimbursement directory
UK 22.5% share of region NHS Talking Therapies digital pathway
France 13.0% share of region PECAN early-access digital device scheme
Italy 8.5% share of region Regional telehealth procurement
Spain 7.5% share of region Primary care mental health strategy
Nordic Countries 9.0% share of region High digital health literacy
Russia 4.5% share of region Private-pay consumer subscriptions
Rest of Europe 11.0% share of region Cross-border EU conformity harmonisation


Germany's DiGA framework remains the reference model globally — a listed application receives statutory reimbursement while it accumulates the evidence required for permanent inclusion. France's PECAN scheme copied the structure deliberately. The practical effect is that European product roadmaps are built around clinical endpoints from day one, which slows launch velocity but produces defensible institutional contracts.

Asia-Pacific

Country Metric (2025) Key Driver
China 31.0% share of region National Mental Health Action Plan targets
India 19.5% share of region Tele-MANAS national helpline integration
Japan 17.0% share of region Workplace stress-check legal mandate
South Korea 11.5% share of region Youth digital wellbeing funding
ASEAN 12.0% share of region Insurer-bundled wellness distribution
Rest of Asia-Pacific 9.0% share of region Rising private-pay adoption


Asia-Pacific's 17.2% CAGR makes it the growth engine of the Mental Health Apps Market. Japan's Industrial Safety and Health Act stress-check obligation created a compulsory annual screening event across employers above a defined headcount, and digital vendors have converted that screening into a paid follow-on service. India's opportunity is structurally different — public triage capacity exists, paid follow-through does not.

South America

Country Metric (2025) Key Driver
Brazil 58.0% share of region Private health operator bundling
Argentina 17.5% share of region Urban professional subscriber base
Rest of South America 24.5% share of region Regional telehealth licensing reform


Brazilian growth runs through supplementary health operators, which increasingly package behavioural applications into standard plan tiers rather than selling them as add-ons. Portuguese-language clinical content remains scarce, giving localised vendors a durable moat against U.S. incumbents.

Middle East & Africa

Country Metric (2025) Key Driver
Saudi Arabia 29.0% share of region Vision 2030 wellbeing programme funding
UAE 24.0% share of region National mental health strategy and expatriate demand
South Africa 18.0% share of region Corporate wellness procurement
Egypt 11.5% share of region Youth-focused public awareness campaigns
Rest of MEA 17.5% share of region Donor-funded pilot deployments


Gulf state adoption is policy-led rather than market-led. Saudi Arabia's Quality of Life Program funds population wellbeing initiatives directly, and procurement runs through health authorities rather than employers. Cultural adaptation of therapeutic content — not translation alone — determines which vendors win these tenders.


Mental Health Apps Market By Region, 2025-2035

Competitive Benchmarking

Concentration is low. The estimated Herfindahl-Hirschman Index sits near 480, with the top five participants controlling roughly 33–38% of global revenue. Thousands of applications compete for consumer attention while a much smaller cohort — perhaps 40 firms worldwide — holds meaningful enterprise or payer contracts. That bifurcation defines competition in the Mental Health Apps Market: consumer players fight on acquisition cost, institutional players fight on clinical evidence.

Company Est. Revenue Share Range Key Offerings Strategic Positioning
Teladoc Health (BetterHelp) ~9–12% Text/video therapy marketplace Largest direct-to-consumer therapy network
Headspace ~6–9% Mindfulness, coaching, clinical care Consumer brand with enterprise pivot
Calm ~5–8% Sleep, meditation, Calm Health Highest-recognition consumer franchise
Lyra Health ~4–7% Employer behavioural benefit platform Premium enterprise, outcome-guaranteed
Spring Health ~4–6% Precision behavioural navigation Data-driven payer and employer contracts
Talkspace ~3–5% Virtual therapy and psychiatry Medicare and health-plan channel focus
Twill (Happify Health) ~2–4% Intelligent healing platform Pharma-partnered digital companions
Wysa ~2–4% AI conversational support Regulated AI, strong emerging-market reach
Modern Health ~2–4% Global workforce wellbeing Multilingual multinational employer coverage
Big Health ~1–3% Sleepio, Daylight Evidence-first prescription-grade products
Woebot Health ~1–3% CBT-based conversational agent Clinical trial-backed AI therapeutics


Recent News & Developments

  • CMS (November 2024): Finalised national payment amounts for digital mental health treatment devices in the CY2025 Physician Fee Schedule, creating the first durable U.S. reimbursement route [1]
  • Teladoc Health (April 2024): Acquired preventive care platform Catapult Health for USD 65 million, extending screening-to-treatment continuity across its behavioural franchise [18]
  • Headspace (March 2024): Launched Ebb, an empathetic AI companion embedded in its consumer application, with clinician-designed escalation protocols [19]
  • Spring Health (July 2024): Closed a USD 100 million Series E at a USD 3.3 billion valuation, one of the largest behavioural health rounds of the cycle [2]
  • NHS England (June 2024): Expanded approved digital therapy provision within Talking Therapies services, standardising outcome reporting requirements for vendors [3]
  • Otsuka Pharmaceutical (2024): Advanced Rejoyn, the first FDA-cleared prescription digital therapeutic for major depressive disorder adjunctive treatment, into commercial distribution [20]
  • Illinois & Nevada legislatures (2025): Enacted statutes restricting AI systems from delivering therapy without licensed professional oversight, setting a template other states are reviewing [16]
  • Wysa (2025): Expanded NHS and Gulf-region deployments with vernacular language support, reinforcing emerging-market positioning [17]


Mental Health Apps Market Report Scope

Parameter Detail
Market Scope Global Mental Health Apps Market — consumer, employer, payer, provider, and prescription digital therapeutic channels
Study Period 2021–2035 (Historical 2021–2024; Base Year 2025; Forecast 2026–2035)
CAGR 14.0% (2026–2035)
Market Size Checkpoints USD 7.88 Billion (2025); USD 8.98 Billion (2026); USD 29.20 Billion (2035)
Fastest Growing Segments Wearables-First (platform); Substance Use & Addiction Recovery (application); Children & Adolescents ≤17 (age group)
Companies Profiled 11 major participants including Teladoc Health, Headspace, Calm, Lyra Health, Spring Health, Talkspace, Twill, Wysa, Modern Health, Big Health, Woebot Health
Valuation Currency USD (Billion), constant 2025 dollars

FAQs

What due-diligence red flags should investors screen for in the Mental Health Apps Market?
Watch for engagement metrics substituted for clinical outcomes, and for revenue concentration in a single employer contract. Absence of a published trial protocol is the clearest disqualifier [15].
How do procurement teams compare vendor pricing models?
Per-employee-per-month pricing charges for the whole population regardless of use; per-engaged-user pricing charges only for activated members. The second looks cheaper but shifts utilisation risk onto the buyer [5].
What integration work does a health system face when deploying a Mental Health Apps Market solution?
Expect FHIR-based EHR bidirectional exchange, single sign-on, and crisis-escalation routing into existing on-call workflows. Escalation design consumes the most implementation time [20].
Are prescription digital therapeutics competing with or complementing wellness applications?
They complement. Prescription products treat diagnosed conditions under clinical supervision, while wellness applications serve subclinical demand and often act as the top of the referral funnel [12].
Which certification matters most for entering the European Mental Health Apps Market?
EU MDR conformity as a Class IIa medical device, plus national listing such as Germany's DiGA. MDR certification typically takes 12–18 months and gates every downstream reimbursement application [12].
How should buyers evaluate AI safety claims from vendors?
Ask for documented escalation logic, red-team results on self-harm prompts, and clinician review rates. Vendors unable to describe what happens when a user expresses crisis intent should be excluded [16].
What emerging use case is most underserved right now?
Perinatal and postpartum mental health. Prevalence is high, screening is routine, and almost no scaled digital product addresses the treatment gap after screening [10].    
Author
Author
Author Profile
Vikita Thakur LinkedIn
Senior Research Analyst
She holds an experience of about 5+ years in market research and business consulting projects for sectors such as life sciences, medical devices, and healthcare IT. She possesses a robust background in data analysis, market estimation, competitive intelligence, pipeline analysis market trend identification, and consumer behavior insights. Her expertise lies in technical Sales support, client interaction and project management, designing and implementing market research studies, conducting competitive analysis, and synthesizing complex data into actionable recommendations that drive business growth.
Co-Author
Co-Author Profile
Rahul Gotadki LinkedIn
Research Manager
He holds an experience of about 9+ years in Market Research and Business Consulting, working under the spectrum of Life Sciences and Healthcare domains. Rahul conceptualizes and implements a scalable business strategy and provides strategic leadership to the clients. His expertise lies in market estimation, competitive intelligence, pipeline analysis, customer assessment, etc.
Share::
Request Free Sample

Research Approach


Secondary Research

The secondary research process involved comprehensive analysis of regulatory databases, peer-reviewed medical journals, digital health publications, and authoritative health organizations. Key sources included the US Food & Drug Administration (FDA) Digital Health Center of Excellence, National Institute of Mental Health (NIMH), Substance Abuse and Mental Health Services Administration (SAMHSA), World Health Organization (WHO) Mental Health Division, Centers for Disease Control and Prevention (CDC) National Center for Health Statistics, National Institutes of Health (NIH), National Center for Biotechnology Information (NCBI/PubMed), European Commission Digital Health and Care Directorate, UK National Health Service (NHS) Digital Mental Health Programs, Australian Digital Health Agency, Health Canada Digital Health Division, Organisation for Economic Co-operation and Development (OECD) Health Statistics, Pew Research Center Internet & Technology Studies, IMS Institute for Healthcare Informatics, and App Store (Apple) & Google Play Store analytics data.

App adoption statistics, clinical validation studies, regulatory framework data, user demographic trends, and competitive landscape analysis for meditation apps, therapy platforms, mood tracking apps, stress management apps, and AI-powered mental health tools were gathered from these sources.


Primary Research

In order to gather both qualitative and quantitative insights, supply-side and demand-side stakeholders were interviewed during the primary research process. CEOs, chief product officers, vice presidents of clinical development, heads of regulatory compliance, data privacy officers, and commercial directors from mHealth technology providers, digital therapeutics firms, and mental health app developers were examples of supply-side sources. Licensed clinical psychologists, psychiatrists, behavioral health specialists, directors of employee wellness programs, administrators of university counseling centers, payers and health plan innovation managers, and procurement leads from employer associations, health systems, and educational institutions were examples of demand-side sources. In addition to gathering information on user retention trends, pricing optimization tactics, reimbursement pathways for prescription digital therapeutics, and integration issues with electronic health record (EHR) systems, primary research validated market segmentation and confirmed clinical pipeline timelines.

Primary Respondent Breakdown:

By Designation: C-level Primaries (32%), Director Level (35%), Others (33%)

By Region: North America (42%), Europe (25%), Asia-Pacific (28%), Rest of World (5%)


Market Size Estimation

Revenue mapping and active user base research were used to determine the global market valuation. The methodology comprised:

Finding more than fifty important publishers and developers in North America, Europe, Asia-Pacific, Latin America, and the Middle East and Africa

Product mapping by stress management, meditation, therapy/telepsychiatry, mood tracking, and cognitive behavioral therapy (CBT) applications across iOS, Android, web-based, and wearable-integrated platforms

Analysis of monthly active users (MAU), average revenue per user (ARPU), and reported and predicted yearly revenues for mental health app portfolios

coverage of developers accounting for 75–80% of the world market in 2024

Extrapolation of segment-specific valuations for subscription, freemium, one-time purchase, and in-app purchase revenue models using top-down (developer revenue validation) and bottom-up (active user base × ARPU by nation) methods

Share::
Request Free Sample
Download Free Sample

Kindly complete the form below to receive a free sample of this Report

* Please use a valid business email

Share::
Request Free Sample
Download PDF ×

We do not share your information with anyone. However, we may send you emails based on your report interest from time to time. You may contact us at any time to opt-out.
















