Nutrigenomics Market Share
Nutrigenomics Market Research Report By Application (Personalized Nutrition, Disease Prevention, Health Optimization, Fitness and Athletic Performance), By End Use (Healthcare, Dietary Supplements, Food Beverage, Pharmaceuticals), By Product Type (Genetic Testing Kits, Bioinformatics Tools, Nutritional Analysis Software), By Technology (DNA Sequencing, Microarray Analysis, Polymerase Chain Reac...

Market Summary
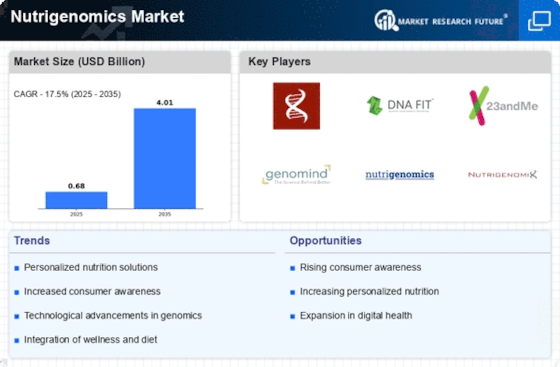
As per Market Research Future Analysis, the Nutrigenomics Market was valued at 0.23 USD Billion in 2024 and is projected to grow to 0.00 USD Billion by 2035, with a CAGR of 0.00% from 2025 to 2035. The market is driven by increasing consumer awareness of health and wellness, the demand for personalized nutrition solutions, and advancements in biotechnology.
Key Market Trends & Highlights
The Nutrigenomics Market is witnessing significant growth due to various trends.
- Personalized Nutrition is expected to grow from 1.1 USD Billion in 2024 to 3.5 USD Billion by 2035. Disease Prevention is projected to rise from 0.9 USD Billion in 2024 to 3.0 USD Billion by 2035. Healthcare sector is leveraging genetic insights, with the market expected to reach 0.68 USD Billion in 2024.
Market Size & Forecast
2024 Market Size | USD 0.23 Billion |
2035 Market Size | USD 0.00 Billion |
CAGR (2025-2035) | 0.00% |
Largest Regional Market Share in 2024 | North America. |
Major Players
<p>Key players include Wellness Within, Metagenics, Youngevity International, Nutrigenomix, and 23andMe.</p>
Market Trends
The Global Nutrigenomics Market is experiencing substantial development, which is driven by factors such as the growing awareness of health and wellness among consumers. The demand for personalized nutrition solutions that are in accordance with individual genetic profiles is on the rise as individuals become more health conscious. This trend is observable on a global scale, as an increasing number of consumers are seeking personalized dietary recommendations that are based on their genetic composition. Consequently, this trend is propelling the development of nutrigenomic products and services.
The incorporation of technology, particularly in the form of mobile applications and genetic testing devices, has facilitated the process of accessing genetic information and incorporating it into one's nutritional decisions.There are numerous opportunities in this market, particularly for companies that can create comprehensive platforms that integrate genetic testing, dietary advice, and data analysis.
The product offerings can be further improved through collaborations between nutritionists, geneticists, and technology companies. In addition, the expansion of e-commerce channels offers a valuable opportunity for nutrigenomics firms to expand their global reach, particularly in regions with limited access to traditional health services. In recent years, there has been an increasing emphasis on research and development, as more studies have confirmed the connection between genetics and nutrition. This development has resulted in a rise in investment from both private enterprises and public institutions, with the objective of advancing the knowledge and application of nutrigenomics.
<p>The increasing recognition of the interplay between nutrition and genetics is driving advancements in personalized dietary recommendations, suggesting a transformative shift in health management strategies.</p>
U.S. National Institutes of Health
Nutrigenomics Market Market Drivers
Rising Health Awareness
The increasing global awareness regarding health and wellness significantly drives the Global Nutrigenomics Market Industry. Consumers are becoming more informed about the relationship between nutrition and genetics, leading to a growing demand for personalized dietary solutions. This trend is reflected in the projected market value of 0.68 USD Billion in 2024, indicating a robust interest in nutrigenomic products. As individuals seek tailored nutrition plans to optimize health outcomes, the industry is likely to expand, catering to diverse dietary needs and preferences.
Market Segment Insights
Nutrigenomics Market Application Insights
<p>The Application segment of the Global Nutrigenomics Market has shown substantial growth and is expected to reach a valuation of 0.68 USD Billion by 2024, with significant expansion projected leading to an estimated 2.5 USD Billion by 2035. This market segmentation showcases various critical applications, each contributing uniquely to the overall landscape. Personalized Nutrition, which focuses on customizing dietary plans according to individuals’ genetic profiles, is a major driver in the market, valued at 1.1 USD Billion in 2024 and anticipated to rise to 3.5 USD Billion in 2035, denoting a significant growth trajectory and dominance in this sector.</p>
<p>This application empowers individuals with tailored dietary choices, directly impacting health outcomes and nutritional efficiency. Similarly, Disease Prevention holds a substantial position within the market, valued at 0.9 USD Billion in 2024 and expected to surge to 3.0 USD Billion by 2035.</p>
<p>This growing focus on preventive health measures reflects a broader trend towards proactive health management, reducing healthcare costs and improving quality of life. Health Optimization, valued at 0.8 USD Billion in 2024 and estimated to grow to 2.6 USD Billion, encompasses strategies aimed at enhancing personal well-being and preventing diseases through optimized nutrition. This application illustrates a significant interest in maximizing health potential and longevity, positioning it as a vital segment in the <a href="https://www.marketresearchfuture.com/reports/nutrigenomics-market-4009">Nutrigenomics</a> landscape.</p>
Nutrigenomics Market End Use Insights
<p>Dietary Supplements </p>
<p>The Global Nutrigenomics Market is poised for significant growth, with an expected valuation of 0.68 billion USD in 2024, rising to 2.5 billion USD by 2035. This market is driven by key trends such as personalized nutrition and the integration of advanced technologies in healthcare. Within the End Use segmentation, the Healthcare area is notable for leveraging genetic insights to tailor preventive measures and treatments, thus enhancing patient outcomes. </p>
<p>Dietary Supplements continue to play a vital role, as they are extensively used to address specific nutritional deficiencies based on genetic predispositions. The Food and Beverage sector is increasingly incorporating nutrigenomic principles to appeal to health-conscious consumers, offering products that align with individual dietary needs. Pharmaceuticals are also evolving, as drug development increasingly considers genetic factors to improve efficacy and reduce adverse effects. Collectively, these sectors contribute to the overall market dynamics, addressing the growing demand for personalized health solutions, informed by Global Nutrigenomics Market data and Statistics, which suggest a strong correlation between genetic information and nutrition habits.</p>
Nutrigenomics Market Product Type Insights
<p>The Global Nutrigenomics Market is poised to experience significant growth, with expectations that it will reach a valuation of 0.68 billion USD by 2024. This landscape is characterized by its diverse Product Type segmentation, which includes Genetic Testing Kits, Bioinformatics Tools, and Nutritional Analysis Software. Genetic Testing Kits play a crucial role in personalizing nutrition and lifestyle choices, enabling individuals to make informed decisions based on their genetic makeup. Bioinformatics Tools are essential for managing and analyzing large datasets, facilitating insights that drive advancements in nutritional genomics.</p>
<p>Nutritional Analysis Software is gaining traction as it aids in evaluating dietary patterns and integrating genetic data, proving vital for nutritionists and health professionals. Collectively, these segments contribute to the robust foundation of the Global Nutrigenomics Market, catering to an increasing demand for personalized nutrition solutions. As research and development in this field progresses, guided by the growing interest from individuals focused on health optimization, the opportunities for innovation within these segments continue to expand, thus enhancing their significance in the Global Nutrigenomics Market landscape.</p>
Nutrigenomics Market Technology Insights
<p>The Global Nutrigenomics Market, particularly within the Technology segment, has been experiencing substantial growth, projected to reach a valuation of 0.68 billion USD in 2024. This segment includes essential technologies such as DNA Sequencing, Microarray Analysis, and Polymerase Chain Reaction, which are pivotal in understanding genetic influences on nutritional responses. DNA Sequencing has significantly advanced personalized nutrition by facilitating detailed genetic insights that empower consumers to make informed dietary choices. Microarray Analysis plays a crucial role by enabling simultaneous examination of thousands of genes, providing a comprehensive view of genetic expression related to nutrition.</p>
<p>Polymerase Chain Reaction, known for its efficiency, is critical for amplifying specific DNA sequences, thus supporting various research and diagnostic applications in nutrigenomics. The combination of these technologies is driving a trend towards personalized health interventions, addressing the growing demand for tailored nutritional solutions globally. The market research collectively illustrates the dynamic nature of the Global Nutrigenomics Market statistics, showcasing its robust growth potential. With increasing consumer awareness of genetic health and nutrition, the industry is positioning itself for significant advancements and innovation.</p>
Get more detailed insights about Nutrigenomics Market Research Report - Global Forecast till 2035
Regional Insights
The Global Nutrigenomics Market is experiencing substantial growth across various regions, underscored by its projected valuation of 0.68 USD Billion in 2024. In this landscape, North America holds a majority share, represented by a valuation of 0.68 USD Billion, increasing to 4.05 USD Billion by 2035, highlighting its dominance driven by advanced healthcare systems and high consumer awareness. Following this, Europe is significant with a valuation of 0.95 USD Billion in 2024, growing to 3.05 USD Billion, supported by a robust healthcare framework and increasing R investments.
The APAC region is emerging as a notable contender, with current values at 0.7 USD Billion in 2024, expected to grow to 2.2 USD Billion, propelled by rising disposable income and health consciousness. Meanwhile, South America and MEA demonstrate lower valuations, at 0.3 USD Billion and 0.1 USD Billion respectively in 2024, but have considerable potential for growth in the coming years fueled by an increased focus on personalized nutrition and opportunities in local markets.This varied segmentation reflects a comprehensive look at how regional dynamics influence the overall Global Nutrigenomics Market progression.
Source: Primary Research, Secondary Research, Market Research Future Database and Analyst Review
Key Players and Competitive Insights
The Global Nutrigenomics Market represents a rapidly growing sector that combines nutrition and genomics to develop personalized dietary strategies based on individual genetic backgrounds. This market has gained traction as consumers increasingly seek to fine-tune their diets for optimal health and wellness. The competitive landscape is characterized by a diverse array of players, including biotechnology firms, nutritional supplement manufacturers, and research institutions. These entities leverage advancements in genetic research and bioinformatics to deliver targeted nutrigenomics solutions aimed at enhancing human health.
As the demand for personalized nutrition continues to rise, the market is witnessing significant investments in research and development, facilitating innovation and fostering collaboration amongst companies, which further enriches the competitive dynamics within this evolving space.Wellness Within is gaining traction in the Global Nutrigenomics Market through its focus on holistic health and personalized nutritional solutions.
The company emphasizes the integration of genetic data with lifestyle factors to create tailored dietary recommendations that address individual health needs. Its presence is marked by an extensive range of customized products and services that cater to various demographic segments. Wellness Within has established a niche by focusing on consumer education and community engagement, empowering individuals to make informed decisions about their health based on their genetic predispositions.
The company's strengths lie in its emphasis on quality, research-backed formulations, and its commitment to enhancing customer experiences through personalized service offerings, positioning it effectively within this competitive market.Metagenics, a key player in the Global Nutrigenomics Market, showcases its strength through a comprehensive portfolio of products that span dietary supplements, functional foods, and professional education resources.
The company is recognized for its innovative approach to nutrition, particularly its commitment to evidence-based research and the development of nutrigenomics solutions. Metagenics boasts a strong market presence in both direct-to-consumer and professional channels, further solidifying its reach. Key products include personalized amino acid formulations and nutraceutical solutions that address specific health concerns based on genetic insights. The company has also engaged in strategic mergers and acquisitions to expand its capabilities and enhance its product offerings globally, enabling it to maintain a competitive edge and respond effectively to evolving consumer demands in the nutrigenomics realm.
Key Companies in the Nutrigenomics Market market include


Industry Developments
Recent developments in the Global Nutrigenomics Market have shown significant growth and innovation among key players such as Wellness Within, Metagenics, and Nutrigenomix. In September 2023, Nutraceutical International Corporation further expanded its portfolio by acquiring nutritional product lines, enhancing its offerings in nutrigenomics. The global market is witnessing a rising demand for personalized nutrition, driven by advances in DNA analysis technologies, which has been pivotal in shaping product development strategies among companies like DNAfit and 23andMe. Furthermore, the collaboration of Genetics Unlocked and Genomatix in August 2022 to develop tools for genomic research has strengthened their market position.
The valuation of the nutrigenomics sector continues to rise, with estimates projecting significant growth due to increasing consumer awareness regarding health and wellness. In the past couple of years, events like the partnership between Youngevity International and Nutritional Genomics in May 2021 have also been crucial in enhancing data analytics and tailored nutrition solutions. Major happenings in this evolving market indicate a competitive landscape that is poised for substantial advancements in research and product innovation in the near future.
Future Outlook
Nutrigenomics Market Future Outlook
<p>The Global Nutrigenomics Market is poised for growth at 12.56% CAGR from 2024 to 2035, driven by advancements in personalized nutrition and increasing consumer awareness.</p>
New opportunities lie in:
- <p>Develop AI-driven platforms for personalized dietary recommendations. Invest in partnerships with healthcare providers for integrated nutrigenomic solutions. Create innovative nutraceutical products targeting specific genetic profiles.</p>
<p>By 2035, the Nutrigenomics Market is expected to achieve substantial growth, reflecting evolving consumer preferences and technological advancements.</p>
Market Segmentation
Outlook
- North America
- Europe
- South America
- Asia Pacific
- Middle East and Africa
Nutrigenomics Market End Use Outlook
- Healthcare
- Dietary Supplements
- FoodBeverage
- Pharmaceuticals
Nutrigenomics Market Regional Outlook
- North America
- Europe
- South America
- Asia Pacific
- Middle East and Africa
Nutrigenomics Market Technology Outlook
- DNA Sequencing
- Microarray Analysis
- Polymerase Chain Reaction
Nutrigenomics Market Application Outlook
- Personalized Nutrition
- Disease Prevention
- Health Optimization
- Fitness and Athletic Performance
Nutrigenomics Market Product Type Outlook
- Genetic Testing Kits
- Bioinformatics Tools
- Nutritional Analysis Software
Report Scope
Report Attribute/Metric Source: | Details |
MARKET SIZE 2023 | 0.5 (USD Billion) |
MARKET SIZE 2024 | 0.68 (USD Billion) |
MARKET SIZE 2035 | 2.5 (USD Billion) |
COMPOUND ANNUAL GROWTH RATE (CAGR) | 0.00% (2025 - 2035) |
REPORT COVERAGE | Revenue Forecast, Competitive Landscape, Growth Factors, and Trends |
BASE YEAR | 2024 |
MARKET FORECAST PERIOD | 2025 - 2035 |
HISTORICAL DATA | 2019 - 2023 |
MARKET FORECAST UNITS | USD Billion |
KEY COMPANIES PROFILED | Wellness Within, Metagenics, Youngevity International, Nutrigenomix, Nutraceutical International Corporation, Genetics Unlocked, Genomatix, Nutrigenomics Corporation, DNAfit, 23andMe, Nutritional Genomics, GeneSmart |
SEGMENTS COVERED | Application, End Use, Product Type, Technology, Regional |
KEY MARKET OPPORTUNITIES | Personalized nutrition solutions, Rising consumer health consciousness, Increased focus on preventive healthcare, Technological advancements in genomics, Collaborations with healthcare providers |
KEY MARKET DYNAMICS | Consumer awareness and education, Advancements in genomic technology, Personalized nutrition trends, Rising prevalence of chronic diseases, Increasing research funding and investments |
COUNTRIES COVERED | North America, Europe, APAC, South America, MEA |
Market Size 2024 | 0.23 |
Market Size 2025 | 0.26 |
Base Year | 2024 |
Market Forecast Period | 2025 - 2035 |
Market Highlights
Author
Latest Comments
This is a great article! Really helped me understand the topic better.
Thanks for sharing this. I’ve bookmarked it for later reference.
FAQs
What is the expected market size of the Global Nutrigenomics Market in 2024?
The Global Nutrigenomics Market is expected to be valued at 0.68 billion USD in 2024.
What is the projected market size of the Global Nutrigenomics Market by 2035?
By 2035, the Global Nutrigenomics Market is expected to reach a valuation of 2.5 billion USD.
What is the expected CAGR for the Global Nutrigenomics Market from 2025 to 2035?
The expected CAGR for the Global Nutrigenomics Market from 2025 to 2035 is 17.50% percent.
Which region is projected to have the largest market share in the Global Nutrigenomics Market in 2024?
In 2024, North America is projected to have the largest market share, valued at 0.68 billion USD.
What will be the market size of the Personalized Nutrition segment in 2035?
The Personalized Nutrition segment is expected to have a market size of 3.5 billion USD by 2035.
What is the market size of the Fitness and Athletic Performance application in 2024?
The Fitness and Athletic Performance application is valued at 0.68 billion USD in 2024.
Who are the key players in the Global Nutrigenomics Market?
Some of the key players include Wellness Within, Metagenics, Youngevity International, and Nutrigenomix.
What is the projected market size of the Disease Prevention application by 2035?
The Disease Prevention application is anticipated to reach a market size of 3.0 billion USD by 2035.
Which region is expected to show significant growth by 2035?
The APAC region is expected to show significant growth, reaching a market size of 2.5 billion USD by 2035.
What will be the value of the Health Optimization segment in 2024?
In 2024, the Health Optimization segment is valued at 0.68 billion USD.
-
--- "Table of Contents
-
Executive Summary
- Market Overview
- Key Findings
- Market Segmentation
- Competitive Landscape
- Challenges and Opportunities
- Future Outlook
-
Market Introduction
- Definition
-
Scope of the Study
- Research Objective
- Assumption
- Limitations
-
Research Methodology
- Overview
- Data Mining
- Secondary Research
-
Primary Research
- Primary Interviews and Information Gathering Process
- Breakdown of Primary Respondents
- Forecasting Model
-
Market Size Estimation
- Bottom-up Approach
- Top-Down Approach
- Data Triangulation
- Validation
-
MARKET DYNAMICS
- Overview
- Drivers
- Restraints
- Opportunities
-
MARKET FACTOR ANALYSIS
- Value chain Analysis
-
Porter's Five Forces Analysis
- Bargaining Power of Suppliers
- Bargaining Power of Buyers
- Threat of New Entrants
- Threat of Substitutes
- Intensity of Rivalry
-
COVID-19 Impact Analysis
- Market Impact Analysis
- Regional Impact
- Opportunity and Threat Analysis
-
NUTRIGENOMICS MARKET, BY APPLICATION (USD BILLION)
- Personalized Nutrition
- Disease Prevention
- Health Optimization
- Fitness and Athletic Performance
-
NUTRIGENOMICS MARKET, BY END USE (USD BILLION)
- Healthcare
- Dietary Supplements
- Food Beverage
- Pharmaceuticals
-
NUTRIGENOMICS MARKET, BY PRODUCT TYPE (USD BILLION)
- Genetic Testing Kits
- Bioinformatics Tools
- Nutritional Analysis Software
-
NUTRIGENOMICS MARKET, BY TECHNOLOGY (USD BILLION)
- DNA Sequencing
- Microarray Analysis
- Polymerase Chain Reaction
-
NUTRIGENOMICS MARKET, BY REGIONAL (USD BILLION)
-
North America
- US
- Canada
-
Europe
- Germany
- UK
- France
- Russia
- Italy
- Spain
- Rest of Europe
-
APAC
- China
- India
- Japan
- South Korea
- Malaysia
- Thailand
- Indonesia
- Rest of APAC
-
South America
- Brazil
- Mexico
- Argentina
- Rest of South America
-
MEA
- GCC Countries
- South Africa
- Rest of MEA
-
North America
-
Competitive Landscape
- Overview
- Competitive Analysis
- Market share Analysis
- Major Growth Strategy in the Nutrigenomics Market
- Competitive Benchmarking
- Leading Players in Terms of Number of Developments in the Nutrigenomics Market
-
Key developments and growth strategies
- New Product Launch/Service Deployment
- Merger Acquisitions
- Joint Ventures
-
Major Players Financial Matrix
- Sales and Operating Income
- Major Players RD Expenditure. 2023
-
COMPANY PROFILES
-
Wellness Within
- Financial Overview
- Products Offered
- Key Developments
- SWOT Analysis
- Key Strategies
-
Metagenics
- Financial Overview
- Products Offered
- Key Developments
- SWOT Analysis
- Key Strategies
-
Youngevity International
- Financial Overview
- Products Offered
- Key Developments
- SWOT Analysis
- Key Strategies
-
Nutrigenomix
- Financial Overview
- Products Offered
- Key Developments
- SWOT Analysis
- Key Strategies
-
Nutraceutical International Corporation
- Financial Overview
- Products Offered
- Key Developments
- SWOT Analysis
- Key Strategies
-
Genetics Unlocked
- Financial Overview
- Products Offered
- Key Developments
- SWOT Analysis
- Key Strategies
-
Genomatix
- Financial Overview
- Products Offered
- Key Developments
- SWOT Analysis
- Key Strategies
-
Nutrigenomics Corporation
- Financial Overview
- Products Offered
- Key Developments
- SWOT Analysis
- Key Strategies
-
DNAfit
- Financial Overview
- Products Offered
- Key Developments
- SWOT Analysis
- Key Strategies
-
23andMe
- Financial Overview
- Products Offered
- Key Developments
- SWOT Analysis
- Key Strategies
-
Nutritional Genomics
- Financial Overview
- Products Offered
- Key Developments
- SWOT Analysis
- Key Strategies
-
GeneSmart
- Financial Overview
- Products Offered
- Key Developments
- SWOT Analysis
- Key Strategies
-
Wellness Within
-
APPENDIX
- References
- Related Reports
-
List of Tables and Figures
- LIST OF TABLES
- TABLE 1. LIST OF ASSUMPTIONS
- TABLE 2. NORTH AMERICA NUTRIGENOMICS MARKET SIZE ESTIMATES & FORECAST, BY APPLICATION, 2019-2035 (USD BILLIONS)
- TABLE 3. NORTH AMERICA NUTRIGENOMICS MARKET SIZE ESTIMATES & FORECAST, BY END USE, 2019-2035 (USD BILLIONS)
- TABLE 4. NORTH AMERICA NUTRIGENOMICS MARKET SIZE ESTIMATES & FORECAST, BY PRODUCT TYPE, 2019-2035 (USD BILLIONS)
- TABLE 5. NORTH AMERICA NUTRIGENOMICS MARKET SIZE ESTIMATES & FORECAST, BY TECHNOLOGY, 2019-2035 (USD BILLIONS)
- TABLE 6. NORTH AMERICA NUTRIGENOMICS MARKET SIZE ESTIMATES & FORECAST, BY REGIONAL, 2019-2035 (USD BILLIONS)
- TABLE 7. US NUTRIGENOMICS MARKET SIZE ESTIMATES & FORECAST, BY APPLICATION, 2019-2035 (USD BILLIONS)
- TABLE 8. US NUTRIGENOMICS MARKET SIZE ESTIMATES & FORECAST, BY END USE, 2019-2035 (USD BILLIONS)
- TABLE 9. US NUTRIGENOMICS MARKET SIZE ESTIMATES & FORECAST, BY PRODUCT TYPE, 2019-2035 (USD BILLIONS)
- TABLE 10. US NUTRIGENOMICS MARKET SIZE ESTIMATES & FORECAST, BY TECHNOLOGY, 2019-2035 (USD BILLIONS)
- TABLE 11. US NUTRIGENOMICS MARKET SIZE ESTIMATES & FORECAST, BY REGIONAL, 2019-2035 (USD BILLIONS)
- TABLE 12. CANADA NUTRIGENOMICS MARKET SIZE ESTIMATES & FORECAST, BY APPLICATION, 2019-2035 (USD BILLIONS)
- TABLE 13. CANADA NUTRIGENOMICS MARKET SIZE ESTIMATES & FORECAST, BY END USE, 2019-2035 (USD BILLIONS)
- TABLE 14. CANADA NUTRIGENOMICS MARKET SIZE ESTIMATES & FORECAST, BY PRODUCT TYPE, 2019-2035 (USD BILLIONS)
- TABLE 15. CANADA NUTRIGENOMICS MARKET SIZE ESTIMATES & FORECAST, BY TECHNOLOGY, 2019-2035 (USD BILLIONS)
- TABLE 16. CANADA NUTRIGENOMICS MARKET SIZE ESTIMATES & FORECAST, BY REGIONAL, 2019-2035 (USD BILLIONS)
- TABLE 17. EUROPE NUTRIGENOMICS MARKET SIZE ESTIMATES & FORECAST, BY APPLICATION, 2019-2035 (USD BILLIONS)
- TABLE 18. EUROPE NUTRIGENOMICS MARKET SIZE ESTIMATES & FORECAST, BY END USE, 2019-2035 (USD BILLIONS)
- TABLE 19. EUROPE NUTRIGENOMICS MARKET SIZE ESTIMATES & FORECAST, BY PRODUCT TYPE, 2019-2035 (USD BILLIONS)
- TABLE 20. EUROPE NUTRIGENOMICS MARKET SIZE ESTIMATES & FORECAST, BY TECHNOLOGY, 2019-2035 (USD BILLIONS)
- TABLE 21. EUROPE NUTRIGENOMICS MARKET SIZE ESTIMATES & FORECAST, BY REGIONAL, 2019-2035 (USD BILLIONS)
- TABLE 22. GERMANY NUTRIGENOMICS MARKET SIZE ESTIMATES & FORECAST, BY APPLICATION, 2019-2035 (USD BILLIONS)
- TABLE 23. GERMANY NUTRIGENOMICS MARKET SIZE ESTIMATES & FORECAST, BY END USE, 2019-2035 (USD BILLIONS)
- TABLE 24. GERMANY NUTRIGENOMICS MARKET SIZE ESTIMATES & FORECAST, BY PRODUCT TYPE, 2019-2035 (USD BILLIONS)
- TABLE 25. GERMANY NUTRIGENOMICS MARKET SIZE ESTIMATES & FORECAST, BY TECHNOLOGY, 2019-2035 (USD BILLIONS)
- TABLE 26. GERMANY NUTRIGENOMICS MARKET SIZE ESTIMATES & FORECAST, BY REGIONAL, 2019-2035 (USD BILLIONS)
- TABLE 27. UK NUTRIGENOMICS MARKET SIZE ESTIMATES & FORECAST, BY APPLICATION, 2019-2035 (USD BILLIONS)
- TABLE 28. UK NUTRIGENOMICS MARKET SIZE ESTIMATES & FORECAST, BY END USE, 2019-2035 (USD BILLIONS)
- TABLE 29. UK NUTRIGENOMICS MARKET SIZE ESTIMATES & FORECAST, BY PRODUCT TYPE, 2019-2035 (USD BILLIONS)
- TABLE 30. UK NUTRIGENOMICS MARKET SIZE ESTIMATES & FORECAST, BY TECHNOLOGY, 2019-2035 (USD BILLIONS)
- TABLE 31. UK NUTRIGENOMICS MARKET SIZE ESTIMATES & FORECAST, BY REGIONAL, 2019-2035 (USD BILLIONS)
- TABLE 32. FRANCE NUTRIGENOMICS MARKET SIZE ESTIMATES & FORECAST, BY APPLICATION, 2019-2035 (USD BILLIONS)
- TABLE 33. FRANCE NUTRIGENOMICS MARKET SIZE ESTIMATES & FORECAST, BY END USE, 2019-2035 (USD BILLIONS)
- TABLE 34. FRANCE NUTRIGENOMICS MARKET SIZE ESTIMATES & FORECAST, BY PRODUCT TYPE, 2019-2035 (USD BILLIONS)
- TABLE 35. FRANCE NUTRIGENOMICS MARKET SIZE ESTIMATES & FORECAST, BY TECHNOLOGY, 2019-2035 (USD BILLIONS)
- TABLE 36. FRANCE NUTRIGENOMICS MARKET SIZE ESTIMATES & FORECAST, BY REGIONAL, 2019-2035 (USD BILLIONS)
- TABLE 37. RUSSIA NUTRIGENOMICS MARKET SIZE ESTIMATES & FORECAST, BY APPLICATION, 2019-2035 (USD BILLIONS)
- TABLE 38. RUSSIA NUTRIGENOMICS MARKET SIZE ESTIMATES & FORECAST, BY END USE, 2019-2035 (USD BILLIONS)
- TABLE 39. RUSSIA NUTRIGENOMICS MARKET SIZE ESTIMATES & FORECAST, BY PRODUCT TYPE, 2019-2035 (USD BILLIONS)
- TABLE 40. RUSSIA NUTRIGENOMICS MARKET SIZE ESTIMATES & FORECAST, BY TECHNOLOGY, 2019-2035 (USD BILLIONS)
- TABLE 41. RUSSIA NUTRIGENOMICS MARKET SIZE ESTIMATES & FORECAST, BY REGIONAL, 2019-2035 (USD BILLIONS)
- TABLE 42. ITALY NUTRIGENOMICS MARKET SIZE ESTIMATES & FORECAST, BY APPLICATION, 2019-2035 (USD BILLIONS)
- TABLE 43. ITALY NUTRIGENOMICS MARKET SIZE ESTIMATES & FORECAST, BY END USE, 2019-2035 (USD BILLIONS)
- TABLE 44. ITALY NUTRIGENOMICS MARKET SIZE ESTIMATES & FORECAST, BY PRODUCT TYPE, 2019-2035 (USD BILLIONS)
- TABLE 45. ITALY NUTRIGENOMICS MARKET SIZE ESTIMATES & FORECAST, BY TECHNOLOGY, 2019-2035 (USD BILLIONS)
- TABLE 46. ITALY NUTRIGENOMICS MARKET SIZE ESTIMATES & FORECAST, BY REGIONAL, 2019-2035 (USD BILLIONS)
- TABLE 47. SPAIN NUTRIGENOMICS MARKET SIZE ESTIMATES & FORECAST, BY APPLICATION, 2019-2035 (USD BILLIONS)
- TABLE 48. SPAIN NUTRIGENOMICS MARKET SIZE ESTIMATES & FORECAST, BY END USE, 2019-2035 (USD BILLIONS)
- TABLE 49. SPAIN NUTRIGENOMICS MARKET SIZE ESTIMATES & FORECAST, BY PRODUCT TYPE, 2019-2035 (USD BILLIONS)
- TABLE 50. SPAIN NUTRIGENOMICS MARKET SIZE ESTIMATES & FORECAST, BY TECHNOLOGY, 2019-2035 (USD BILLIONS)
- TABLE 51. SPAIN NUTRIGENOMICS MARKET SIZE ESTIMATES & FORECAST, BY REGIONAL, 2019-2035 (USD BILLIONS)
- TABLE 52. REST OF EUROPE NUTRIGENOMICS MARKET SIZE ESTIMATES & FORECAST, BY APPLICATION, 2019-2035 (USD BILLIONS)
- TABLE 53. REST OF EUROPE NUTRIGENOMICS MARKET SIZE ESTIMATES & FORECAST, BY END USE, 2019-2035 (USD BILLIONS)
- TABLE 54. REST OF EUROPE NUTRIGENOMICS MARKET SIZE ESTIMATES & FORECAST, BY PRODUCT TYPE, 2019-2035 (USD BILLIONS)
- TABLE 55. REST OF EUROPE NUTRIGENOMICS MARKET SIZE ESTIMATES & FORECAST, BY TECHNOLOGY, 2019-2035 (USD BILLIONS)
- TABLE 56. REST OF EUROPE NUTRIGENOMICS MARKET SIZE ESTIMATES & FORECAST, BY REGIONAL, 2019-2035 (USD BILLIONS)
- TABLE 57. APAC NUTRIGENOMICS MARKET SIZE ESTIMATES & FORECAST, BY APPLICATION, 2019-2035 (USD BILLIONS)
- TABLE 58. APAC NUTRIGENOMICS MARKET SIZE ESTIMATES & FORECAST, BY END USE, 2019-2035 (USD BILLIONS)
- TABLE 59. APAC NUTRIGENOMICS MARKET SIZE ESTIMATES & FORECAST, BY PRODUCT TYPE, 2019-2035 (USD BILLIONS)
- TABLE 60. APAC NUTRIGENOMICS MARKET SIZE ESTIMATES & FORECAST, BY TECHNOLOGY, 2019-2035 (USD BILLIONS)
- TABLE 61. APAC NUTRIGENOMICS MARKET SIZE ESTIMATES & FORECAST, BY REGIONAL, 2019-2035 (USD BILLIONS)
- TABLE 62. CHINA NUTRIGENOMICS MARKET SIZE ESTIMATES & FORECAST, BY APPLICATION, 2019-2035 (USD BILLIONS)
- TABLE 63. CHINA NUTRIGENOMICS MARKET SIZE ESTIMATES & FORECAST, BY END USE, 2019-2035 (USD BILLIONS)
- TABLE 64. CHINA NUTRIGENOMICS MARKET SIZE ESTIMATES & FORECAST, BY PRODUCT TYPE, 2019-2035 (USD BILLIONS)
- TABLE 65. CHINA NUTRIGENOMICS MARKET SIZE ESTIMATES & FORECAST, BY TECHNOLOGY, 2019-2035 (USD BILLIONS)
- TABLE 66. CHINA NUTRIGENOMICS MARKET SIZE ESTIMATES & FORECAST, BY REGIONAL, 2019-2035 (USD BILLIONS)
- TABLE 67. INDIA NUTRIGENOMICS MARKET SIZE ESTIMATES & FORECAST, BY APPLICATION, 2019-2035 (USD BILLIONS)
- TABLE 68. INDIA NUTRIGENOMICS MARKET SIZE ESTIMATES & FORECAST, BY END USE, 2019-2035 (USD BILLIONS)
- TABLE 69. INDIA NUTRIGENOMICS MARKET SIZE ESTIMATES & FORECAST, BY PRODUCT TYPE, 2019-2035 (USD BILLIONS)
- TABLE 70. INDIA NUTRIGENOMICS MARKET SIZE ESTIMATES & FORECAST, BY TECHNOLOGY, 2019-2035 (USD BILLIONS)
- TABLE 71. INDIA NUTRIGENOMICS MARKET SIZE ESTIMATES & FORECAST, BY REGIONAL, 2019-2035 (USD BILLIONS)
- TABLE 72. JAPAN NUTRIGENOMICS MARKET SIZE ESTIMATES & FORECAST, BY APPLICATION, 2019-2035 (USD BILLIONS)
- TABLE 73. JAPAN NUTRIGENOMICS MARKET SIZE ESTIMATES & FORECAST, BY END USE, 2019-2035 (USD BILLIONS)
- TABLE 74. JAPAN NUTRIGENOMICS MARKET SIZE ESTIMATES & FORECAST, BY PRODUCT TYPE, 2019-2035 (USD BILLIONS)
- TABLE 75. JAPAN NUTRIGENOMICS MARKET SIZE ESTIMATES & FORECAST, BY TECHNOLOGY, 2019-2035 (USD BILLIONS)
- TABLE 76. JAPAN NUTRIGENOMICS MARKET SIZE ESTIMATES & FORECAST, BY REGIONAL, 2019-2035 (USD BILLIONS)
- TABLE 77. SOUTH KOREA NUTRIGENOMICS MARKET SIZE ESTIMATES & FORECAST, BY APPLICATION, 2019-2035 (USD BILLIONS)
- TABLE 78. SOUTH KOREA NUTRIGENOMICS MARKET SIZE ESTIMATES & FORECAST, BY END USE, 2019-2035 (USD BILLIONS)
- TABLE 79. SOUTH KOREA NUTRIGENOMICS MARKET SIZE ESTIMATES & FORECAST, BY PRODUCT TYPE, 2019-2035 (USD BILLIONS)
- TABLE 80. SOUTH KOREA NUTRIGENOMICS MARKET SIZE ESTIMATES & FORECAST, BY TECHNOLOGY, 2019-2035 (USD BILLIONS)
- TABLE 81. SOUTH KOREA NUTRIGENOMICS MARKET SIZE ESTIMATES & FORECAST, BY REGIONAL, 2019-2035 (USD BILLIONS)
- TABLE 82. MALAYSIA NUTRIGENOMICS MARKET SIZE ESTIMATES & FORECAST, BY APPLICATION, 2019-2035 (USD BILLIONS)
- TABLE 83. MALAYSIA NUTRIGENOMICS MARKET SIZE ESTIMATES & FORECAST, BY END USE, 2019-2035 (USD BILLIONS)
- TABLE 84. MALAYSIA NUTRIGENOMICS MARKET SIZE ESTIMATES & FORECAST, BY PRODUCT TYPE, 2019-2035 (USD BILLIONS)
- TABLE 85. MALAYSIA NUTRIGENOMICS MARKET SIZE ESTIMATES & FORECAST, BY TECHNOLOGY, 2019-2035 (USD BILLIONS)
- TABLE 86. MALAYSIA NUTRIGENOMICS MARKET SIZE ESTIMATES & FORECAST, BY REGIONAL, 2019-2035 (USD BILLIONS)
- TABLE 87. THAILAND NUTRIGENOMICS MARKET SIZE ESTIMATES & FORECAST, BY APPLICATION, 2019-2035 (USD BILLIONS)
- TABLE 88. THAILAND NUTRIGENOMICS MARKET SIZE ESTIMATES & FORECAST, BY END USE, 2019-2035 (USD BILLIONS)
- TABLE 89. THAILAND NUTRIGENOMICS MARKET SIZE ESTIMATES & FORECAST, BY PRODUCT TYPE, 2019-2035 (USD BILLIONS)
- TABLE 90. THAILAND NUTRIGENOMICS MARKET SIZE ESTIMATES & FORECAST, BY TECHNOLOGY, 2019-2035 (USD BILLIONS)
- TABLE 91. THAILAND NUTRIGENOMICS MARKET SIZE ESTIMATES & FORECAST, BY REGIONAL, 2019-2035 (USD BILLIONS)
- TABLE 92. INDONESIA NUTRIGENOMICS MARKET SIZE ESTIMATES & FORECAST, BY APPLICATION, 2019-2035 (USD BILLIONS)
- TABLE 93. INDONESIA NUTRIGENOMICS MARKET SIZE ESTIMATES & FORECAST, BY END USE, 2019-2035 (USD BILLIONS)
- TABLE 94. INDONESIA NUTRIGENOMICS MARKET SIZE ESTIMATES & FORECAST, BY PRODUCT TYPE, 2019-2035 (USD BILLIONS)
- TABLE 95. INDONESIA NUTRIGENOMICS MARKET SIZE ESTIMATES & FORECAST, BY TECHNOLOGY, 2019-2035 (USD BILLIONS)
- TABLE 96. INDONESIA NUTRIGENOMICS MARKET SIZE ESTIMATES & FORECAST, BY REGIONAL, 2019-2035 (USD BILLIONS)
- TABLE 97. REST OF APAC NUTRIGENOMICS MARKET SIZE ESTIMATES & FORECAST, BY APPLICATION, 2019-2035 (USD BILLIONS)
- TABLE 98. REST OF APAC NUTRIGENOMICS MARKET SIZE ESTIMATES & FORECAST, BY END USE, 2019-2035 (USD BILLIONS)
- TABLE 99. REST OF APAC NUTRIGENOMICS MARKET SIZE ESTIMATES & FORECAST, BY PRODUCT TYPE, 2019-2035 (USD BILLIONS)
- TABLE 100. REST OF APAC NUTRIGENOMICS MARKET SIZE ESTIMATES & FORECAST, BY TECHNOLOGY, 2019-2035 (USD BILLIONS)
- TABLE 101. REST OF APAC NUTRIGENOMICS MARKET SIZE ESTIMATES & FORECAST, BY REGIONAL, 2019-2035 (USD BILLIONS)
- TABLE 102. SOUTH AMERICA NUTRIGENOMICS MARKET SIZE ESTIMATES & FORECAST, BY APPLICATION, 2019-2035 (USD BILLIONS)
- TABLE 103. SOUTH AMERICA NUTRIGENOMICS MARKET SIZE ESTIMATES & FORECAST, BY END USE, 2019-2035 (USD BILLIONS)
- TABLE 104. SOUTH AMERICA NUTRIGENOMICS MARKET SIZE ESTIMATES & FORECAST, BY PRODUCT TYPE, 2019-2035 (USD BILLIONS)
- TABLE 105. SOUTH AMERICA NUTRIGENOMICS MARKET SIZE ESTIMATES & FORECAST, BY TECHNOLOGY, 2019-2035 (USD BILLIONS)
- TABLE 106. SOUTH AMERICA NUTRIGENOMICS MARKET SIZE ESTIMATES & FORECAST, BY REGIONAL, 2019-2035 (USD BILLIONS)
- TABLE 107. BRAZIL NUTRIGENOMICS MARKET SIZE ESTIMATES & FORECAST, BY APPLICATION, 2019-2035 (USD BILLIONS)
- TABLE 108. BRAZIL NUTRIGENOMICS MARKET SIZE ESTIMATES & FORECAST, BY END USE, 2019-2035 (USD BILLIONS)
- TABLE 109. BRAZIL NUTRIGENOMICS MARKET SIZE ESTIMATES & FORECAST, BY PRODUCT TYPE, 2019-2035 (USD BILLIONS)
- TABLE 110. BRAZIL NUTRIGENOMICS MARKET SIZE ESTIMATES & FORECAST, BY TECHNOLOGY, 2019-2035 (USD BILLIONS)
- TABLE 111. BRAZIL NUTRIGENOMICS MARKET SIZE ESTIMATES & FORECAST, BY REGIONAL, 2019-2035 (USD BILLIONS)
- TABLE 112. MEXICO NUTRIGENOMICS MARKET SIZE ESTIMATES & FORECAST, BY APPLICATION, 2019-2035 (USD BILLIONS)
- TABLE 113. MEXICO NUTRIGENOMICS MARKET SIZE ESTIMATES & FORECAST, BY END USE, 2019-2035 (USD BILLIONS)
- TABLE 114. MEXICO NUTRIGENOMICS MARKET SIZE ESTIMATES & FORECAST, BY PRODUCT TYPE, 2019-2035 (USD BILLIONS)
- TABLE 115. MEXICO NUTRIGENOMICS MARKET SIZE ESTIMATES & FORECAST, BY TECHNOLOGY, 2019-2035 (USD BILLIONS)
- TABLE 116. MEXICO NUTRIGENOMICS MARKET SIZE ESTIMATES & FORECAST, BY REGIONAL, 2019-2035 (USD BILLIONS)
- TABLE 117. ARGENTINA NUTRIGENOMICS MARKET SIZE ESTIMATES & FORECAST, BY APPLICATION, 2019-2035 (USD BILLIONS)
- TABLE 118. ARGENTINA NUTRIGENOMICS MARKET SIZE ESTIMATES & FORECAST, BY END USE, 2019-2035 (USD BILLIONS)
- TABLE 119. ARGENTINA NUTRIGENOMICS MARKET SIZE ESTIMATES & FORECAST, BY PRODUCT TYPE, 2019-2035 (USD BILLIONS)
- TABLE 120. ARGENTINA NUTRIGENOMICS MARKET SIZE ESTIMATES & FORECAST, BY TECHNOLOGY, 2019-2035 (USD BILLIONS)
- TABLE 121. ARGENTINA NUTRIGENOMICS MARKET SIZE ESTIMATES & FORECAST, BY REGIONAL, 2019-2035 (USD BILLIONS)
- TABLE 122. REST OF SOUTH AMERICA NUTRIGENOMICS MARKET SIZE ESTIMATES & FORECAST, BY APPLICATION, 2019-2035 (USD BILLIONS)
- TABLE 123. REST OF SOUTH AMERICA NUTRIGENOMICS MARKET SIZE ESTIMATES & FORECAST, BY END USE, 2019-2035 (USD BILLIONS)
- TABLE 124. REST OF SOUTH AMERICA NUTRIGENOMICS MARKET SIZE ESTIMATES & FORECAST, BY PRODUCT TYPE, 2019-2035 (USD BILLIONS)
- TABLE 125. REST OF SOUTH AMERICA NUTRIGENOMICS MARKET SIZE ESTIMATES & FORECAST, BY TECHNOLOGY, 2019-2035 (USD BILLIONS)
- TABLE 126. REST OF SOUTH AMERICA NUTRIGENOMICS MARKET SIZE ESTIMATES & FORECAST, BY REGIONAL, 2019-2035 (USD BILLIONS)
- TABLE 127. MEA NUTRIGENOMICS MARKET SIZE ESTIMATES & FORECAST, BY APPLICATION, 2019-2035 (USD BILLIONS)
- TABLE 128. MEA NUTRIGENOMICS MARKET SIZE ESTIMATES & FORECAST, BY END USE, 2019-2035 (USD BILLIONS)
- TABLE 129. MEA NUTRIGENOMICS MARKET SIZE ESTIMATES & FORECAST, BY PRODUCT TYPE, 2019-2035 (USD BILLIONS)
- TABLE 130. MEA NUTRIGENOMICS MARKET SIZE ESTIMATES & FORECAST, BY TECHNOLOGY, 2019-2035 (USD BILLIONS)
- TABLE 131. MEA NUTRIGENOMICS MARKET SIZE ESTIMATES & FORECAST, BY REGIONAL, 2019-2035 (USD BILLIONS)
- TABLE 132. GCC COUNTRIES NUTRIGENOMICS MARKET SIZE ESTIMATES & FORECAST, BY APPLICATION, 2019-2035 (USD BILLIONS)
- TABLE 133. GCC COUNTRIES NUTRIGENOMICS MARKET SIZE ESTIMATES & FORECAST, BY END USE, 2019-2035 (USD BILLIONS)
- TABLE 134. GCC COUNTRIES NUTRIGENOMICS MARKET SIZE ESTIMATES & FORECAST, BY PRODUCT TYPE, 2019-2035 (USD BILLIONS)
- TABLE 135. GCC COUNTRIES NUTRIGENOMICS MARKET SIZE ESTIMATES & FORECAST, BY TECHNOLOGY, 2019-2035 (USD BILLIONS)
- TABLE 136. GCC COUNTRIES NUTRIGENOMICS MARKET SIZE ESTIMATES & FORECAST, BY REGIONAL, 2019-2035 (USD BILLIONS)
- TABLE 137. SOUTH AFRICA NUTRIGENOMICS MARKET SIZE ESTIMATES & FORECAST, BY APPLICATION, 2019-2035 (USD BILLIONS)
- TABLE 138. SOUTH AFRICA NUTRIGENOMICS MARKET SIZE ESTIMATES & FORECAST, BY END USE, 2019-2035 (USD BILLIONS)
- TABLE 139. SOUTH AFRICA NUTRIGENOMICS MARKET SIZE ESTIMATES & FORECAST, BY PRODUCT TYPE, 2019-2035 (USD BILLIONS)
- TABLE 140. SOUTH AFRICA NUTRIGENOMICS MARKET SIZE ESTIMATES & FORECAST, BY TECHNOLOGY, 2019-2035 (USD BILLIONS)
- TABLE 141. SOUTH AFRICA NUTRIGENOMICS MARKET SIZE ESTIMATES & FORECAST, BY REGIONAL, 2019-2035 (USD BILLIONS)
- TABLE 142. REST OF MEA NUTRIGENOMICS MARKET SIZE ESTIMATES & FORECAST, BY APPLICATION, 2019-2035 (USD BILLIONS)
- TABLE 143. REST OF MEA NUTRIGENOMICS MARKET SIZE ESTIMATES & FORECAST, BY END USE, 2019-2035 (USD BILLIONS)
- TABLE 144. REST OF MEA NUTRIGENOMICS MARKET SIZE ESTIMATES & FORECAST, BY PRODUCT TYPE, 2019-2035 (USD BILLIONS)
- TABLE 145. REST OF MEA NUTRIGENOMICS MARKET SIZE ESTIMATES & FORECAST, BY TECHNOLOGY, 2019-2035 (USD BILLIONS)
- TABLE 146. REST OF MEA NUTRIGENOMICS MARKET SIZE ESTIMATES & FORECAST, BY REGIONAL, 2019-2035 (USD BILLIONS)
- TABLE 147. PRODUCT LAUNCH/PRODUCT DEVELOPMENT/APPROVAL
- TABLE 148. ACQUISITION/PARTNERSHIP LIST OF FIGURES
- FIGURE 1. MARKET SYNOPSIS
- FIGURE 2. NORTH AMERICA NUTRIGENOMICS MARKET ANALYSIS
- FIGURE 3. US NUTRIGENOMICS MARKET ANALYSIS BY APPLICATION
- FIGURE 4. US NUTRIGENOMICS MARKET ANALYSIS BY END USE
- FIGURE 5. US NUTRIGENOMICS MARKET ANALYSIS BY PRODUCT TYPE
- FIGURE 6. US NUTRIGENOMICS MARKET ANALYSIS BY TECHNOLOGY
- FIGURE 7. US NUTRIGENOMICS MARKET ANALYSIS BY REGIONAL
- FIGURE 8. CANADA NUTRIGENOMICS MARKET ANALYSIS BY APPLICATION
- FIGURE 9. CANADA NUTRIGENOMICS MARKET ANALYSIS BY END USE
- FIGURE 10. CANADA NUTRIGENOMICS MARKET ANALYSIS BY PRODUCT TYPE
- FIGURE 11. CANADA NUTRIGENOMICS MARKET ANALYSIS BY TECHNOLOGY
- FIGURE 12. CANADA NUTRIGENOMICS MARKET ANALYSIS BY REGIONAL
- FIGURE 13. EUROPE NUTRIGENOMICS MARKET ANALYSIS
- FIGURE 14. GERMANY NUTRIGENOMICS MARKET ANALYSIS BY APPLICATION
- FIGURE 15. GERMANY NUTRIGENOMICS MARKET ANALYSIS BY END USE
- FIGURE 16. GERMANY NUTRIGENOMICS MARKET ANALYSIS BY PRODUCT TYPE
- FIGURE 17. GERMANY NUTRIGENOMICS MARKET ANALYSIS BY TECHNOLOGY
- FIGURE 18. GERMANY NUTRIGENOMICS MARKET ANALYSIS BY REGIONAL
- FIGURE 19. UK NUTRIGENOMICS MARKET ANALYSIS BY APPLICATION
- FIGURE 20. UK NUTRIGENOMICS MARKET ANALYSIS BY END USE
- FIGURE 21. UK NUTRIGENOMICS MARKET ANALYSIS BY PRODUCT TYPE
- FIGURE 22. UK NUTRIGENOMICS MARKET ANALYSIS BY TECHNOLOGY
- FIGURE 23. UK NUTRIGENOMICS MARKET ANALYSIS BY REGIONAL
- FIGURE 24. FRANCE NUTRIGENOMICS MARKET ANALYSIS BY APPLICATION
- FIGURE 25. FRANCE NUTRIGENOMICS MARKET ANALYSIS BY END USE
- FIGURE 26. FRANCE NUTRIGENOMICS MARKET ANALYSIS BY PRODUCT TYPE
- FIGURE 27. FRANCE NUTRIGENOMICS MARKET ANALYSIS BY TECHNOLOGY
- FIGURE 28. FRANCE NUTRIGENOMICS MARKET ANALYSIS BY REGIONAL
- FIGURE 29. RUSSIA NUTRIGENOMICS MARKET ANALYSIS BY APPLICATION
- FIGURE 30. RUSSIA NUTRIGENOMICS MARKET ANALYSIS BY END USE
- FIGURE 31. RUSSIA NUTRIGENOMICS MARKET ANALYSIS BY PRODUCT TYPE
- FIGURE 32. RUSSIA NUTRIGENOMICS MARKET ANALYSIS BY TECHNOLOGY
- FIGURE 33. RUSSIA NUTRIGENOMICS MARKET ANALYSIS BY REGIONAL
- FIGURE 34. ITALY NUTRIGENOMICS MARKET ANALYSIS BY APPLICATION
- FIGURE 35. ITALY NUTRIGENOMICS MARKET ANALYSIS BY END USE
- FIGURE 36. ITALY NUTRIGENOMICS MARKET ANALYSIS BY PRODUCT TYPE
- FIGURE 37. ITALY NUTRIGENOMICS MARKET ANALYSIS BY TECHNOLOGY
- FIGURE 38. ITALY NUTRIGENOMICS MARKET ANALYSIS BY REGIONAL
- FIGURE 39. SPAIN NUTRIGENOMICS MARKET ANALYSIS BY APPLICATION
- FIGURE 40. SPAIN NUTRIGENOMICS MARKET ANALYSIS BY END USE
- FIGURE 41. SPAIN NUTRIGENOMICS MARKET ANALYSIS BY PRODUCT TYPE
- FIGURE 42. SPAIN NUTRIGENOMICS MARKET ANALYSIS BY TECHNOLOGY
- FIGURE 43. SPAIN NUTRIGENOMICS MARKET ANALYSIS BY REGIONAL
- FIGURE 44. REST OF EUROPE NUTRIGENOMICS MARKET ANALYSIS BY APPLICATION
- FIGURE 45. REST OF EUROPE NUTRIGENOMICS MARKET ANALYSIS BY END USE
- FIGURE 46. REST OF EUROPE NUTRIGENOMICS MARKET ANALYSIS BY PRODUCT TYPE
- FIGURE 47. REST OF EUROPE NUTRIGENOMICS MARKET ANALYSIS BY TECHNOLOGY
- FIGURE 48. REST OF EUROPE NUTRIGENOMICS MARKET ANALYSIS BY REGIONAL
- FIGURE 49. APAC NUTRIGENOMICS MARKET ANALYSIS
- FIGURE 50. CHINA NUTRIGENOMICS MARKET ANALYSIS BY APPLICATION
- FIGURE 51. CHINA NUTRIGENOMICS MARKET ANALYSIS BY END USE
- FIGURE 52. CHINA NUTRIGENOMICS MARKET ANALYSIS BY PRODUCT TYPE
- FIGURE 53. CHINA NUTRIGENOMICS MARKET ANALYSIS BY TECHNOLOGY
- FIGURE 54. CHINA NUTRIGENOMICS MARKET ANALYSIS BY REGIONAL
- FIGURE 55. INDIA NUTRIGENOMICS MARKET ANALYSIS BY APPLICATION
- FIGURE 56. INDIA NUTRIGENOMICS MARKET ANALYSIS BY END USE
- FIGURE 57. INDIA NUTRIGENOMICS MARKET ANALYSIS BY PRODUCT TYPE
- FIGURE 58. INDIA NUTRIGENOMICS MARKET ANALYSIS BY TECHNOLOGY
- FIGURE 59. INDIA NUTRIGENOMICS MARKET ANALYSIS BY REGIONAL
- FIGURE 60. JAPAN NUTRIGENOMICS MARKET ANALYSIS BY APPLICATION
- FIGURE 61. JAPAN NUTRIGENOMICS MARKET ANALYSIS BY END USE
- FIGURE 62. JAPAN NUTRIGENOMICS MARKET ANALYSIS BY PRODUCT TYPE
- FIGURE 63. JAPAN NUTRIGENOMICS MARKET ANALYSIS BY TECHNOLOGY
- FIGURE 64. JAPAN NUTRIGENOMICS MARKET ANALYSIS BY REGIONAL
- FIGURE 65. SOUTH KOREA NUTRIGENOMICS MARKET ANALYSIS BY APPLICATION
- FIGURE 66. SOUTH KOREA NUTRIGENOMICS MARKET ANALYSIS BY END USE
- FIGURE 67. SOUTH KOREA NUTRIGENOMICS MARKET ANALYSIS BY PRODUCT TYPE
- FIGURE 68. SOUTH KOREA NUTRIGENOMICS MARKET ANALYSIS BY TECHNOLOGY
- FIGURE 69. SOUTH KOREA NUTRIGENOMICS MARKET ANALYSIS BY REGIONAL
- FIGURE 70. MALAYSIA NUTRIGENOMICS MARKET ANALYSIS BY APPLICATION
- FIGURE 71. MALAYSIA NUTRIGENOMICS MARKET ANALYSIS BY END USE
- FIGURE 72. MALAYSIA NUTRIGENOMICS MARKET ANALYSIS BY PRODUCT TYPE
- FIGURE 73. MALAYSIA NUTRIGENOMICS MARKET ANALYSIS BY TECHNOLOGY
- FIGURE 74. MALAYSIA NUTRIGENOMICS MARKET ANALYSIS BY REGIONAL
- FIGURE 75. THAILAND NUTRIGENOMICS MARKET ANALYSIS BY APPLICATION
- FIGURE 76. THAILAND NUTRIGENOMICS MARKET ANALYSIS BY END USE
- FIGURE 77. THAILAND NUTRIGENOMICS MARKET ANALYSIS BY PRODUCT TYPE
- FIGURE 78. THAILAND NUTRIGENOMICS MARKET ANALYSIS BY TECHNOLOGY
- FIGURE 79. THAILAND NUTRIGENOMICS MARKET ANALYSIS BY REGIONAL
- FIGURE 80. INDONESIA NUTRIGENOMICS MARKET ANALYSIS BY APPLICATION
- FIGURE 81. INDONESIA NUTRIGENOMICS MARKET ANALYSIS BY END USE
- FIGURE 82. INDONESIA NUTRIGENOMICS MARKET ANALYSIS BY PRODUCT TYPE
- FIGURE 83. INDONESIA NUTRIGENOMICS MARKET ANALYSIS BY TECHNOLOGY
- FIGURE 84. INDONESIA NUTRIGENOMICS MARKET ANALYSIS BY REGIONAL
- FIGURE 85. REST OF APAC NUTRIGENOMICS MARKET ANALYSIS BY APPLICATION
- FIGURE 86. REST OF APAC NUTRIGENOMICS MARKET ANALYSIS BY END USE
- FIGURE 87. REST OF APAC NUTRIGENOMICS MARKET ANALYSIS BY PRODUCT TYPE
- FIGURE 88. REST OF APAC NUTRIGENOMICS MARKET ANALYSIS BY TECHNOLOGY
- FIGURE 89. REST OF APAC NUTRIGENOMICS MARKET ANALYSIS BY REGIONAL
- FIGURE 90. SOUTH AMERICA NUTRIGENOMICS MARKET ANALYSIS
- FIGURE 91. BRAZIL NUTRIGENOMICS MARKET ANALYSIS BY APPLICATION
- FIGURE 92. BRAZIL NUTRIGENOMICS MARKET ANALYSIS BY END USE
- FIGURE 93. BRAZIL NUTRIGENOMICS MARKET ANALYSIS BY PRODUCT TYPE
- FIGURE 94. BRAZIL NUTRIGENOMICS MARKET ANALYSIS BY TECHNOLOGY
- FIGURE 95. BRAZIL NUTRIGENOMICS MARKET ANALYSIS BY REGIONAL
- FIGURE 96. MEXICO NUTRIGENOMICS MARKET ANALYSIS BY APPLICATION
- FIGURE 97. MEXICO NUTRIGENOMICS MARKET ANALYSIS BY END USE
- FIGURE 98. MEXICO NUTRIGENOMICS MARKET ANALYSIS BY PRODUCT TYPE
- FIGURE 99. MEXICO NUTRIGENOMICS MARKET ANALYSIS BY TECHNOLOGY
- FIGURE 100. MEXICO NUTRIGENOMICS MARKET ANALYSIS BY REGIONAL
- FIGURE 101. ARGENTINA NUTRIGENOMICS MARKET ANALYSIS BY APPLICATION
- FIGURE 102. ARGENTINA NUTRIGENOMICS MARKET ANALYSIS BY END USE
- FIGURE 103. ARGENTINA NUTRIGENOMICS MARKET ANALYSIS BY PRODUCT TYPE
- FIGURE 104. ARGENTINA NUTRIGENOMICS MARKET ANALYSIS BY TECHNOLOGY
- FIGURE 105. ARGENTINA NUTRIGENOMICS MARKET ANALYSIS BY REGIONAL
- FIGURE 106. REST OF SOUTH AMERICA NUTRIGENOMICS MARKET ANALYSIS BY APPLICATION
- FIGURE 107. REST OF SOUTH AMERICA NUTRIGENOMICS MARKET ANALYSIS BY END USE
- FIGURE 108. REST OF SOUTH AMERICA NUTRIGENOMICS MARKET ANALYSIS BY PRODUCT TYPE
- FIGURE 109. REST OF SOUTH AMERICA NUTRIGENOMICS MARKET ANALYSIS BY TECHNOLOGY
- FIGURE 110. REST OF SOUTH AMERICA NUTRIGENOMICS MARKET ANALYSIS BY REGIONAL
- FIGURE 111. MEA NUTRIGENOMICS MARKET ANALYSIS
- FIGURE 112. GCC COUNTRIES NUTRIGENOMICS MARKET ANALYSIS BY APPLICATION
- FIGURE 113. GCC COUNTRIES NUTRIGENOMICS MARKET ANALYSIS BY END USE
- FIGURE 114. GCC COUNTRIES NUTRIGENOMICS MARKET ANALYSIS BY PRODUCT TYPE
- FIGURE 115. GCC COUNTRIES NUTRIGENOMICS MARKET ANALYSIS BY TECHNOLOGY
- FIGURE 116. GCC COUNTRIES NUTRIGENOMICS MARKET ANALYSIS BY REGIONAL
- FIGURE 117. SOUTH AFRICA NUTRIGENOMICS MARKET ANALYSIS BY APPLICATION
- FIGURE 118. SOUTH AFRICA NUTRIGENOMICS MARKET ANALYSIS BY END USE
- FIGURE 119. SOUTH AFRICA NUTRIGENOMICS MARKET ANALYSIS BY PRODUCT TYPE
- FIGURE 120. SOUTH AFRICA NUTRIGENOMICS MARKET ANALYSIS BY TECHNOLOGY
- FIGURE 121. SOUTH AFRICA NUTRIGENOMICS MARKET ANALYSIS BY REGIONAL
- FIGURE 122. REST OF MEA NUTRIGENOMICS MARKET ANALYSIS BY APPLICATION
- FIGURE 123. REST OF MEA NUTRIGENOMICS MARKET ANALYSIS BY END USE
- FIGURE 124. REST OF MEA NUTRIGENOMICS MARKET ANALYSIS BY PRODUCT TYPE
- FIGURE 125. REST OF MEA NUTRIGENOMICS MARKET ANALYSIS BY TECHNOLOGY
- FIGURE 126. REST OF MEA NUTRIGENOMICS MARKET ANALYSIS BY REGIONAL
- FIGURE 127. KEY BUYING CRITERIA OF NUTRIGENOMICS MARKET
- FIGURE 128. RESEARCH PROCESS OF MRFR
- FIGURE 129. DRO ANALYSIS OF NUTRIGENOMICS MARKET
- FIGURE 130. DRIVERS IMPACT ANALYSIS: NUTRIGENOMICS MARKET
- FIGURE 131. RESTRAINTS IMPACT ANALYSIS: NUTRIGENOMICS MARKET
- FIGURE 132. SUPPLY / VALUE CHAIN: NUTRIGENOMICS MARKET
- FIGURE 133. NUTRIGENOMICS MARKET, BY APPLICATION, 2025 (% SHARE)
- FIGURE 134. NUTRIGENOMICS MARKET, BY APPLICATION, 2019 TO 2035 (USD Billions)
- FIGURE 135. NUTRIGENOMICS MARKET, BY END USE, 2025 (% SHARE)
- FIGURE 136. NUTRIGENOMICS MARKET, BY END USE, 2019 TO 2035 (USD Billions)
- FIGURE 137. NUTRIGENOMICS MARKET, BY PRODUCT TYPE, 2025 (% SHARE)
- FIGURE 138. NUTRIGENOMICS MARKET, BY PRODUCT TYPE, 2019 TO 2035 (USD Billions)
- FIGURE 139. NUTRIGENOMICS MARKET, BY TECHNOLOGY, 2025 (% SHARE)
- FIGURE 140. NUTRIGENOMICS MARKET, BY TECHNOLOGY, 2019 TO 2035 (USD Billions)
- FIGURE 141. NUTRIGENOMICS MARKET, BY REGIONAL, 2025 (% SHARE)
- FIGURE 142. NUTRIGENOMICS MARKET, BY REGIONAL, 2019 TO 2035 (USD Billions)
- FIGURE 143. BENCHMARKING OF MAJOR COMPETITORS "
Nutrigenomics Market Segmentation
Nutrigenomics Market By Application (USD Billion, 2019-2035)
Personalized Nutrition
Disease Prevention
Health Optimization
Fitness and Athletic Performance
Nutrigenomics Market By End Use (USD Billion, 2019-2035)
Healthcare
Dietary Supplements
Food Beverage
Pharmaceuticals
Nutrigenomics Market By Product Type (USD Billion, 2019-2035)
Genetic Testing Kits
Bioinformatics Tools
Nutritional Analysis Software
Nutrigenomics Market By Technology (USD Billion, 2019-2035)
DNA Sequencing
Microarray Analysis
Polymerase Chain Reaction
Nutrigenomics Market By Regional (USD Billion, 2019-2035)
North America
Europe
South America
Asia Pacific
Middle East and Africa
Nutrigenomics Market Regional Outlook (USD Billion, 2019-2035)
North America Outlook (USD Billion, 2019-2035)
North America Nutrigenomics Market by Application Type
Personalized Nutrition
Disease Prevention
Health Optimization
Fitness and Athletic Performance
North America Nutrigenomics Market by End Use Type
Healthcare
Dietary Supplements
Food Beverage
Pharmaceuticals
North America Nutrigenomics Market by Product Type
Genetic Testing Kits
Bioinformatics Tools
Nutritional Analysis Software
North America Nutrigenomics Market by Technology Type
DNA Sequencing
Microarray Analysis
Polymerase Chain Reaction
North America Nutrigenomics Market by Regional Type
US
Canada
US Outlook (USD Billion, 2019-2035)
US Nutrigenomics Market by Application Type
Personalized Nutrition
Disease Prevention
Health Optimization
Fitness and Athletic Performance
US Nutrigenomics Market by End Use Type
Healthcare
Dietary Supplements
Food Beverage
Pharmaceuticals
US Nutrigenomics Market by Product Type
Genetic Testing Kits
Bioinformatics Tools
Nutritional Analysis Software
US Nutrigenomics Market by Technology Type
DNA Sequencing
Microarray Analysis
Polymerase Chain Reaction
CANADA Outlook (USD Billion, 2019-2035)
CANADA Nutrigenomics Market by Application Type
Personalized Nutrition
Disease Prevention
Health Optimization
Fitness and Athletic Performance
CANADA Nutrigenomics Market by End Use Type
Healthcare
Dietary Supplements
Food Beverage
Pharmaceuticals
CANADA Nutrigenomics Market by Product Type
Genetic Testing Kits
Bioinformatics Tools
Nutritional Analysis Software
CANADA Nutrigenomics Market by Technology Type
DNA Sequencing
Microarray Analysis
Polymerase Chain Reaction
Europe Outlook (USD Billion, 2019-2035)
Europe Nutrigenomics Market by Application Type
Personalized Nutrition
Disease Prevention
Health Optimization
Fitness and Athletic Performance
Europe Nutrigenomics Market by End Use Type
Healthcare
Dietary Supplements
Food Beverage
Pharmaceuticals
Europe Nutrigenomics Market by Product Type
Genetic Testing Kits
Bioinformatics Tools
Nutritional Analysis Software
Europe Nutrigenomics Market by Technology Type
DNA Sequencing
Microarray Analysis
Polymerase Chain Reaction
Europe Nutrigenomics Market by Regional Type
Germany
UK
France
Russia
Italy
Spain
Rest of Europe
GERMANY Outlook (USD Billion, 2019-2035)
GERMANY Nutrigenomics Market by Application Type
Personalized Nutrition
Disease Prevention
Health Optimization
Fitness and Athletic Performance
GERMANY Nutrigenomics Market by End Use Type
Healthcare
Dietary Supplements
Food Beverage
Pharmaceuticals
GERMANY Nutrigenomics Market by Product Type
Genetic Testing Kits
Bioinformatics Tools
Nutritional Analysis Software
GERMANY Nutrigenomics Market by Technology Type
DNA Sequencing
Microarray Analysis
Polymerase Chain Reaction
UK Outlook (USD Billion, 2019-2035)
UK Nutrigenomics Market by Application Type
Personalized Nutrition
Disease Prevention
Health Optimization
Fitness and Athletic Performance
UK Nutrigenomics Market by End Use Type
Healthcare
Dietary Supplements
Food Beverage
Pharmaceuticals
UK Nutrigenomics Market by Product Type
Genetic Testing Kits
Bioinformatics Tools
Nutritional Analysis Software
UK Nutrigenomics Market by Technology Type
DNA Sequencing
Microarray Analysis
Polymerase Chain Reaction
FRANCE Outlook (USD Billion, 2019-2035)
FRANCE Nutrigenomics Market by Application Type
Personalized Nutrition
Disease Prevention
Health Optimization
Fitness and Athletic Performance
FRANCE Nutrigenomics Market by End Use Type
Healthcare
Dietary Supplements
Food Beverage
Pharmaceuticals
FRANCE Nutrigenomics Market by Product Type
Genetic Testing Kits
Bioinformatics Tools
Nutritional Analysis Software
FRANCE Nutrigenomics Market by Technology Type
DNA Sequencing
Microarray Analysis
Polymerase Chain Reaction
RUSSIA Outlook (USD Billion, 2019-2035)
RUSSIA Nutrigenomics Market by Application Type
Personalized Nutrition
Disease Prevention
Health Optimization
Fitness and Athletic Performance
RUSSIA Nutrigenomics Market by End Use Type
Healthcare
Dietary Supplements
Food Beverage
Pharmaceuticals
RUSSIA Nutrigenomics Market by Product Type
Genetic Testing Kits
Bioinformatics Tools
Nutritional Analysis Software
RUSSIA Nutrigenomics Market by Technology Type
DNA Sequencing
Microarray Analysis
Polymerase Chain Reaction
ITALY Outlook (USD Billion, 2019-2035)
ITALY Nutrigenomics Market by Application Type
Personalized Nutrition
Disease Prevention
Health Optimization
Fitness and Athletic Performance
ITALY Nutrigenomics Market by End Use Type
Healthcare
Dietary Supplements
Food Beverage
Pharmaceuticals
ITALY Nutrigenomics Market by Product Type
Genetic Testing Kits
Bioinformatics Tools
Nutritional Analysis Software
ITALY Nutrigenomics Market by Technology Type
DNA Sequencing
Microarray Analysis
Polymerase Chain Reaction
SPAIN Outlook (USD Billion, 2019-2035)
SPAIN Nutrigenomics Market by Application Type
Personalized Nutrition
Disease Prevention
Health Optimization
Fitness and Athletic Performance
SPAIN Nutrigenomics Market by End Use Type
Healthcare
Dietary Supplements
Food Beverage
Pharmaceuticals
SPAIN Nutrigenomics Market by Product Type
Genetic Testing Kits
Bioinformatics Tools
Nutritional Analysis Software
SPAIN Nutrigenomics Market by Technology Type
DNA Sequencing
Microarray Analysis
Polymerase Chain Reaction
REST OF EUROPE Outlook (USD Billion, 2019-2035)
REST OF EUROPE Nutrigenomics Market by Application Type
Personalized Nutrition
Disease Prevention
Health Optimization
Fitness and Athletic Performance
REST OF EUROPE Nutrigenomics Market by End Use Type
Healthcare
Dietary Supplements
Food Beverage
Pharmaceuticals
REST OF EUROPE Nutrigenomics Market by Product Type
Genetic Testing Kits
Bioinformatics Tools
Nutritional Analysis Software
REST OF EUROPE Nutrigenomics Market by Technology Type
DNA Sequencing
Microarray Analysis
Polymerase Chain Reaction
APAC Outlook (USD Billion, 2019-2035)
APAC Nutrigenomics Market by Application Type
Personalized Nutrition
Disease Prevention
Health Optimization
Fitness and Athletic Performance
APAC Nutrigenomics Market by End Use Type
Healthcare
Dietary Supplements
Food Beverage
Pharmaceuticals
APAC Nutrigenomics Market by Product Type
Genetic Testing Kits
Bioinformatics Tools
Nutritional Analysis Software
APAC Nutrigenomics Market by Technology Type
DNA Sequencing
Microarray Analysis
Polymerase Chain Reaction
APAC Nutrigenomics Market by Regional Type
China
India
Japan
South Korea
Malaysia
Thailand
Indonesia
Rest of APAC
CHINA Outlook (USD Billion, 2019-2035)
CHINA Nutrigenomics Market by Application Type
Personalized Nutrition
Disease Prevention
Health Optimization
Fitness and Athletic Performance
CHINA Nutrigenomics Market by End Use Type
Healthcare
Dietary Supplements
Food Beverage
Pharmaceuticals
CHINA Nutrigenomics Market by Product Type
Genetic Testing Kits
Bioinformatics Tools
Nutritional Analysis Software
CHINA Nutrigenomics Market by Technology Type
DNA Sequencing
Microarray Analysis
Polymerase Chain Reaction
INDIA Outlook (USD Billion, 2019-2035)
INDIA Nutrigenomics Market by Application Type
Personalized Nutrition
Disease Prevention
Health Optimization
Fitness and Athletic Performance
INDIA Nutrigenomics Market by End Use Type
Healthcare
Dietary Supplements
Food Beverage
Pharmaceuticals
INDIA Nutrigenomics Market by Product Type
Genetic Testing Kits
Bioinformatics Tools
Nutritional Analysis Software
INDIA Nutrigenomics Market by Technology Type
DNA Sequencing
Microarray Analysis
Polymerase Chain Reaction
JAPAN Outlook (USD Billion, 2019-2035)
JAPAN Nutrigenomics Market by Application Type
Personalized Nutrition
Disease Prevention
Health Optimization
Fitness and Athletic Performance
JAPAN Nutrigenomics Market by End Use Type
Healthcare
Dietary Supplements
Food Beverage
Pharmaceuticals
JAPAN Nutrigenomics Market by Product Type
Genetic Testing Kits
Bioinformatics Tools
Nutritional Analysis Software
JAPAN Nutrigenomics Market by Technology Type
DNA Sequencing
Microarray Analysis
Polymerase Chain Reaction
SOUTH KOREA Outlook (USD Billion, 2019-2035)
SOUTH KOREA Nutrigenomics Market by Application Type
Personalized Nutrition
Disease Prevention
Health Optimization
Fitness and Athletic Performance
SOUTH KOREA Nutrigenomics Market by End Use Type
Healthcare
Dietary Supplements
Food Beverage
Pharmaceuticals
SOUTH KOREA Nutrigenomics Market by Product Type
Genetic Testing Kits
Bioinformatics Tools
Nutritional Analysis Software
SOUTH KOREA Nutrigenomics Market by Technology Type
DNA Sequencing
Microarray Analysis
Polymerase Chain Reaction
MALAYSIA Outlook (USD Billion, 2019-2035)
MALAYSIA Nutrigenomics Market by Application Type
Personalized Nutrition
Disease Prevention
Health Optimization
Fitness and Athletic Performance
MALAYSIA Nutrigenomics Market by End Use Type
Healthcare
Dietary Supplements
Food Beverage
Pharmaceuticals
MALAYSIA Nutrigenomics Market by Product Type
Genetic Testing Kits
Bioinformatics Tools
Nutritional Analysis Software
MALAYSIA Nutrigenomics Market by Technology Type
DNA Sequencing
Microarray Analysis
Polymerase Chain Reaction
THAILAND Outlook (USD Billion, 2019-2035)
THAILAND Nutrigenomics Market by Application Type
Personalized Nutrition
Disease Prevention
Health Optimization
Fitness and Athletic Performance
THAILAND Nutrigenomics Market by End Use Type
Healthcare
Dietary Supplements
Food Beverage
Pharmaceuticals
THAILAND Nutrigenomics Market by Product Type
Genetic Testing Kits
Bioinformatics Tools
Nutritional Analysis Software
THAILAND Nutrigenomics Market by Technology Type
DNA Sequencing
Microarray Analysis
Polymerase Chain Reaction
INDONESIA Outlook (USD Billion, 2019-2035)
INDONESIA Nutrigenomics Market by Application Type
Personalized Nutrition
Disease Prevention
Health Optimization
Fitness and Athletic Performance
INDONESIA Nutrigenomics Market by End Use Type
Healthcare
Dietary Supplements
Food Beverage
Pharmaceuticals
INDONESIA Nutrigenomics Market by Product Type
Genetic Testing Kits
Bioinformatics Tools
Nutritional Analysis Software
INDONESIA Nutrigenomics Market by Technology Type
DNA Sequencing
Microarray Analysis
Polymerase Chain Reaction
REST OF APAC Outlook (USD Billion, 2019-2035)
REST OF APAC Nutrigenomics Market by Application Type
Personalized Nutrition
Disease Prevention
Health Optimization
Fitness and Athletic Performance
REST OF APAC Nutrigenomics Market by End Use Type
Healthcare
Dietary Supplements
Food Beverage
Pharmaceuticals
REST OF APAC Nutrigenomics Market by Product Type
Genetic Testing Kits
Bioinformatics Tools
Nutritional Analysis Software
REST OF APAC Nutrigenomics Market by Technology Type
DNA Sequencing
Microarray Analysis
Polymerase Chain Reaction
South America Outlook (USD Billion, 2019-2035)
South America Nutrigenomics Market by Application Type
Personalized Nutrition
Disease Prevention
Health Optimization
Fitness and Athletic Performance
South America Nutrigenomics Market by End Use Type
Healthcare
Dietary Supplements
Food Beverage
Pharmaceuticals
South America Nutrigenomics Market by Product Type
Genetic Testing Kits
Bioinformatics Tools
Nutritional Analysis Software
South America Nutrigenomics Market by Technology Type
DNA Sequencing
Microarray Analysis
Polymerase Chain Reaction
South America Nutrigenomics Market by Regional Type
Brazil
Mexico
Argentina
Rest of South America
BRAZIL Outlook (USD Billion, 2019-2035)
BRAZIL Nutrigenomics Market by Application Type
Personalized Nutrition
Disease Prevention
Health Optimization
Fitness and Athletic Performance
BRAZIL Nutrigenomics Market by End Use Type
Healthcare
Dietary Supplements
Food Beverage
Pharmaceuticals
BRAZIL Nutrigenomics Market by Product Type
Genetic Testing Kits
Bioinformatics Tools
Nutritional Analysis Software
BRAZIL Nutrigenomics Market by Technology Type
DNA Sequencing
Microarray Analysis
Polymerase Chain Reaction
MEXICO Outlook (USD Billion, 2019-2035)
MEXICO Nutrigenomics Market by Application Type
Personalized Nutrition
Disease Prevention
Health Optimization
Fitness and Athletic Performance
MEXICO Nutrigenomics Market by End Use Type
Healthcare
Dietary Supplements
Food Beverage
Pharmaceuticals
MEXICO Nutrigenomics Market by Product Type
Genetic Testing Kits
Bioinformatics Tools
Nutritional Analysis Software
MEXICO Nutrigenomics Market by Technology Type
DNA Sequencing
Microarray Analysis
Polymerase Chain Reaction
ARGENTINA Outlook (USD Billion, 2019-2035)
ARGENTINA Nutrigenomics Market by Application Type
Personalized Nutrition
Disease Prevention
Health Optimization
Fitness and Athletic Performance
ARGENTINA Nutrigenomics Market by End Use Type
Healthcare
Dietary Supplements
Food Beverage
Pharmaceuticals
ARGENTINA Nutrigenomics Market by Product Type
Genetic Testing Kits
Bioinformatics Tools
Nutritional Analysis Software
ARGENTINA Nutrigenomics Market by Technology Type
DNA Sequencing
Microarray Analysis
Polymerase Chain Reaction
REST OF SOUTH AMERICA Outlook (USD Billion, 2019-2035)
REST OF SOUTH AMERICA Nutrigenomics Market by Application Type
Personalized Nutrition
Disease Prevention
Health Optimization
Fitness and Athletic Performance
REST OF SOUTH AMERICA Nutrigenomics Market by End Use Type
Healthcare
Dietary Supplements
Food Beverage
Pharmaceuticals
REST OF SOUTH AMERICA Nutrigenomics Market by Product Type
Genetic Testing Kits
Bioinformatics Tools
Nutritional Analysis Software
REST OF SOUTH AMERICA Nutrigenomics Market by Technology Type
DNA Sequencing
Microarray Analysis
Polymerase Chain Reaction
MEA Outlook (USD Billion, 2019-2035)
MEA Nutrigenomics Market by Application Type
Personalized Nutrition
Disease Prevention
Health Optimization
Fitness and Athletic Performance
MEA Nutrigenomics Market by End Use Type
Healthcare
Dietary Supplements
Food Beverage
Pharmaceuticals
MEA Nutrigenomics Market by Product Type
Genetic Testing Kits
Bioinformatics Tools
Nutritional Analysis Software
MEA Nutrigenomics Market by Technology Type
DNA Sequencing
Microarray Analysis
Polymerase Chain Reaction
MEA Nutrigenomics Market by Regional Type
GCC Countries
South Africa
Rest of MEA
GCC COUNTRIES Outlook (USD Billion, 2019-2035)
GCC COUNTRIES Nutrigenomics Market by Application Type
Personalized Nutrition
Disease Prevention
Health Optimization
Fitness and Athletic Performance
GCC COUNTRIES Nutrigenomics Market by End Use Type
Healthcare
Dietary Supplements
Food Beverage
Pharmaceuticals
GCC COUNTRIES Nutrigenomics Market by Product Type
Genetic Testing Kits
Bioinformatics Tools
Nutritional Analysis Software
GCC COUNTRIES Nutrigenomics Market by Technology Type
DNA Sequencing
Microarray Analysis
Polymerase Chain Reaction
SOUTH AFRICA Outlook (USD Billion, 2019-2035)
SOUTH AFRICA Nutrigenomics Market by Application Type
Personalized Nutrition
Disease Prevention
Health Optimization
Fitness and Athletic Performance
SOUTH AFRICA Nutrigenomics Market by End Use Type
Healthcare
Dietary Supplements
Food Beverage
Pharmaceuticals
SOUTH AFRICA Nutrigenomics Market by Product Type
Genetic Testing Kits
Bioinformatics Tools
Nutritional Analysis Software
SOUTH AFRICA Nutrigenomics Market by Technology Type
DNA Sequencing
Microarray Analysis
Polymerase Chain Reaction
REST OF MEA Outlook (USD Billion, 2019-2035)
REST OF MEA Nutrigenomics Market by Application Type
Personalized Nutrition
Disease Prevention
Health Optimization
Fitness and Athletic Performance
REST OF MEA Nutrigenomics Market by End Use Type
Healthcare
Dietary Supplements
Food Beverage
Pharmaceuticals
REST OF MEA Nutrigenomics Market by Product Type
Genetic Testing Kits
Bioinformatics Tools
Nutritional Analysis Software
REST OF MEA Nutrigenomics Market by Technology Type
DNA Sequencing
Microarray Analysis
Polymerase Chain Reaction

Free Sample Request
Kindly complete the form below to receive a free sample of this Report
Customer Strories
“I am very pleased with how market segments have been defined in a relevant way for my purposes (such as "Portable Freezers & refrigerators" and "last-mile"). In general the report is well structured. Thanks very much for your efforts.”
Leave a Comment