Renewable Energy Market (2026 - 2035)

Renewable Energy Market Research Report By Technology (Solar Photovoltaics, Wind Energy (Onshore + Offshore), Hydropower, Bioenergy, Other (Geothermal, Marine)), By Application (Power Generation, Heating & Cooling, Transport, Other Applications) and By Regional (North America, Europe, South America, Asia Pacific, Middle East and Africa) - Industry Forecast to 2035
ID: MRFR/EnP/0986-CR
200 Pages
Chitranshi Jaiswal
Last Updated: July 24, 2026
Renewable Energy Market
Market Size
Forecast Period2026-2035
CAGR (2026-2035)8.6%
2025 Market SizeUSD 1,120.0 Billion
2035 Market SizeUSD 2,553.7 Billion
Key Players
NextEra Energy
Enel Green Power
Iberdrola
Ørsted
EDP Renewables
Canadian Solar / CSI Solar
Opportunities
  • Grid-Scale Energy Storage Coupling
  • Floating Offshore Wind Commercialization
  • Emerging-Market Electrification

Renewable Energy Market Summary

The global Renewable Energy Market reached an estimated USD 1,120.0 billion in 2025 and is projected to grow from USD 1,216.3 billion in 2026 to USD 2,553.7 billion by 2035, registering a CAGR of 8.6% during 2026–2035. Two catalysts are reshaping the trajectory: the U.S. Inflation Reduction Act, which unlocked over USD 370 billion in clean-energy incentives through 2032 [1], and the EU's REPowerEU plan, which accelerated permitting timelines for solar and wind across 27 member states [2]. These legislative tailwinds have compressed project risk premiums and drawn unprecedented institutional capital into the Renewable Energy Market.

From a technology perspective, the Renewable Energy Market is undergoing a structural change away from fossil fuel baseload production to distributed and utility-scale solar photovoltaics, onshore and offshore wind turbines and hybrid storage plus generation systems. Global annual renewable capacity additions topped 510 GW in 2024 – a record that the IEA projects to be exceeded by 650 GW per year by 2030 [3]. Corporate power-purchase agreements, previously a niche vehicle, now represent over 160 GW of contractual clean capacity globally [4].


Asia-Pacific is the largest contributor to the Renewable Energy Market with around 42% of the worldwide revenue share, driven by China’s manufacturing scale and India’s active auction pipeline. The region is also the fastest growing, with a CAGR of 10.2% to 2035. Europe’s share is about 25%, with offshore wind buildout in the North Sea and Baltic leading the way, and North America about 22% powered by utility-scale solar deployment supported by tax credits. The coming decade will be a test of whether supply-chain localization, grid enhancements and permitting reform can maintain pace with governmental objectives.


Key Report Takeaways

• By Technology

  • Solar photovoltaics hold roughly 45% of the Renewable Energy Market by revenue, propelled by module cost declines and rooftop mandates in key economies.
  • Onshore wind generation is forecast to expand at a CAGR of 7.8% through 2035, supported by turbine upsizing and repowering cycles.
  • Hydropower contributes approximately USD 201.6 billion in 2025 value, though environmental permitting challenges constrain growth.

• By Sector

  • Power generation represents roughly 65% of the Renewable Energy Market, reflecting utility-scale buildout across solar, wind, and hydro.
  • The transport sector is the fastest-growing application, expanding at a CAGR of 12.4% as electrification deepens across rail, road, and marine fleets.

• By Geography

  • Asia-Pacific leads the Renewable Energy Market in absolute capacity additions, accounting for 42% of global revenue.
  • North America's Renewable Energy Market contribution reaches approximately USD 246.4 billion in 2025, with utility-scale solar representing the single largest investment category.
  • The Middle East & Africa region is projected to grow at a CAGR of 11.8%, driven by Gulf-state gigawatt-scale solar tenders.


Renewable Energy Market Size and Forecast (2021–2035)

Market sizing is based on a triangulated approach including top-down energy investment databases (IEA World Energy Investment, BloombergNEF), bottom-up project pipeline analysis across 85 countries and proprietary demand modeling taking into account policy schedules, commodity pricing and grid interconnection queues. Historical figures are based on installed capacity and reported revenue from project developers, equipment OEMs and service providers.
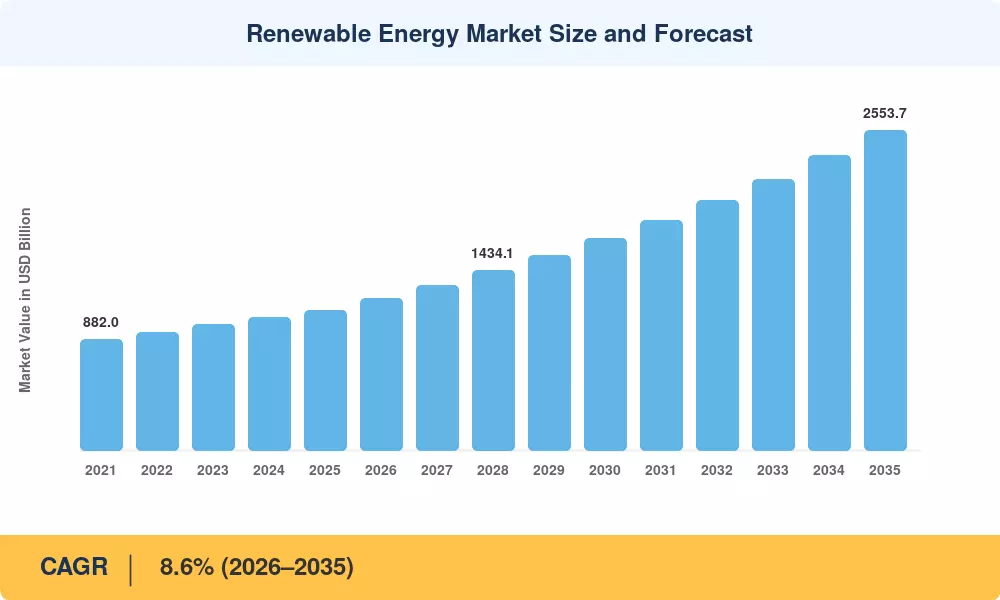
Renewable Energy Market Size and Forecast
Our Impact
Enabled $4.3B Revenue Impact for Fortune 500 and Leading Multinationals
Partnering with 2000+ Global Organizations Each Year
30K+ Citations by Top-Tier Firms in the Industry

Driver Impact Analysis

Driver ~% Impact on CAGR Geographic Relevance Impact Timeline
Government mandates and renewable portfolio standards ~22% Global Long-term (≥4 yr)
Solar PV and wind levelized cost competitiveness ~20% Global Short-term (≤2 yr)
Corporate sustainability commitments and PPA growth ~16% North America, Europe Medium-term (2–4 yr)
Grid modernization and transmission investment ~14% Asia-Pacific, North America Long-term (≥4 yr)
Electrification of transport and heating ~12% Europe, China Medium-term (2–4 yr)
Energy storage cost declines and hybrid plant economics ~10% Global Medium-term (2–4 yr)
Emerging-market electrification and development finance ~6% Africa, South Asia, Latin America Long-term (≥4 yr)


Government Mandates and Renewable Portfolio Standards

National and sub-national renewable targets remain the single most powerful structural driver of the Renewable Energy Market. The U.S. IRA extended production and investment tax credits through at least 2032, with bonus adders for domestic-content and energy-community projects that raise effective subsidies to 50–60% of capital cost [1]. The EU's revised Renewable Energy Directive III raised the bloc's 2030 target to 42.5% of gross final energy consumption, compressing permitting windows to 12 months for designated acceleration zones [2]. India's National Electricity Plan targets 500 GW of non-fossil capacity by 2030, backed by viability-gap funding and inter-state transmission waivers [11]. These interlocking mandates create a durable demand floor that de-risks private capital deployment over multi-decade project lifetimes.

Solar PV and Wind Cost Competitiveness

Renewable generation now undercuts new-build gas and coal in over 90% of the world's electricity markets on a levelized-cost basis [5]. Utility-scale solar PV LCOE fell below USD 30/MWh in high-irradiance regions during 2024, while onshore wind reached USD 35–45/MWh across Northern Europe and the U.S. Great Plains [12]. This cost advantage is self-reinforcing: lower prices expand addressable demand, which drives manufacturing scale, which further compresses costs. BloombergNEF estimates that the learning rate for solar modules remains around 28% per doubling of cumulative capacity, suggesting continued deflation through the forecast period [5].

Corporate PPA Growth

Corporate renewable procurement surpassed 50 GW of new contracts signed in 2024 alone, driven by Scope 2 emissions reduction commitments and the financial attractiveness of long-term price certainty [4]. Technology firms — led by Microsoft, Google, and Amazon — collectively hold over 40 GW of contracted renewable capacity globally [13]. The expansion of virtual PPAs into Asia-Pacific and Latin America is broadening the buyer pool beyond traditional corporate off-takers in North America and Europe, creating additional pull-through demand for the Renewable Energy Market.

Grid Modernization and Transmission Investment

Transmission capacity has emerged as the binding constraint on renewable deployment in multiple jurisdictions. The U.S. DOE's National Transmission Planning Study identified a need for USD 300–400 billion in new high-voltage transmission to meet 2035 clean-energy targets [7]. Europe's TEN-E regulation fast-tracked 166 cross-border energy infrastructure projects, many designed to carry offshore wind power from the North Sea to demand centers in Germany and the Benelux countries [14]. Every gigawatt of new transmission capacity enabled roughly 2–3 GW of incremental renewable generation connection during 2023–2024.


Restraints Impact Analysis

Restraint impact percentages follow the same directional methodology described in Section 4. They represent estimated headwinds that temper — but do not reverse — the Renewable Energy Market's positive growth trajectory.

Restraint ~% Impact on CAGR Geographic Relevance Impact Timeline
Permitting delays and land-use conflicts ~–1.8% Europe, North America Long-term (≥4 yr)
Grid interconnection queues and curtailment ~–1.4% Global Medium-term (2–4 yr)
Supply-chain concentration and trade barriers ~–1.0% Global Short-term (≤2 yr)
Intermittency and system integration costs ~–0.8% Global Long-term (≥4 yr)
Interest-rate sensitivity and capital costs ~–0.5% North America, Europe Short-term (≤2 yr)


Permitting Delays and Land-Use Conflicts

Average permitting timelines for onshore wind in Europe exceed four years in several member states, with Germany, France, and Italy cited as the most challenged markets [15]. Community opposition to large-scale solar on agricultural land has slowed project pipelines in the U.K. and parts of the U.S. Midwest. While the EU's emergency permitting regulation shortened timelines temporarily, structural reform of environmental impact assessment processes remains incomplete. These delays inflate developer carrying costs and can push projects past subsidy eligibility windows, dampening near-term growth in the Renewable Energy Market.

Grid Interconnection Queues

The U.S. interconnection queue held over 2,600 GW of proposed generation and storage projects at the end of 2024, with average wait times stretching to five years [7]. Similar backlogs exist in the U.K. (over 700 GW queued) and parts of India. High withdrawal rates — roughly 80% of U.S. queued projects never reach commercial operation — indicate that the queue has become a speculative bottleneck rather than a reliable pipeline indicator. FERC Order 2023 and comparable reforms in Europe aim to rationalize queue management, but meaningful relief is unlikely before 2028.

Supply-Chain Concentration

China currently manufactures over 80% of global solar wafers, cells, and modules, and controls roughly 60% of wind turbine component production [16]. This concentration creates vulnerability to trade-policy disruption, as demonstrated by U.S. anti-dumping duties on Southeast Asian solar module imports and the EU's Carbon Border Adjustment Mechanism. Efforts to diversify manufacturing to India, the U.S., and the EU are underway. Still, they will require three to five years to reach meaningful scale, creating a transitional cost premium in the Renewable Energy Market.


Renewable Energy Market Opportunities

Grid-Scale Energy Storage Coupling

Hybrid renewable-plus-storage projects are emerging as the default configuration for new utility-scale solar and wind plants. The global installed base of grid-scale battery storage reached 85 GWh in 2024 and is forecast to exceed 500 GWh by 2030 [9]. Developers who integrate four-hour lithium-ion or emerging sodium-ion systems can capture both energy arbitrage and ancillary-services revenue streams, improving project returns by 150–300 basis points relative to standalone generation.

Floating Offshore Wind Commercialization

Fixed-bottom offshore wind has proven bankable in waters up to 60 meters deep. Still, floating foundation technologies unlock continental-shelf sites in the U.S. West Coast, Japan, South Korea, and the Mediterranean that collectively represent over 1,000 GW of technical potential [18]. Scotland's ScotWind leasing round allocated 28 GW of seabed rights in 2022, with the majority designated for floating arrays. First commercial-scale floating farms are expected to reach financial close by 2027, establishing a new growth vertical within the Renewable Energy Market.

Emerging-Market Electrification

Sub-Saharan Africa and South Asia present a unique dual opportunity: expanding energy access while leapfrogging fossil-fuel infrastructure entirely. The World Bank's Scaling Solar program has delivered tariffs below USD 40/MWh in Senegal, Zambia, and Madagascar — cost levels that compete directly with diesel generation [10]. As development finance institutions de-risk first-of-a-kind projects, private capital is expected to follow, making this a significant expansion frontier for the Renewable Energy Market.

Green Hydrogen Production at Scale

Electrolyzer capacity fed by dedicated renewable generation is projected to grow from under 1 GW in 2024 to over 100 GW by 2030, according to the Hydrogen Council [19]. Countries including Saudi Arabia, Australia, Chile, and Morocco are positioning themselves as export hubs for green ammonia and synthetic fuels. This segment creates incremental renewable demand beyond the electricity grid, opening new revenue pools and expanding the addressable scope of the Renewable Energy Market.

Data Monetization and Digital Energy Platforms

Asset-performance-management platforms, AI-driven forecasting, and blockchain-enabled renewable energy certificate trading represent nascent revenue layers. Developers with large, geographically distributed portfolios can monetize operational data through predictive maintenance services, virtual power plant aggregation, and carbon-credit verification. The energy-as-a-service model — where customers pay per kilowatt-hour rather than owning assets — is gaining traction in commercial and industrial segments.


Renewable Energy Market Future Outlook

AI and Autonomous Energy Operations

Artificial intelligence is transforming how renewable assets are monitored, dispatched, and maintained. Predictive-maintenance algorithms have reduced unplanned turbine downtime by 20–30% in early deployments, while AI-driven weather forecasting has improved day-ahead renewable output predictions by 15% [23]. By 2030, autonomous drone inspection, robotic panel cleaning, and ML-optimized energy trading will be standard practice across large portfolios within the Renewable Energy Market.

Electrification Supercycle

The convergence of EV adoption, heat-pump deployment, and industrial electrification is set to increase global electricity demand by 60–75% between 2025 and 2050, according to the IEA [3]. Renewables are the default supply-side option for meeting this incremental load, as they are the cheapest source of new generation in most geographies. The Renewable Energy Market stands to capture the majority of the approximately USD 4 trillion in annual energy investment the IEA projects by 2030.

ESG Reporting and Climate Disclosure

Mandatory climate disclosure frameworks — the EU's Corporate Sustainability Reporting Directive, the SEC's climate-risk rules, and the ISSB's IFRS S2 standard — are compelling thousands of corporations to quantify Scope 2 and Scope 3 emissions [24]. Renewable procurement via PPAs or on-site generation is the most direct lever companies have for reducing reported emissions. This regulatory push creates a structural demand multiplier for the Renewable Energy Market that is largely independent of commodity price cycles.

Platform Economics and Virtual Power Plants

Aggregated distributed energy resources — rooftop solar, behind-the-meter batteries, EV chargers, and smart loads — are being organized into virtual power plants that bid into wholesale electricity and ancillary-services markets. IRENA estimates that VPP capacity could reach 500 GW globally by 2030, displacing a portion of peaker-plant demand [6]. Platform operators who aggregate these assets at scale will create new value layers in the Renewable Energy Market, shifting revenue from pure generation to grid-services orchestration.


Renewable Energy Market Segmentation

By Technology

Segment Key Metric Primary Demand Driver
Solar Photovoltaics ~45% share Module cost deflation and rooftop mandates
Wind Energy (Onshore + Offshore) CAGR of 8.9% Turbine upsizing and government auction pipelines
Hydropower USD 201.6 B (2025) Pumped-storage revival and reservoir modernization
Bioenergy ~5% share Waste-to-energy regulations and industrial heat
Other (Geothermal, Marine) CAGR of 11.2% Enhanced geothermal pilots and tidal demonstration


Solar PV is the anchor technology of the Renewable Energy Market, accounting for roughly 45% of total revenue. China's polysilicon overcapacity pushed module prices below USD 0.10/W in 2024, accelerating adoption even in price-sensitive emerging markets. Utility-scale installations dominate volume, but distributed rooftop and commercial segments are expanding rapidly as net-metering policies spread across Southeast Asia, Latin America, and Africa.

Wind energy — spanning both onshore and offshore installations — represents the second-largest technology category in the Renewable Energy Market. Onshore wind benefits from proven bankability and declining turbine costs, while offshore wind offers higher capacity factors and proximity to coastal load centers. The transition to 15+ MW turbines for offshore projects has reduced balance-of-system costs per megawatt-hour by approximately 25% since 2020 [18].

By Application

Segment Key Metric Primary Demand Driver
Power Generation ~65% share Utility-scale solar and wind farm buildout
Heating & Cooling USD 201.6 B (2025) Heat-pump adoption and district-heating integration
Transport CAGR of 12.4% EV fleet growth and renewable charging infrastructure
Other Applications ~7% share Desalination, agricultural pumping, telecom towers


Power generation commands the largest share of the Renewable Energy Market across all regions. The economics are straightforward: solar and wind produce the cheapest electrons available in most geographies, and grid-scale deployment provides the fastest path to decarbonization targets. Heating and cooling is gaining attention as European countries accelerate heat-pump rollouts — the EU aims for 60 million cumulative heat-pump installations by 2030 [8].

The transport application segment is the fastest-growing within the Renewable Energy Market by CAGR. As electric vehicle penetration climbs toward 30–40% of new passenger-car sales globally by 2030, the renewable content of grid electricity becomes a direct determinant of transport-sector emissions. Dedicated renewable-powered charging hubs are already being developed by oil majors and utilities seeking to capture this high-growth intersection.


Regional Market Share Analysis

Region Primary Metric Primary Investment Themes
Asia-Pacific 42% share of global revenue Solar manufacturing scale; onshore wind; India auction pipeline
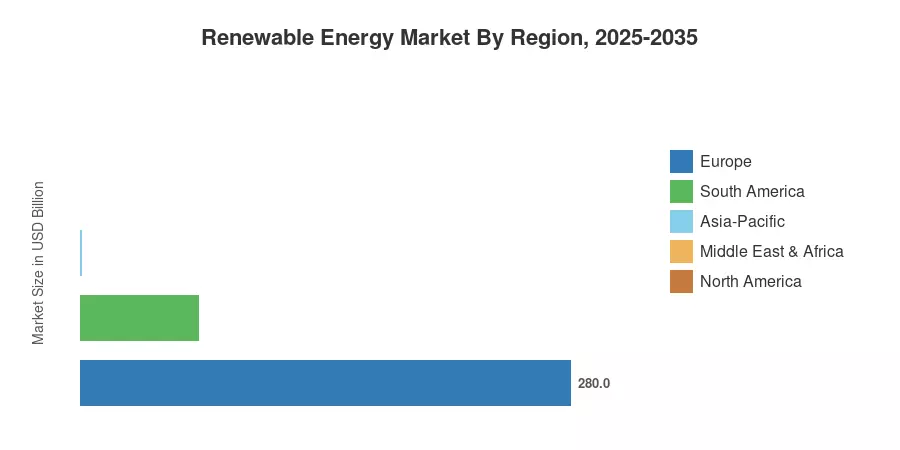
Europe USD 280.0 B (2025) Offshore wind buildout; grid interconnection; hydrogen pilots
North America CAGR of 8.2% (2026–2035) Tax-credit-driven solar; storage co-location; transmission
South America USD 67.2 B (2025) Onshore wind in Brazil; distributed solar; development finance
Middle East & Africa CAGR of 11.8% (2026–2035) Gigawatt-scale solar tenders; desalination coupling
Total USD 1,120.0 B (2025)

The Renewable Energy Market's geographic profile reflects divergent resource endowments, policy architectures, and grid maturity levels. Asia-Pacific's dominance stems from China's unmatched manufacturing ecosystem and India's accelerating auction pipeline. Europe leads in regulatory sophistication and offshore wind deployment, while North America benefits from deep capital markets and strong corporate demand.


Asia-Pacific

Country Key Metric Key Driver
China ~58% of regional revenue Manufacturing dominance and Five-Year Plan targets [20]
India CAGR of 11.5% National Solar Mission and competitive auction framework [11]
Japan USD 32.8 B (2025) Feed-in tariff transition to feed-in premium; offshore wind [21]
Australia CAGR of 9.4% High irradiance and REZ transmission investment [22]
South Korea USD 14.1 B (2025) 9th Basic Plan targeting 21.6% renewables by 2030


China installed over 290 GW of solar PV and 76 GW of wind in 2024 alone, dwarfing every other national market [20]. India's Central Electricity Authority projects 292 GW of renewable capacity in place by March 2025, with auction pipelines extending to 50 GW annually through the decade. Japan's transition from generous feed-in tariffs to competitive auctions has slowed growth, but designated offshore wind promotion zones in Akita and Chiba signal renewed policy commitment [21].

Europe

Country Key Metric Key Driver
Germany ~24% of regional share Energiewende acceleration; coal-exit timeline [2]
United Kingdom CAGR of 9.1% CfD auction rounds; ScotWind floating pipeline [18]
Spain USD 25.2 B (2025) Solar irradiance advantage; corporate PPA hub
France CAGR of 7.9% Offshore wind tenders; nuclear-renewable hybrid grid
Netherlands USD 12.5 B (2025) North Sea offshore wind corridor leadership


The region's offshore wind ambitions increasingly shape European Renewable Energy Market growth. The Esbjerg and Ostend Declarations committed North Sea countries to 120 GW and 300 GW of offshore wind by 2030 and 2050, respectively [14]. Germany's revised Renewable Energy Sources Act raised the 2030 onshore wind target to 115 GW and solar PV to 215 GW, while the U.K.'s sixth CfD auction round in 2024 attracted renewed developer participation after an unsuccessful fifth round.

North America

Country Key Metric Key Driver
United States ~85% of regional revenue IRA tax credits; utility-scale solar and storage [1]
Canada CAGR of 8.8% Provincial clean-electricity mandates; hydropower modernization
Mexico USD 11.2 B (2025) CFE reforms; private-sector distributed generation


The United States accounts for the vast majority of North American Renewable Energy Market activity, with the IRA's transferable tax-credit mechanism unlocking capital from tax-equity-constrained developers. Canada's federal Clean Electricity Regulations aim for a net-zero grid by 2035, catalyzing investment in interprovincial transmission and wind development in Alberta and Quebec.

South America

Country Key Metric Key Driver
Brazil ~62% of regional share Onshore wind in Bahia and Rio Grande do Norte; distributed solar
Chile CAGR of 10.3% Atacama Desert solar; green hydrogen export strategy
Colombia USD 4.8 B (2025) Guajira wind corridor; energy transition law


Brazil leads the South American Renewable Energy Market with over 30 GW of installed wind capacity and a rapidly growing distributed solar segment exceeding 35 GW. Chile's Atacama Desert delivers some of the world's highest solar irradiance levels, attracting green hydrogen pilot investments from European and Asian developers.

Middle East & Africa

Country Key Metric Key Driver
Saudi Arabia ~30% of regional revenue NEOM and Vision 2030 gigawatt-scale tenders
UAE CAGR of 12.1% Al Dhafra and future solar mega-projects
South Africa USD 8.4 B (2025) REIPPPP auction program; grid-crisis response
Egypt CAGR of 10.8% Benban solar park expansion; Suez wind corridor


The Middle East & Africa represents the fastest-growing regional opportunity within the Renewable Energy Market. Saudi Arabia's Public Investment Fund is directing billions toward renewable megaprojects as part of the Kingdom's economic diversification. South Africa's rolling energy crisis has made private-sector renewable procurement politically and economically viable, with the REIPPPP program delivering over 6 GW since inception [10].


Renewable Energy Market By Region, 2025-2035

Competitive Benchmarking

The Renewable Energy Market is moderately fragmented, and the estimated HHI is below 500, with top five players holding around 18-22% of the global revenue. No one company dominates all technology segments and geographies, although regional concentration is higher – especially in offshore wind where three European developers hold about 40% of installed capacity. Competition will increasingly be based on vertically integrated competencies including development, production, construction and asset management.

Company Est. Revenue Share Range Key Offerings for Renewable Energy Market Strategic Positioning
NextEra Energy ~4–6% Utility-scale solar and wind; FPL regulated portfolio Largest global renewable developer by installed capacity
Enel Green Power ~3–5% Solar, wind, geothermal; PPA origination Diversified European developer with LatAm presence
Iberdrola ~3–5% Onshore/offshore wind; transmission; green hydrogen Vertically integrated utility with Avangrid U.S. arm
Ørsted ~2–4% Offshore wind development; Power-to-X Market leader in offshore wind globally
EDP Renewables ~2–3% Onshore/offshore wind; solar PV Growing U.S. and APAC pipeline
Canadian Solar / CSI Solar ~2–4% Solar modules; utility-scale project development Integrated manufacturer-developer model
JinkoSolar ~3–5% N-type TOPCon solar modules World's largest module shipper by volume
Vestas ~3–5% Wind turbines; service and maintenance Leading onshore wind turbine OEM
Siemens Gamesa (Siemens Energy) ~2–4% Offshore and onshore wind turbines Dominant offshore turbine supplier
Engie ~2–3% Solar, wind, hydro, storage; energy services French utility with global renewables platform


Recent News & Developments


  • U.S. Department of Energy (March 2024): Released the Transmission Facilitation Program's first round of awards, committing USD 1.3 billion in capacity contracts to enable 3.5 GW of new renewable interconnection in the western U.S. [7].
  • European Commission (November 2023): Published the Wind Power Package, streamlining permitting for onshore wind, introducing auction design improvements, and launching a skills-development initiative to address the sector's labor shortage [2].


Renewable Energy Market Report Scope

Parameter Detail
Market Scope Global Renewable Energy Market covering solar PV, wind, hydropower, bioenergy, geothermal, and marine technologies across power generation, heating, transport, and other applications
Study Period 2021–2035
Historical Period 2021–2024
Base Year 2025
Forecast Period 2026–2035
CAGR 8.6% (2026–2035)
Market Size – Base Year USD 1,120.0 Billion (2025)
Market Size – Forecast Endpoint USD 2,553.7 Billion (2035)
Fastest Growing Region Asia-Pacific (CAGR 10.2%)
Fastest Growing Technology Other renewables — geothermal, marine (CAGR 11.2%)
Companies Profiled NextEra Energy, Enel Green Power, Iberdrola, Ørsted, EDP Renewables, Canadian Solar, JinkoSolar, Vestas, Siemens Gamesa, Engie
Valuation Currency USD (constant 2025 dollars)


FAQs

How do renewable energy auction strike prices compare across major markets in 2025?
Utility-scale solar auctions clear at USD 20–30/MWh in the Middle East and India, USD 35–50/MWh in the U.S., and USD 45–65/MWh in Europe, with offshore wind typically clearing 40–60% higher than onshore equivalents. Regional cost differences reflect labor, land, grid-connection, and permitting cost structures [12].
What role does rare-earth mineral availability play in wind turbine manufacturing constraints?
Permanent-magnet direct-drive turbines rely on neodymium and dysprosium, for which China controls over 70% of refined supply. Manufacturers including Vestas and Siemens Gamesa are developing rare-earth-free generator designs to mitigate this dependency [16].
How are insurance and re-insurance costs affecting the bankability of offshore wind projects?
Insurance premiums for offshore wind have risen 30–50% since 2022 due to cable-fault claims and construction delays. Developers are increasingly self-insuring early construction phases and using parametric weather-risk products to manage exposure [17].
What distinguishes a virtual PPA from a physical PPA for corporate renewable procurement?
A physical PPA delivers electrons to the buyer's meter, while a virtual PPA is a financial contract-for-differences settled against a wholesale price index. Virtual PPAs offer geographic flexibility but expose buyers to basis risk between settlement and delivery nodes [4].
How does agrivoltaics create value compared to single-use solar land leases?
Agrivoltaic systems co-locate crops beneath elevated solar panels, maintaining 60–80% of baseline agricultural yield while generating electricity. This dual-use model reduces community opposition and can increase total land revenue by 30% versus solar-only projects [10].
What are the primary technical risks in long-duration energy storage technologies beyond lithium-ion?
Iron-air, flow-battery, and compressed-air systems target 100+ hour discharge durations but face scalability, round-trip efficiency, and bankability challenges. Most remain at demonstration scale, with commercial viability expected post-2028 [9].
How do carbon border adjustment mechanisms influence renewable energy investment decisions?
The EU's CBAM increases the cost of carbon-intensive imports, incentivizing export-oriented manufacturers in developing economies to source renewable electricity. This creates indirect pull-through demand for renewable capacity in trade-exposed economies [2].    
Author
Author
Author Profile
Chitranshi Jaiswal LinkedIn
Team Lead - Research
Chitranshi is a Team Leader in the Chemicals & Materials (CnM) and Energy & Power (EnP) domains, with 6+ years of experience in market research. She leads and mentors teams to deliver cross-domain projects that equip clients with actionable insights and growth strategies. She is skilled in market estimation, forecasting, competitive benchmarking, and both primary & secondary research, enabling her to turn complex data into decision-ready insights. An engineer and MBA professional, she combines technical expertise with strategic acumen to solve dynamic market challenges. Chitranshi has successfully managed projects that support market entry, investment planning, and competitive positioning, while building strong client relationships. Certified in Advanced Excel & Power BI she leverages data-driven approaches to ensure accuracy, clarity, and impactful outcomes.

Research Approach


Secondary Research

The secondary research process involved comprehensive analysis of regulatory databases, peer-reviewed energy journals, technical publications, and authoritative international organizations. Key sources included the International Energy Agency (IEA), International Renewable Energy Agency (IRENA), US Energy Information Administration (EIA), US Department of Energy (DOE), Environmental Protection Agency (EPA), European Environment Agency (EEA), Global Wind Energy Council (GWEC), Solar Energy Industries Association (SEIA), International Hydropower Association (IHA), World Bank Energy & Extractives Global Practice, United Nations Framework Convention on Climate Change (UNFCCC), Intergovernmental Panel on Climate Change (IPCC), IEEE Xplore Digital Library, Elsevier Renewable and Sustainable Energy Reviews, BloombergNEF, Wood Mackenzie Power & Renewables, and national energy ministry databases from key markets including China National Energy Administration (NEA), Ministry of New and Renewable Energy (MNRE) India, Bundesministerium für Wirtschaft und Energie (BMWi) Germany, and Departamento de Energia Brazil. These sources were utilized to collect installed capacity statistics, policy framework analysis, feed-in tariff and auction data, grid integration studies, technology cost trends, and carbon reduction targets for photovoltaic systems, concentrated solar power, onshore and offshore wind turbines, hydroelectric installations, and emerging energy storage technologies.


Primary Research

Qualitative and quantitative insights were obtained by interviewing supply-side and demand-side stakeholders during the primary research process. CEOs, VPs of Project Development, Chief Technology Officers, regulatory affairs heads, and commercial directors from renewable energy OEMs (turbine manufacturers, solar panel producers, inverter suppliers), independent power producers (IPPs), and engineering, procurement, and construction (EPC) contractors comprised supply-side sources. Demand-side sources included executives from utility companies, grid operators, corporate sustainability officers from energy-intensive industries, commercial real estate developers, and procurement leaders from government utilities and rural electrification agencies. The primary research conducted in the distributed generation and centralized power plant segments validated technology adoption curves, confirmed project pipeline timelines for utility-scale solar and offshore wind developments, and gathered insights on power purchase agreement (PPA) pricing strategies, grid interconnection challenges, and regulatory compliance dynamics.

Primary Respondent Breakdown:

By Designation: C-level Primaries (40%), Director Level (32%), Others (28%)

By Region: North America (32%), Europe (30%), Asia-Pacific (28%), Rest of World (10%)


Market Size Estimation

Global market valuation was derived through capacity deployment mapping and levelized cost of energy (LCOE) analysis. The methodology included:

Identification of 50+ key manufacturers and developers across North America, Europe, Asia-Pacific, Latin America, and Middle East & Africa

Technology mapping across photovoltaic (mono-crystalline, thin-film), concentrated solar power (parabolic trough, solar tower), onshore wind turbines (≤3MW, >3MW), offshore wind platforms (fixed-bottom, floating), hydroelectric power plants (run-of-river, pumped storage), geothermal binary cycle plants, and biomass conversion systems

Analysis of reported and modeled annual revenues specific to renewable energy equipment manufacturing, project development, and operations & maintenance (O&M) services

Coverage of manufacturers and developers representing 75-80% of global installed capacity in 2024

Extrapolation using bottom-up (GW installed capacity × ASP/MW by technology and country) and top-down (utility-scale project investment validation) approaches to derive segment-specific valuations for electricity generation, heating, industrial process heat, and transportation fuel applications

Download Free Sample

Kindly complete the form below to receive a free sample of this Report

Download PDF ×

We do not share your information with anyone. However, we may send you emails based on your report interest from time to time. You may contact us at any time to opt-out.

















