Service Robotics Market (2026 - 2035)

Service Robotics Market Size, Share and Research Report By Field of Application (Professional, Personal / Domestic), By Component (Hardware, Software, Services), By Operating Environment (Ground, Aerial / UAV, Marine / Underwater), By Mobility (Mobile / Autonomous, Stationary / Fixed-Base), By End-User Industry (Logistics & Warehousing, Healthcare, Agriculture, Defense & Security, Hospitality & Retail) and By Region (North America, Europe, Asia-Pacific, South America, Middle East & Africa) – Industry Forecast to 2035.
ID: MRFR/SEM/1804-HCR
200 Pages
Nirmit Biswas, Aarti Dhapte
Last Updated: July 22, 2026
Service Robotics Market
Market Size
Forecast Period2026-2035
CAGR (2026-2035)17.8%
2025 Market SizeUSD 72.90 Billion
2035 Market SizeUSD 375.14 Billion
Key Players
Intuitive Surgical
iRobot Corporation
ABB Ltd.
KUKA AG
Omron Corporation
Daifuku Co., Ltd.
Opportunities
  • Robot-as-a-Service Expansion Into Emerging Economies
  • Surgical and Rehabilitation Robotics in Aging Societies
  • Data Monetization Through Fleet Analytics

Service Robotics Market Summary

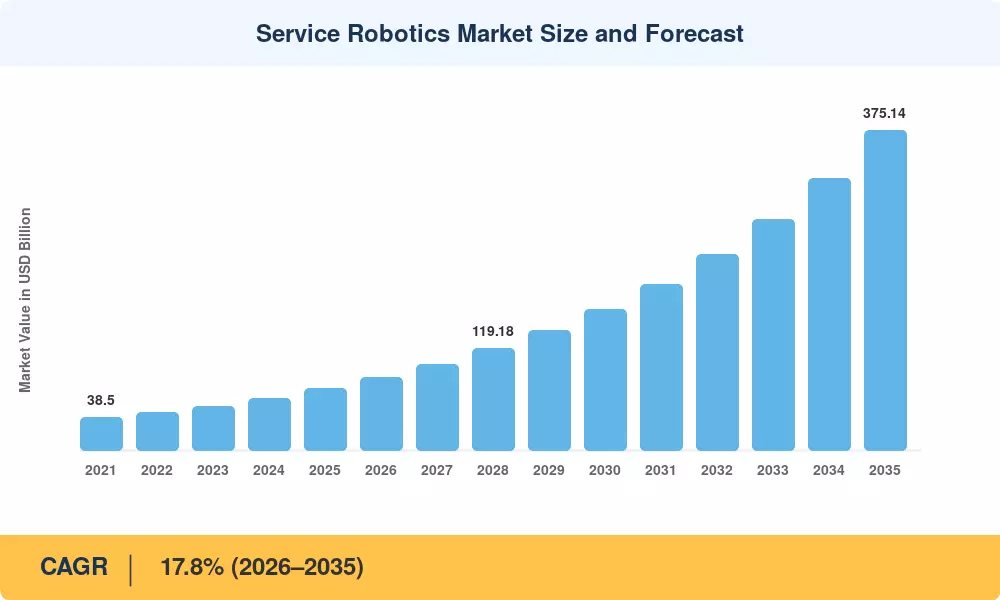
The Service Robotics Market reached USD 72.90 Billion in 2025 and is projected to grow from USD 85.88 Billion in 2026 to USD 375.14 Billion by 2035, registering a CAGR of 17.8% during the forecast period (2026–2035). Two catalysts are driving this acceleration: national labor-force shortages that pushed vacancy rates above 5% in logistics and healthcare across 18 OECD economies by 2024, and government subsidy programs — including Japan's USD 920 million elder-care robotics initiative and the EU's Horizon Europe allocation of EUR 1.3 billion for digital automation — that are compressing payback periods to under 24 months for professional-grade deployments [1][2].

Legacy manual workflows in warehousing, hospital logistics, and commercial cleaning are giving way to sensor-rich autonomous platforms capable of reducing task cycle times by as much as 65%. Private capital has followed: venture and growth-equity investment in the Service Robotics Market exceeded USD 7.4 billion globally in 2024, with surgical-assistance and last-mile delivery systems capturing a combined 38% of deal volume [3]. Robot-as-a-service subscription models are further broadening market access by converting capital expenditure into predictable operating costs.

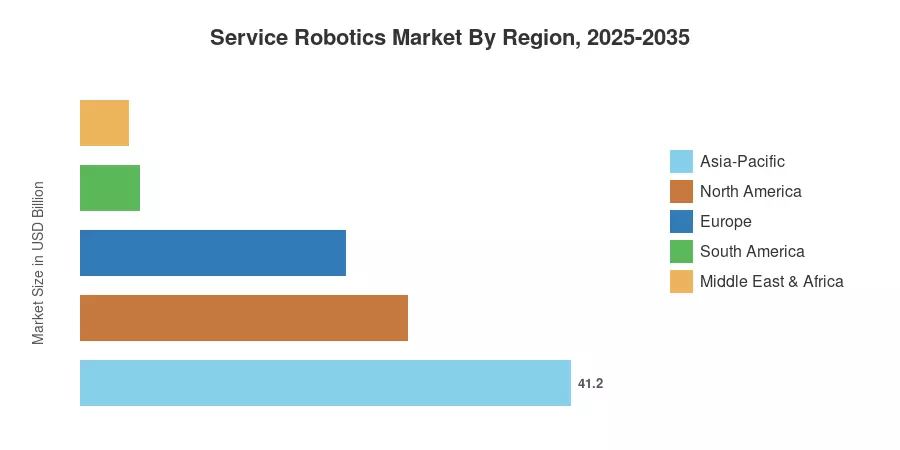
Asia-Pacific commands the largest regional share at 41.2% of global revenue, propelled by China's smart-manufacturing mandates and South Korea's robotics density leadership. The region also posts the fastest growth, with an anticipated CAGR of 22.2% through 2035. North America follows at a 27.5% share, anchored by FAA beyond-visual-line-of-sight (BVLOS) waivers that are expanding commercial drone applications. Europe holds a 22.3% share, with Germany and France leading adoption in agricultural and hospitality automation. As workforce demographics shift and unit costs decline, the Service Robotics Market is set to become one of the defining technology sectors of the next decade.


Key Report Takeaways

• By Field of Application

  • Professional robots held a 56.6% revenue share of the Service Robotics Market in 2025, driven by surgical, logistics, and inspection systems that deliver measurable ROI within two deployment cycles.
  • Personal and domestic robots are accelerating at a CAGR of 16.4% through 2035, fueled by smart-home integration and declining sensor costs.

• By Component

  • Hardware dominated the Service Robotics Market with a 72.1% share in 2025, reflecting the capital-intensive nature of actuators, frames, and embedded processors.
  • Services are expected to register the highest CAGR at 21.9%, as maintenance, fleet management, and RaaS contracts scale alongside installed-base growth.

• By End-User Industry

  • Logistics and warehousing accounted for 51.4% of demand in 2025, underpinned by e-commerce fulfillment volumes exceeding 230 billion parcels globally.
  • Healthcare is projected to post the fastest CAGR at 22.6%, with surgical robotics and pharmacy automation as primary growth vectors.

• By Region

  • Asia-Pacific led the Service Robotics Market at 41.2% of global revenue in 2025 and is forecast to sustain a CAGR of 22.2% through 2035.
  • North America held a 27.5% share, backed by strong defense spending and commercial BVLOS expansion.


Service Robotics Market Size and Forecast (2021–2035)

Market sizing draws on a combination of bottom-up revenue analysis across 14 end-use verticals, top-down validation using macroeconomic indicators (manufacturing output, labor-cost indices), and proprietary vendor surveys covering 85+ OEMs and integrators. All values are denominated in USD Billion at constant 2025 exchange rates.
Service Robotics Market Size and Forecast
Our Impact
Enabled $4.3B Revenue Impact for Fortune 500 and Leading Multinationals
Partnering with 2000+ Global Organizations Each Year
30K+ Citations by Top-Tier Firms in the Industry

Driver Impact Analysis

Driver ~% Impact on CAGR Geographic Relevance Impact Timeline
Chronic labor shortages in logistics and healthcare 25–30% Global Short-term (≤2 yr)
Government subsidy and co-investment programs 15–20% Asia-Pacific, Europe Medium-term (2–4 yr)
Declining sensor and compute hardware costs 12–15% Global Long-term (≥4 yr)
Expansion of 5G and edge-computing infrastructure 10–12% North America, Asia-Pacific Medium-term (2–4 yr)
Growth of e-commerce and same-day delivery expectations 10–15% North America, Europe Short-term (≤2 yr)
Aging populations in developed economies 8–10% Japan, Europe Long-term (≥4 yr)
RaaS and subscription-based deployment models 7–10% Global Medium-term (2–4 yr)


Chronic Labor Shortages Across Key Verticals

Warehousing vacancy rates in the United States exceeded 6.1% in 2024 according to the Bureau of Labor Statistics, while the World Health Organization projects a global deficit of 10 million healthcare workers by 2030 [1][14]. These shortages create direct economic incentives for enterprises to deploy autonomous mobile robots (AMRs) and surgical-assistance platforms. A 2024 survey found that companies deploying AMRs in distribution centers reduced per-unit picking costs by 48% within 18 months, shortening payback windows to approximately 14 months [3]. This driver exerts immediate influence on the Service Robotics Market because the business case is already proven at scale.

Government Subsidy and Co-Investment Programs

The procurement cost barrier for small and mid-sized care facilities was directly reduced by the allocation of JPY 140 billion (approximately USD 920 million) by Japan's Ministry of Economy, Trade and Industry between 2023 and 2026 to subsidize nursing-care and rehabilitation robotics [2]. The Horizon Europe framework in Europe has allocated EUR 1.3 billion for the integration of AI and robotics until 2027. China's Made in China 2025 roadmap is currently in the process of redirecting provincial incentives to domestic robot manufacturers, with the objective of achieving a 50% domestic content in professional-grade service platforms by 2028 [15].


Declining Sensor and Compute Costs

According to the sources, the average price of a LiDAR module decreased from USD 4,200 in 2020 to approximately USD 580 in 2024, a decrease of more than 86% [12]. Concurrently, edge-AI inference chipsets, including NVIDIA's Jetson Orin family, have increased on-device processing capacity to over 275 TOPS while maintaining prices below USD 250. The addressable market is expanding beyond large enterprises to include small-and-medium logistics operators and independent healthcare clinics as a result of these cost reductions.


E-Commerce Fulfillment Pressures

Global parcel volumes surpassed 230 billion units in 2024, growing at roughly 12% year over year, according to the sources [7]. Same-day and next-day delivery expectations now apply to more than 35% of online orders in the United States and China, forcing fulfillment operators to compress cycle times. Goods-to-person AMR deployments in mega-warehouses have been shown to cut order-processing time by up to 70%, making robotic fulfillment a competitive necessity rather than an operational luxury for the Service Robotics Market.


Restraints Impact Analysis

Restraint impacts are expressed as directional drags on the overall CAGR. These do not subtract linearly from the growth rate but represent friction factors that moderate expansion velocity.

Restraint ~% Negative Impact on CAGR Geographic Relevance Impact Timeline
Fragmented safety and liability regulations –3 to –5% Global Medium-term (2–4 yr)
High upfront capital costs for SMEs –3 to –4% Emerging markets Short-term (≤2 yr)
Cybersecurity risks in networked fleets –2 to –3% North America, Europe Long-term (≥4 yr)
Skilled workforce gap for robot integration –2 to –3% Global Medium-term (2–4 yr)
Lithium-battery supply constraints and logistics –1 to –2% Global Short-term (≤2 yr)


Fragmented Safety and Liability Frameworks

No single international standard governs autonomous service-robot deployment across public spaces. The EU Machinery Regulation (2023/1230), effective from January 2027, introduces AI-specific conformity requirements that differ substantially from the U.S. approach, where the FDA regulates surgical systems while OSHA oversees industrial cobots and the FAA handles unmanned aerial vehicles [13]. This patchwork forces OEMs to maintain multiple compliance tracks, inflating certification timelines by 6–12 months and adding an estimated 8–15% to per-model development costs. For the Service Robotics Market, regulatory divergence slows cross-border scaling and disproportionately penalizes smaller manufacturers.

Capital Cost Barriers for Small and Medium Enterprises

A single autonomous floor-scrubbing unit retails between USD 25,000 and USD 60,000, while a surgical-assistance robot can exceed USD 1.8 million [16]. Although RaaS contracts mitigate this barrier, penetration of subscription models remains below 20% of new deployments in emerging markets. Banks in Southeast Asia and Latin America typically require 30–40% collateral on equipment loans for unproven technology categories, further constraining adoption of the Service Robotics Market among mid-tier hospitals and logistics operators.

Cybersecurity Vulnerabilities in Connected Fleets

As fleet sizes grow and cloud-based orchestration becomes standard, attack surfaces expand. A 2024 report by Dragos identified 17 confirmed cybersecurity incidents targeting robotic fleet-management platforms in healthcare and logistics facilities across North America and Europe [17]. Threat vectors include command injection through unsecured API endpoints and ransomware targeting centralized fleet controllers. Insurance underwriters have responded by raising premiums for connected-robot deployments by 12–18%, adding indirect cost pressure to the Service Robotics Market.


Service Robotics Market Opportunities

Robot-as-a-Service Expansion Into Emerging Economies

The Service Robotics Market is now accessible to mid-sized logistics providers and hospital networks in India, Brazil, and Southeast Asia, as RaaS models transform substantial capital expenditures into manageable monthly subscriptions. Market Research Future anticipates that RaaS will constitute more than 30% of new professional deployments in these regions by 2028. Durable competitive moats will be constructed by vendors who establish local service and maintenance infrastructure at an early stage.


Surgical and Rehabilitation Robotics in Aging Societies

By 2030, the global population aged 65 and over will exceed 1.4 billion, according to the United Nations [14]. Japan already dedicates nearly 11% of GDP to healthcare spending, and robotic-assisted minimally invasive surgery reduces average patient hospital stays by 1.8 days [8]. The Service Robotics Market stands to capture incremental demand as national health systems shift reimbursement policies to favor robotic procedures — a process already underway in Germany, South Korea, and the United States.

Data Monetization Through Fleet Analytics

Every deployed service robot generates operational telemetry — path-efficiency metrics, environmental mapping data, task-completion rates — that holds commercial value beyond the primary service function. Warehouse operators can license anonymized throughput benchmarks to supply-chain consultancies, while cleaning-robot fleets produce real-time foot-traffic heatmaps valuable to retail landlords. This secondary data-monetization layer could add 5–8% to operator gross margins over the forecast period.

Agricultural and Field Robotics in Underserved Geographies

Sub-Saharan Africa and South Asia are currently experiencing severe agricultural labor shortages, despite the fact that the expansion of arable land has reached its physical limits. In recent pilot programs, autonomous weeding, harvesting, and crop-monitoring robots have been priced at less than USD 15,000 per unit. These robots provide a path to yield enhancement without proportional labor growth. By 2035, the Service Robotics Market is capable of addressing a combined addressable opportunity that exceeds USD 12 billion in these regions alone.


Autonomous Last-Mile and Indoor Delivery

Urban last-mile delivery costs represent 40–50% of total shipping expense, according to the sources [7]. Sidewalk delivery robots and indoor courier systems already operate in limited commercial deployments across the United States, China, and the UK. As municipal permitting frameworks mature and vehicle-to-infrastructure communication protocols standardize, the Service Robotics Market will absorb a meaningful share of the USD 200+ billion last-mile logistics segment.


Service Robotics Market Future Outlook

AI-Driven Autonomy and Multi-Robot Coordination

Over the next decade, the Service Robotics Market will transition from single-task autonomous units to multi-robot fleets governed by centralized AI orchestration layers. Foundation models trained on operational telemetry will enable robots to generalize across tasks — a warehouse AMR could, with minimal re-training, navigate a hospital corridor. NVIDIA's Isaac platform and Google DeepMind's RT-series models are already demonstrating this cross-domain transferability in controlled environments [11].

Platform Economics and Ecosystem Lock-In

The RaaS model is evolving toward platform ecosystems where hardware, software, analytics, and third-party applications are bundled into integrated offerings. Vendors that control the fleet-management software layer — akin to an operating system — will capture disproportionate value. By 2030, the International Federation of Robotics (IFR) projects that over 40% of professional service robots will be procured through subscription or platform contracts rather than outright purchase [10].

Humanoid Robotics Entering Commercial Viability

Companies including Tesla (Optimus), Figure AI, Agility Robotics, and 1X Technologies have collectively raised more than USD 3 billion in funding since 2023 for general-purpose humanoid platforms [11]. While initial deployments will target repetitive warehouse tasks such as box stacking and bin sorting, the longer-term commercial thesis involves elder care, retail assistance, and light manufacturing. The Service Robotics Market could see humanoid units account for 5–8% of professional deployments by 2033.

Sustainability and Circular-Economy Mandates

The EU's Ecodesign for Sustainable Products Regulation (ESPR), expected to cover robotic equipment by 2029, will require manufacturers to publish product-lifecycle environmental footprints, offer modular component replacement, and achieve minimum recycled-content thresholds [13]. These mandates will reshape supply-chain decisions in the Service Robotics Market, favoring OEMs that invest early in design-for-disassembly and battery-recycling partnerships. Companies with strong ESG credentials will also find it easier to secure institutional procurement contracts, particularly in Europe and East Asia.


Service Robotics Market Segmentation

By Field of Application

Segment Key Metric Primary Demand Driver
Professional 56.6% share (2025) Logistics, surgical, and inspection systems
Personal / Domestic CAGR of 16.4% (2026–2035) Robotic vacuums, lawn mowers, and companion platforms


Professional robots anchor more than half of the Service Robotics Market, with logistics AMRs and surgical-assistance systems representing the two highest-revenue sub-categories. Logistics platforms benefit from measurable throughput gains — picking-rate improvements of 2.5× over manual processes are now standard in Tier-1 distribution centers — while surgical systems command premium price points exceeding USD 1.5 million per unit. Personal and domestic robots, though lower in average selling price, are expanding rapidly as sensor miniaturization and voice-assistant integration make consumer platforms more capable and affordable.

By Component

Segment Key Metric Primary Demand Driver
Hardware 72.1% share (2025) Actuators, sensors, chassis, and embedded processors
Software CAGR of 19.3% (2026–2035) Navigation, fleet management, and AI inference stacks
Services CAGR of 21.9% (2026–2035) Maintenance, integration, and RaaS contracts


Hardware dominates the component mix of the Service Robotics Market because each deployed unit requires a physical platform — motors, frames, batteries, and sensor arrays — that collectively represents 60–75% of unit cost. Software and services, however, are where margin expansion lives. Fleet-management platforms carry gross margins above 70%, and recurring RaaS revenue provides predictable cash flows that hardware sales alone cannot deliver. Over the forecast period, the software-and-services share is expected to climb steadily as installed bases grow, and vendors shift to platform-centric business models.

By Operating Environment

Segment Key Metric Primary Demand Driver
Ground 84.2% share (2025) Warehouse AMRs, cleaning robots, delivery bots
Aerial / UAV CAGR of 21.8% (2026–2035) Agricultural spraying, inspection, last-mile delivery
Marine / Underwater USD 1.85 B (2025) Offshore energy inspection and aquaculture


Ground robotics anchors the market, holding over four-fifths of revenue thanks to high adoption in warehousing and commercial cleaning. Meanwhile, Aerial/UAV platforms represent the fastest-growing frontier with a 21.8% CAGR, and Marine robotics occupies a specialized USD 1.85 billion niche in offshore infrastructure and energy.

By Mobility

Segment Key Metric Primary Demand Driver
Mobile / Autonomous 87.7% share (2025) Self-navigating logistics and service platforms
Stationary / Fixed-Base CAGR of 13.2% (2026–2035) Telepresence kiosks and fixed surgical arms


Mobile and autonomous systems dominate the market with an 87.7% revenue share, driven by demand for self-navigating logistics and service platforms. Meanwhile, stationary systems maintain steady growth at a 13.2% CAGR, carved out by specialized applications like robotic surgery and interactive kiosks.

By End-User Industry

Segment Key Metric Primary Demand Driver
Logistics & Warehousing 51.4% share (2025) E-commerce fulfillment volume growth
Healthcare CAGR of 22.6% (2026–2035) Surgical assistance and pharmacy automation
Agriculture USD 5.70 B (2025) Autonomous weeding, spraying, and harvesting
Defense & Security CAGR of 18.9% (2026–2035) EOD, ISR, and perimeter patrol systems
Hospitality & Retail USD 4.25 B (2025) Cleaning, concierge, and inventory-scanning robots


Logistics and warehousing lead the sector with more than half of the overall market share, propelled by relentless e-commerce fulfillment demands. Healthcare stands out as the primary growth engine at a 22.6% CAGR, while agriculture, defense, and hospitality continue to secure multi-billion-dollar footprints across specialized operational niches.


Regional Market Share Analysis

Region Key Metric Primary Investment Themes
Asia-Pacific 41.2% share (2025) Smart manufacturing, elder care, e-commerce fulfillment
North America 27.5% share (2025) Surgical robotics, BVLOS commercial drones, warehouse AMRs
Europe 22.3% share (2025) Agricultural automation, hospitality, regulatory harmonization
South America 5.0% share (2025) Mining automation, agri-tech, RaaS penetration
Middle East & Africa 4.0% share (2025) Oil & gas inspection, defense, smart-city pilots
Total 100%

The Service Robotics Market exhibits significant geographic variation in adoption maturity, regulatory environment, and vertical mix. Asia-Pacific leads both in absolute size and growth rate, while North America and Europe remain critical markets for high-value surgical and defense applications.


North America

Country Key Metric Key Driver
US 78.5% of regional revenue FDA surgical-robot clearances and DoD investment
Canada 13.2% of regional revenue Mining inspection and agricultural robotics
Mexico 8.3% of regional revenue Nearshoring-driven warehouse automation


The United States dominates the North American Service Robotics Market, with Intuitive Surgical's da Vinci systems installed in over 7,800 hospitals and the Department of Defense allocating USD 2.1 billion toward unmanned ground and aerial platforms in FY 2025 [5][20]. Canada's mining sector increasingly relies on underground inspection robots to meet tightening safety mandates, while Mexico benefits from the nearshoring wave as multinational manufacturers deploy AMRs in new cross-border fulfillment centers along the US–Mexico corridor.

Europe

Country Key Metric Key Driver
Germany CAGR of 18.9% (2026–2035) Industry 4.0 integration and automotive logistics
UK CAGR of 17.5% (2026–2035) NHS surgical robotics adoption
France USD 3.80 B (2025) Agricultural and hospitality automation
Italy USD 2.45 B (2025) Food-processing and logistics
Spain CAGR of 16.8% (2026–2035) Tourism-sector cleaning and concierge robots
Nordic Countries USD 2.10 B (2025) Cold-chain logistics and offshore inspection
Russia USD 1.15 B (2025) Defense and energy-sector inspection
Rest of Europe USD 3.35 B (2025) Varied adoption across Central and Eastern Europe


Germany serves as Europe's robotics powerhouse, with the Fraunhofer Institute's 2024 roadmap targeting a 40% increase in service-robot pilot installations across healthcare and hospitality by 2028 [21]. The UK's NHS Long-Term Workforce Plan explicitly cites robotic-assisted surgery as a pathway to reducing surgical waiting lists, and France's agricultural ministry has funded over 120 pilot projects for autonomous vineyard and orchard robots since 2023.

Asia-Pacific

Country Key Metric Key Driver
China 44.8% of regional revenue Made in China 2025, warehouse mega-hubs
Japan 21.3% of regional revenue Elder-care subsidies and surgical systems
India CAGR of 23.5% (2026–2035) Hospital automation and agricultural drones
South Korea USD 4.90 B (2025) Semiconductor fab logistics and service kiosks
ASEAN CAGR of 21.8% (2026–2035) E-commerce fulfillment and hospitality
Rest of Asia-Pacific USD 2.15 B (2025) Mining and field robotics in Australia, New Zealand


China's provincial governments disbursed over CNY 8 billion in robotics subsidies during 2024, and the country now hosts more than 45% of global AMR production capacity [15]. Japan's Society 5.0 framework channels public–private investment into elder-care companion and rehabilitation robots, with over 6,200 care facilities using robotic lifting aids as of mid-2025 [2]. India represents the fastest-growing country-level opportunity in the Service Robotics Market, as the National Health Mission's digitization push and rapid e-commerce growth create parallel demand lanes.

South America

Country Key Metric Key Driver
Brazil 62.4% of regional revenue Agri-tech and mining robotics
Argentina 18.7% of regional revenue Agricultural drone spraying and monitoring
Rest of South America 18.9% of regional revenue Mining inspection across Chile and Peru


Brazil's agribusiness sector — the world's largest soybean and sugar-cane exporter — is a natural fit for autonomous spraying and harvesting platforms, with Embrapa reporting a 32% increase in robotic trial deployments on large-scale farms between 2023 and 2025 [22]. Currency volatility and import duties remain constraints, making locally assembled or RaaS-based solutions the preferred entry strategy in the South American Service Robotics Market.

Middle East & Africa

Country Key Metric Key Driver
Saudi Arabia CAGR of 19.4% (2026–2035) NEOM smart-city program and Vision 2030
UAE 34.2% of regional revenue Logistics hubs and hospitality service robots
South Africa 18.5% of regional revenue Mining inspection and agricultural automation
Egypt CAGR of 17.2% (2026–2035) Healthcare infrastructure modernization
Rest of MEA 22.1% of regional revenue Oil & gas inspection and defense applications


Saudi Arabia's NEOM project and broader Vision 2030 agenda have earmarked over USD 500 million for autonomous service platforms in hospitality, logistics, and public-space maintenance [23]. The UAE benefits from its position as a regional logistics hub, where Dubai's DP World has piloted autonomous container-handling systems at Jebel Ali port. Across sub-Saharan Africa, mining companies in South Africa and Ghana are deploying underground inspection robots to improve worker safety in deep-shaft operations.


Service Robotics Market By Region, 2025-2035

Competitive Benchmarking

The Service Robotics Market is characterized by low concentration, with the top five players accounting for an estimated 22–28% of global revenue. The Herfindahl–Hirschman Index (HHI) sits below 500, reflecting a highly fragmented competitive environment where specialist pure-plays, diversified industrial conglomerates, and well-funded startups compete across overlapping verticals. M&A activity intensified in 2023–2025 as incumbent automation firms acquired niche integrators to fill capability gaps in AI navigation, manipulation, and vertical-specific software.

Company Est. Revenue Share Range Key Offerings for Service Robotics Market Strategic Positioning
Intuitive Surgical ~5–8% da Vinci surgical systems, Ion endoluminal platform Market leader in robotic-assisted surgery
iRobot Corporation ~3–5% Roomba, Braava, and commercial cleaning platforms Consumer robotics brand leader
ABB Ltd. ~3–5% AMR fleet solutions, collaborative robotics Diversified automation conglomerate
KUKA AG (Midea Group) ~2–4% Mobile robotics, logistics automation China-backed global integrator
Omron Corporation ~2–4% LD/HD series AMRs, inspection systems Factory-to-field autonomy specialist
Daifuku Co., Ltd. ~2–3% Material-handling systems, airport logistics Warehouse-scale system integrator
SoftBank Robotics ~1–3% Whiz vacuum, Servi delivery, Pepper Hospitality and retail service platforms
Boston Dynamics (Hyundai) ~1–3% Spot, Stretch, Atlas Advanced mobility and manipulation R&D
Locus Robotics ~1–2% Goods-to-person AMR platforms High-growth warehouse fulfillment pure-play
DeLaval International ~1–2% Robotic milking and dairy-farm automation Niche agricultural service robotics


Recent News & Developments

  • Intuitive Surgical (March 2025): Received FDA 510(k) clearance for the da Vinci 5 system, featuring force-feedback haptics and integrated AI tissue-identification, positioning the platform as the benchmark for next-generation surgical robotics [5].


  • Boston Dynamics (October 2024): Launched the commercial variant of its Stretch mobile manipulator for case-handling in distribution centers, with initial fleet contracts signed with DHL and FedEx [25].


  • European Commission (June 2024): Published the final text of the AI Act's high-risk classification for autonomous service robots operating in public spaces, establishing conformity-assessment timelines effective 2026 [13].


Service Robotics Market Report Scope

Parameter Detail
Market Scope Global Service Robotics Market — hardware, software, services across professional and personal segments
Study Period 2021–2035
CAGR (Forecast Period) 17.8% (2026–2035)
Base Year Market Size USD 72.90 Billion (2025)
Forecast Endpoint USD 375.14 Billion (2035)
Fastest Growing Segment Healthcare end-user (CAGR 22.6%); Services component (CAGR 21.9%)
Companies Profiled 10 (Intuitive Surgical, iRobot, ABB, KUKA, Omron, Daifuku, SoftBank Robotics, Boston Dynamics, Locus Robotics, DeLaval)
Valuation Currency USD Billion


FAQs

How does robot-as-a-service pricing typically compare to outright purchase for a mid-sized warehouse operator?
RaaS contracts generally reduce upfront capital outlay by 70–85%, converting it to a monthly fee of USD 2,000–4,500 per unit. Total cost of ownership over five years tends to be 10–15% higher than purchase, but the cash-flow flexibility makes it accessible to operators lacking large capital budgets [10].
What integration challenges do hospitals face when adding surgical robots to existing operating-room workflows?
Surgical robots demand reinforced flooring, upgraded electrical capacity, and OR redesign to accommodate larger footprints. Staff training programs typically require 40–80 supervised cases before independent operation, creating a 6–12-month ramp-up period [8].
How do cybersecurity insurance premiums affect the total cost of deploying connected service-robot fleets?
Premiums for connected-fleet coverage have risen 12–18% since 2023, adding USD 1,200–3,500 annually per robot to operating costs. Underwriters now require endpoint encryption and fleet-segmentation audits before issuing policies [17].
Which emerging sensor technologies are most likely to displace LiDAR in service robots by 2030?
Solid-state 4D imaging radar and event-based neuromorphic cameras are gaining traction. Both offer lower unit costs and superior performance in adverse lighting, though LiDAR will likely remain the primary sensor for high-precision surgical and inspection applications [12].
What role do interoperability standards play in multi-vendor robot fleet deployments?
Standards like VDA 5050 and MassRobotics AMR Interoperability allow robots from different OEMs to share navigation maps and task queues. Adoption remains below 25% of deployments, but enterprise buyers increasingly mandate compliance in procurement specifications [4].
How are municipal permitting frameworks evolving for sidewalk delivery robots in North America?
Over 25 U.S. states have enacted legislation permitting autonomous sidewalk delivery under specific weight and speed limits. Most cap robots at 25 kg and 10 km/h, with operators required to carry liability insurance exceeding USD 1 million per incident [20].
What is the typical payback period for deploying autonomous mobile robots in cold-chain logistics facilities?
Cold-chain AMR deployments average 16–22 months payback due to higher unit costs for temperature-hardened components. However, they reduce labor exposure to sub-zero environments and cut picking errors by approximately 35% [7].    
Author
Author
Author Profile
Nirmit Biswas LinkedIn
Senior Research Analyst
With 5+ years of expertise in Market Intelligence and Strategic Research, Nirmit Biswas specializes in ICT, Semiconductors, and BFSI. Backed by an MBA in Financial Services and a Computer Science foundation, Nirmit blends technical depth with business acumen. He has successfully led 100+ projects for global enterprises and startups, including Amazon, Cisco, L&T and Huawei, delivering market estimations, competitive benchmarking, and GTM strategies. His focus lies in transforming complex data into clear, actionable insights that drive growth, innovation, and investment decisions. Recognized for bridging engineering innovation with executive strategy, Nirmit helps businesses navigate dynamic markets with confidence.
Co-Author
Co-Author Profile
Aarti Dhapte LinkedIn
AVP - Research
A consulting professional focused on helping businesses navigate complex markets through structured research and strategic insights. I partner with clients to solve high-impact business problems across market entry strategy, competitive intelligence, and opportunity assessment. Over the course of my experience, I have led and contributed to 100+ market research and consulting engagements, delivering insights across multiple industries and geographies, and supporting strategic decisions linked to $500M+ market opportunities. My core expertise lies in building robust market sizing, forecasting, and commercial models (top-down and bottom-up), alongside deep-dive competitive and industry analysis. I have played a key role in shaping go-to-market strategies, investment cases, and growth roadmaps, enabling clients to make confident, data-backed decisions in dynamic markets.

Research Approach


Secondary Research

The secondary research process involved comprehensive analysis of regulatory databases, technical standards repositories, peer-reviewed engineering journals, and authoritative industry organizations. Key sources included the International Federation of Robotics (IFR World Robotics), IEEE Robotics & Automation Society, Robotics Industries Association (RIA/Association for Advancing Automation), International Organization for Standardization (ISO/TC 299 Robotics), National Institute of Standards and Technology (NIST), European Commission Directorate-General for Communications Networks, Content and Technology (DG CONNECT), Japan Robot Association (JARA), Korea Institute for Robot Industry Advancement (KIRIA), China Robot Industry Alliance (CRIA), Occupational Safety and Health Administration (OSHA) Robotics Safety Guidelines, U.S. Food & Drug Administration (FDA) Center for Devices and Radiological Health (for medical robotics), European Medicines Agency (EMA) (for surgical robotics), International Labour Organization (ILO) Future of Work reports, World Economic Forum (WEF) Future of Jobs Report, OECD Robotics and AI in Society reports, National Science Foundation (NSF) Directorate for Engineering, EU Eurostat Digital Economy & Society statistics, and national robotics roadmaps from the U.S. National Robotics Initiative, EU Horizon Europe Strategic Research Agenda, Japan's Robot Revolution Initiative, China's 14th Five-Year Plan for Robotics Industry, and South Korea's Intelligent Robot Development Plan. These sources were used to collect shipment statistics, regulatory compliance data, safety standards implementation, technology adoption trends, and competitive landscape analysis for domestic service robots, professional service robots (healthcare, defense, field applications), autonomous mobile robots, humanoid robots, and collaborative robotics technologies.


Primary Research

To gather both qualitative and quantitative insights, supply-side and demand-side stakeholders were interviewed during the primary research phase. CEOs, CTOs, VPs of Engineering, Chief Product Officers, heads of regulatory compliance, and supply chain directors from manufacturers of service robots, suppliers of components (such as sensors, actuators, and AI chips), and system integrators were examples of supply-side sources. Chief technology officers, operations directors, heads of automation, procurement leads, and facility managers from healthcare systems, logistics and warehousing companies, hotel chains, defense contractors, retail businesses, and smart building developers were among the demand-side sources. Market segmentation, technological roadmap dates, implementation difficulties, ROI measures, maintenance needs, and integration complexity were all verified by primary research.

Primary Respondent Breakdown:

By Designation: C-level Primaries (42%), Director Level (25%), Others (33%)

By Region: North America (30%), Europe (32%), Asia-Pacific (28%), Rest of World (10%)

By Industry Vertical: Healthcare (28%), Logistics & Warehousing (22%), Defense & Security (15%), Hospitality & Retail (12%), Manufacturing & Construction (11%), Domestic/Consumer (12%)


Market Size Estimation

Global market valuation was derived through revenue mapping and unit shipment analysis. The methodology included:

Identification of 85+ key manufacturers across North America, Europe, Asia-Pacific, and Rest of World

Product mapping across professional service robots (healthcare/medical, defense, field robotics, logistics), domestic service robots (floor cleaning, lawn mowing, companionship), humanoid robots, autonomous mobile robots (AMRs), and exoskeletons

Analysis of reported and modeled annual revenues specific to service robotics portfolios and underlying AI/software platforms

Coverage of manufacturers representing 75-80% of global market share in 2024

Extrapolation using bottom-up (unit shipment volume × ASP by application and region) and top-down (manufacturer revenue validation against IFR World Robotics reporting) approaches to derive segment-specific valuations, with triangulation against import/export trade data and venture capital investment flows

Download Free Sample

Kindly complete the form below to receive a free sample of this Report

Download PDF ×

We do not share your information with anyone. However, we may send you emails based on your report interest from time to time. You may contact us at any time to opt-out.

















