Telemedicine Market (2026 - 2035)

Telemedicine Market Research Report: Size, Share, Trend Analysis By Service Type (Real-time Consultation, Remote Patient Monitoring, Store-and-Forward Telemedicine, Mobile Health Applications), By Technology (Video Conferencing, Mobile Health Applications, Web-based Platforms, Wearable Devices), By End-user (Hospitals, Private Practices, Home Care Settings, Healthcare Institutions), By Specialty (Emergency Services, Psychiatry, Dermatology, Pediatrics), and By Regional (North America, Europe, South America, Asia Pacific, Middle East and Africa) - Growth Outlook & Industry Forecast 2025 To 2035

Forecast Period
2026-2035
CAGR
14.18%
2025 Market Size
USD 123.28 Billion
2035 Market Size
USD 479.67 Billion
Healthcare ● Updated August 26, 2026 Report ID: MRFR/HC/1646-CR | Pages: 200 | Author: Satyendra Maurya, Rahul Gotadki

Telemedicine Market Summary

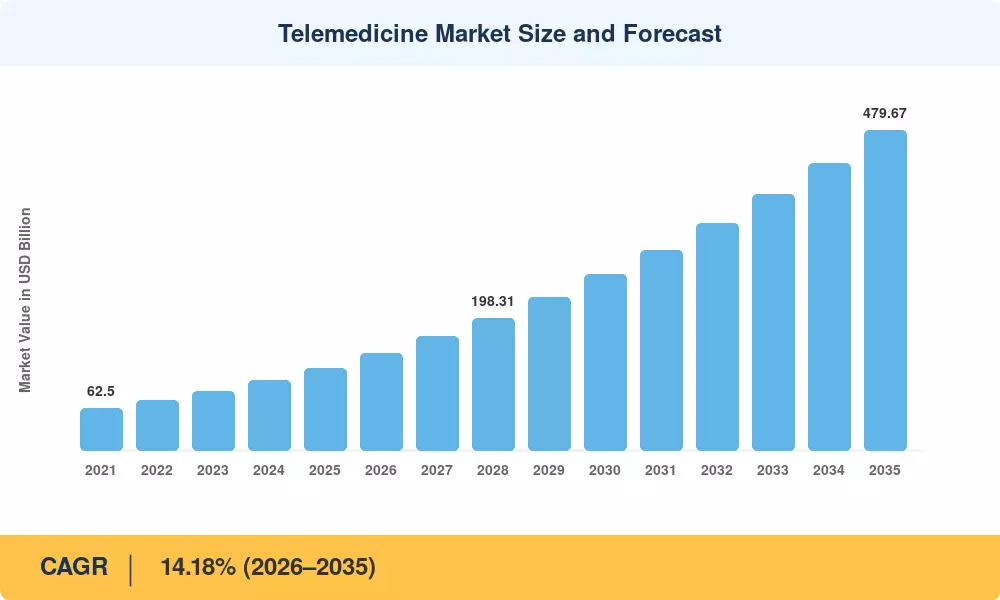
The Telemedicine Market reached USD 123.28 billion in 2025 and enters its forecast window at USD 145.37 billion in 2026, climbing to USD 479.67 billion by 2035 at a 14.18% CAGR. Two catalysts anchor that trajectory. Reimbursement parity statutes now operate in 43 U.S. states, converting a pandemic-era waiver economy into codified payment law [1]. Employer-sponsored virtual primary care contracts have moved from pilot budgets into core benefits spending, giving the Telemedicine Market a recurring revenue base rather than an episodic one [3].

Technology substitution is a big part of the margin story. Fax-driven referral procedures and standalone video-conferencing bolt-ons are being discarded in favor of API-native technologies that write structured encounter data straight into electronic health records. The U.S. Office of the National Coordinator’s TEFCA framework is the connective tissue that renders that substitution economically rational, having crossed 5 million monthly inquiry exchanges in 2025 [4]. Global carriers have extended 5G standalone coverage to around 62% of metropolitan populations, reducing the bandwidth ceiling that had previously limited high-fidelity remote consultations [16].


Geographically, 35.4% of 2025 revenue comes from North America, with permanent Medicare behavioral health telehealth provisions [1]. India’s Ayushman Bharat Digital Mission and China’s nationwide internet-hospital licensing policy are leading the charge [10][11] while Asia-Pacific is the fastest-growing region (18.22% CAGR through 2035). Europe is the second biggest bloc where cross-border e-prescription recognition is quietly releasing specialist supply. The next decade will reward systems that own the clinical data layer, not just the video stream.


Key Report Takeaways

• By Modality

  • Synchronous consultations commanded 41.2% of Telemedicine Market revenue in 2025, reflecting entrenched payer familiarity with real-time encounter codes.
  • Remote patient monitoring is scaling at a 15.89% CAGR through 2035 as chronic-care management codes broaden.
  • Asynchronous store-and-forward workflows generated USD 38.83 billion in 2025, concentrated in dermatology and radiology.

• By Component

  • Services and support captured 52.8% of spend in 2025, the largest single component pool
  • Software platforms are advancing at a 15.10% CAGR as health systems replace point solutions.
  • Telepsychiatry, the fastest specialty service line, is tracking a 16.94% CAGR to 2035

• By Geography

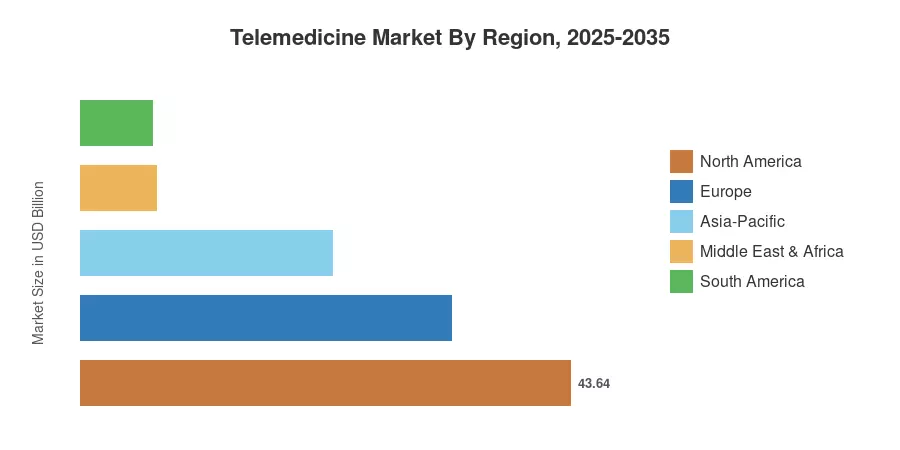
  • North America contributed USD 43.64 billion to the Telemedicine Market in 2025
  • Asia-Pacific posts the steepest regional CAGR at 18.22% through 2035
  • Middle East and Africa holds 5.5% of global revenue, led by sovereign virtual-hospital programmes


Telemedicine Market Size and Forecast (2021–2035)

The estimates below have been triangulated using payer claims data, health-system procurement disclosures, vendor filings, and national digital-health registry information. Historical years are reconciled to CMS utilization data and OECD health spending figures, and forecast years are based on cohort-based adoption curves adjusted for reimbursement status by jurisdiction [1][6].
Telemedicine Market Size and Forecast
Our Impact
Enabled $4.3B Revenue Impact for Fortune 500 and Leading Multinationals
Partnering with 2000+ Global Organizations Each Year
30K+ Citations by Top-Tier Firms in the Industry

Driver Impact Analysis

Driver ~% Impact on CAGR Geographic Relevance Impact Timeline
Reimbursement parity codification 3.4 North America, Europe Short-term (≤2 yr)
Employer-sponsored virtual primary care 2.6 North America Short-term (≤2 yr)
Ageing populations and chronic disease load 2.4 Global Long-term (≥4 yr)
5G and broadband build-out 1.9 Asia-Pacific, MEA Medium-term (2–4 yr)
AI-enabled clinical decision support 1.7 Global Medium-term (2–4 yr)
National digital-health missions 1.5 Asia-Pacific, MEA Medium-term (2–4 yr)
Clinician shortage in rural catchments 1.1 Global Long-term (≥4 yr)


Reimbursement Parity Codification

Payment certainty, not technology, gates hospital capital committees. The Consolidated Appropriations Act extensions and subsequent Medicare Physician Fee Schedule rulemaking made behavioural telehealth permanent and preserved geographic-originating-site flexibility for a further two-year window, covering roughly 68 million beneficiaries [1]. Commercial parity mandates in 43 states now require payers to reimburse remote encounters at in-person rates for equivalent CPT codes. Health systems responded by shifting an estimated USD 4.1 billion of 2025 capital budgets toward permanent virtual-care infrastructure rather than leased pandemic stopgaps [21]. The Telemedicine Market therefore inherits a demand floor that survives utilisation volatility.

Employer-Sponsored Virtual Primary Care

Ageing Demographics and Chronic Care Load

Populations aged 65 and over will expand from roughly 830 million to more than 1.1 billion by 2035, and this cohort accounts for close to 61% of chronic-condition management spending in OECD systems [6]. Remote monitoring reimbursement under CPT 99453–99458 has grown claim volumes at double-digit rates for four consecutive years [2]. Payers increasingly treat continuous physiologic data as a substitute for scheduled office visits, which restructures the entire encounter economy.

AI-Enabled Clinical Decision Support

Physician acceptance has historically been the binding constraint. Ambient documentation tools now cut clinician charting time by an average of 43 minutes per shift in deployed health-system studies, and FDA has cleared more than 1,000 AI-enabled medical devices cumulatively, many with remote-review indications [8][14]. Trust follows time savings. As triage accuracy improves, virtual doctor consultations absorb a widening band of acuity that previously defaulted to emergency departments.


Restraints Impact Analysis

Restraint ~% Drag on CAGR Geographic Relevance Impact Timeline
EHR–telehealth interoperability gaps −2.2 Global Medium-term (2–4 yr)
Cross-border and multi-state licensure friction −1.8 North America, Europe Long-term (≥4 yr)
Data privacy and cybersecurity exposure −1.4 Global Short-term (≤2 yr)
Digital literacy and device access gaps −1.1 Asia-Pacific, MEA, South America Long-term (≥4 yr)
Clinical appropriateness and quality scrutiny −0.9 Europe, North America Medium-term (2–4 yr)


Interoperability Shortfalls

Capacity utilisation suffers when encounter data lands outside the chart. Surveyed health systems report that only about 47% of virtual visits write structured data back to the primary EHR without manual reconciliation, forcing duplicate documentation that erodes clinician throughput by an estimated 11% per session [4]. TEFCA participation is improving the picture, yet vendor-side FHIR conformance remains uneven across mid-market platforms.

Licensure and Credentialing Friction

Supply cannot follow demand across jurisdictional lines. The Interstate Medical Licensure Compact covers 42 U.S. states but still requires per-state fees averaging USD 700 and processing cycles of three to six weeks [9]. European cross-border practice faces analogous professional-recognition delays despite single-market principles. Networks consequently over-staff in high-demand states and idle capacity elsewhere.

Privacy and Security Exposure

Breach economics are punitive. Healthcare data incidents carried an average remediation cost near USD 9.8 million in 2025, the highest of any sector, and virtual-care platforms concentrate identity, payment, and clinical records in one attack surface [13]. Procurement committees now require HITRUST or equivalent certification, lengthening sales cycles for smaller vendors by roughly four months.


Telemedicine Market Opportunities

Hospital-at-Home Substitution

Acute care is migrating. Approved home-hospital programmes have grown past 380 participating U.S. facilities, and per-episode costs run 22–29% below inpatient equivalents [5]. Platforms that combine continuous monitoring with escalation logic and logistics orchestration capture a far higher contract value than consultation-only vendors.

Emerging-Economy Public Health Networks

Volume sits where infrastructure is thinnest. India's eSanjeevani service has logged more than 340 million cumulative consultations, and Indonesia, Vietnam, and Nigeria are replicating hub-and-spoke architectures with World Bank digital-health financing [10][12]. Vendors that price for USD 1–3 per encounter and operate on low-bandwidth builds can win multi-year sovereign contracts.

Clinical Data Monetisation and Evidence Services

Longitudinal remote-monitoring streams are commercially distinct from care delivery. Pharmaceutical sponsors paid an estimated USD 3.6 billion for decentralised trial infrastructure and real-world evidence access in 2025 [7]. Consent-governed data products let platforms build a second, higher-margin revenue line without adding clinician headcount.

Specialty Vertical Depth

Generalist urgent care is commoditising. Telepsychiatry, teledermatology, virtual oncology navigation, and remote maternal care sustain premium pricing because outcome measurement is tractable and payer willingness is documented.

Retail and Pharmacy Convergence

Pharmacy chains and insurers are absorbing distribution. Integrated dispensing plus consultation shortens the prescription-to-fill loop and lifts adherence metrics that payers already contract against [21].


Telemedicine Market Future Outlook

Autonomous Triage and Ambient Clinical Intelligence

Automation moves upstream. By 2030, we expect roughly 40% of first-contact encounters to be routed by AI triage engines with clinician oversight, compressing average time-to-appropriate-care from 38 hours to under 6 [8]. Regulatory clarity from the FDA's predetermined change control pathway allows models to update without full resubmission, which materially shortens iteration cycles [14].

Platform Economics and Vertical Integration

Consolidation logic is strengthening. Standalone consultation vendors face gross margin compression toward the low 30s, while integrated platforms bundling pharmacy, labs, and care management sustain margins above 50% [21]. Expect payer and retail acquirers to absorb subscale assets through 2029.

Interoperability as Competitive Moat

Standards adoption will separate winners from also-rans. TEFCA and the European Health Data Space together will govern data exchange for populations exceeding 800 million by 2032, and vendors without native FHIR R4 conformance will be structurally excluded from enterprise tenders [4][9].

Outcome-Linked Contracting

Payment design shifts again. Value-based virtual-care contracts, currently under 12% of enterprise agreements, should approach 35% by 2035 as payers gain confidence in remote outcome attribution [3]. Vendors will need clinical-grade measurement infrastructure, not engagement dashboards.


Telemedicine Market Segmentation

Segment structure across the Telemedicine Market reflects three axes: how care is delivered, what is purchased, and who signs the contract.

By Modality

Segment Metric (2025) Primary Demand Driver
Synchronous 41.2% share Established real-time encounter reimbursement
Asynchronous USD 38.83 Billion Specialist backlog relief in dermatology and radiology
Remote Patient Monitoring 15.89% CAGR Chronic-care management code expansion


Synchronous care retains primacy because payer infrastructure was built around it, and behavioural health alone accounts for close to a third of real-time volume [2]. Remote monitoring grows faster because it converts one-time encounters into continuous revenue; average annual contract value per enrolled patient sits between USD 480 and USD 720, with device costs amortised across multi-year enrolment.

By Component

Segment Metric (2025) Primary Demand Driver
Services 52.8% share Clinician staffing, integration, and managed operations
Software Platforms 15.10% CAGR Point-solution consolidation into unified suites
Hardware & Peripherals USD 20.71 Billion Connected diagnostic kits and monitoring devices


Services dominate because health systems buy outcomes, not licences, and clinician supply is the scarce input. Software is the faster-growing line as procurement teams retire fragmented estates: a typical large system ran 14 separate virtual-care tools in 2023 and targets fewer than 5 by 2027 [21]. Telepsychiatry leads specialty services at a 16.94% CAGR, reflecting acute workforce shortages against measurable outcome data.

By End User

Segment Metric (2025) Primary Demand Driver
Healthcare Providers 51.4% share Capacity extension and referral network control
Payers & Employers USD 27.86 Billion Cost avoidance and benefits differentiation
Patients / Home Users 13.89% CAGR Direct-pay convenience and subscription models
Government Agencies & NGOs 6.7% share Public access mandates and rural coverage obligations


Providers anchor spending because they control referral flow and carry clinical liability. Payer and employer budgets grow more predictably, though, and increasingly dictate platform selection through preferred-vendor arrangements that cover tens of millions of lives [3].


Regional Market Share Analysis

Region Metric (2025) Primary Investment Themes
North America 35.4% share Parity codification, employer virtual-first, hospital-at-home
Europe USD 33.04 Billion Cross-border e-prescription, national digital front doors
Asia-Pacific 18.22% CAGR (2026–2035) Sovereign platforms, internet hospitals, insurer-led scale
South America USD 6.41 Billion Regulatory legalisation, private-payer networks
Middle East & Africa 5.5% share Virtual hospitals, national vision programmes
Total USD 123.28 Billion

Regional performance in the Telemedicine Market diverges on reimbursement maturity rather than technology availability. Established payment frameworks reward depth; emerging systems reward reach.


North America

Country Metric Key Driver
US 87.4% share of region Medicare permanence and state parity statutes
Canada USD 3.89 Billion Provincial virtual-care fee schedules
Mexico 16.3% CAGR IMSS digital expansion and private clinic networks


Regulatory permanence gives the North American Telemedicine Market its unusual stability. Medicare's behavioural health provisions removed originating-site restrictions outright, while the FCC's Rural Health Care programme disbursed over USD 570 million in connectivity subsidies during 2025 [1][16]. Canadian provinces have standardised virtual encounter billing codes, though inter-provincial licensure remains a throughput constraint.

Europe

Country Metric Key Driver
Germany 21.6% share of region DiGA reimbursement pathway for digital applications
UK USD 6.28 Billion NHS App integration and elective backlog clearance
France 15.4% share of region Assurance Maladie teleconsultation coverage
Italy 14.9% CAGR PNRR territorial care funding
Spain USD 2.71 Billion Regional health service digitisation
Nordic Countries 11.2% share of region Mature EHR interoperability
Russia 8.7% CAGR Federal telemedicine legislation
Rest of Europe USD 4.36 Billion EU cross-border health directive uptake


Germany's DiGA framework remains the continent's clearest reimbursement on-ramp, with prescribed digital applications exceeding 1.1 million cumulative activations [9]. The European Health Data Space regulation, entering phased application through 2029, standardises secondary data use and will materially lower compliance costs for multi-country vendors [9].

Asia-Pacific

Country Metric Key Driver
China 33.8% share of region Internet-hospital licensing and insurance integration
India 21.19% CAGR Ayushman Bharat Digital Mission and eSanjeevani scale
Japan USD 5.94 Billion Online medical care fee revisions for elderly cohorts
South Korea 11.4% share of region Post-pilot legalisation of remote consultation
ASEAN 19.6% CAGR Private insurer partnerships and super-app distribution
Rest of Asia-Pacific USD 2.87 Billion Public-private rural access programmes


Scale in the Asia-Pacific Telemedicine Market comes from distribution, not from clinical differentiation. China's licensed internet hospitals surpassed 3,300 facilities with provincial insurance settlement enabled, while India's public platform delivers consultations at unit economics no Western vendor can match [10][11]. Japan's fee-schedule revisions have narrowed the reimbursement gap between remote and in-person encounters for chronic-disease follow-up.

South America

Country Metric Key Driver
Brazil 58.2% share of region Law 14.510 permanent telemedicine authorisation
Argentina USD 1.09 Billion Private prepaid health plan adoption
Rest of South America 17.8% CAGR Ministry-led rural connectivity projects


Brazil's 2022 statute converted emergency authorisation into permanent legal footing, and the Federal Council of Medicine has since issued practice standards covering remote prescription and record retention [15]. Private supplementary insurers, covering roughly 51 million lives, now drive the majority of commercial volume.

Middle East & Africa

Country Metric Key Driver
Saudi Arabia 31.7% share of region Seha Virtual Hospital and Vision 2030 health transformation
UAE USD 1.42 Billion Malaffi and Riayati health information exchanges
South Africa 18.9% CAGR Private hospital group virtual networks
Egypt USD 0.61 Billion Universal health insurance rollout
Rest of MEA 14.2% share of region Donor-funded primary care access programmes


Sovereign programmes dominate. Saudi Arabia's Seha Virtual Hospital connects more than 170 facilities and handles referrals across 44 specialties, functioning as a national tertiary backstop rather than a convenience layer [18]. Sub-Saharan deployments remain donor-dependent but are producing durable primary-care infrastructure in Kenya, Ghana, and Rwanda.


Telemedicine Market By Region, 2025-2035

Competitive Benchmarking

The telemedicine market is moderately concentrated and becoming less so. The estimated HHI is about 440, with the top five players accounting for about 29-33% of global sales. Regional champions in China, India and the Gulf take share that global vendors cannot address, and niche pure-plays continue to fracture the premium tiers. The firms with payer contracts and interoperability certifications, not the biggest panels of clinicians, will reap scale benefits.

Company Est. Revenue Share Range Key Offerings for Telemedicine Market Strategic Positioning
Teladoc Health ~8–11% Virtual primary care, chronic care management, behavioural health Broadest enterprise payer footprint
Ping An Healthcare and Technology ~6–9% Internet hospital, insurance-linked consultation, pharmacy Dominant China insurer-integrated model
Included Health ~4–6% Navigation, virtual primary care, specialty matching Employer-first, outcomes-contracted
Amwell ~3–5% Converge platform, hospital-branded virtual care Health-system white-label specialist
Evernorth (MDLIVE) ~3–5% Urgent care, dermatology, behavioural, primary care Payer-owned distribution advantage
Hims & Hers Health ~3–4% Direct-to-consumer subscription care and dispensing Consumer brand and pharmacy vertical integration
Koninklijke Philips ~3–4% Tele-ICU, remote monitoring, acute care telehealth Hospital-grade clinical infrastructure
GE HealthCare ~2–4% Remote diagnostics, imaging collaboration, monitoring Device-anchored enterprise relationships
Medtronic ~2–3% Cardiac and diabetes remote monitoring ecosystems Implantable-to-cloud data continuity
Doximity ~2–3% Clinician network, integrated video and workflow tools Physician-side distribution moat
Practo ~1–2% Consultation marketplace, clinic software, diagnostics Leading India consumer platform


Recent News & Developments

Deal flow and rulemaking across 2023–2025 reshaped competitive positions in the Telemedicine Market.

  • Centers for Medicare & Medicaid Services (November 2024): Finalised permanent coverage for behavioural telehealth without geographic restriction, removing the single largest reimbursement uncertainty for U.S. vendors [1]


  • Amwell and U.S. Defense Health Agency (January 2024): Advanced the Digital First initiative to extend virtual care across military treatment facilities serving roughly 9.6 million beneficiaries [19]
  • National Health Commission of China (June 2024): Expanded provincial insurance settlement for licensed internet hospitals, widening covered service categories [11]
  • Hims & Hers Health (May 2025): Launched integrated lab testing tied to subscription care plans, deepening its consumer diagnostic loop [21]
  • European Commission (March 2025): Concluded European Health Data Space negotiations, establishing phased obligations for secondary health data use through 2029 [9]
  • Saudi Ministry of Health (September 2024): Expanded Seha Virtual Hospital specialty coverage and added regional referral hubs under Vision 2030 health transformation [18]
  • Philips (February 2025): Extended its tele-ICU platform with predictive deterioration analytics for community hospital networks [20]


Telemedicine Market Report Scope

Parameter Detail
Market Scope Global telemedicine solutions spanning modality, component, end user, and geography.
Study Period 2021–2035 (Historical 2021–2024; Base Year 2025; Forecast 2026–2035)
CAGR 14.18% (2026–2035)
Market Size Checkpoints USD 123.28 Billion (2025); USD 145.37 Billion (2026); USD 479.67 Billion (2035)
Fastest Growing Segments Remote Patient Monitoring (modality); Software Platforms (component); Patients / Home Users (end user)
Companies Profiled 11 leading participants including Teladoc Health, Ping An Healthcare and Technology, Included Health, Amwell, Evernorth, Hims & Hers Health, Philips, GE HealthCare, Medtronic, Doximity, Practo
Valuation Currency USD Billion

FAQs

What contract structures reduce buyer risk when procuring Telemedicine Market solutions?
Per-member-per-month pricing with utilisation floors protects vendors, while outcome-linked holdbacks of 10–15% protect buyers. Insist on data-portability and exit-transition clauses before signing multi-year terms [3].
How should a health system evaluate build-versus-buy for virtual care?
Building rarely clears the hurdle below 250,000 covered lives, since integration and compliance overhead dominate. Buy platform infrastructure; build only the clinical protocols that differentiate your service line [24].
What integration failures most often derail Telemedicine Market deployments?
Single sign-on misconfiguration and non-conformant FHIR write-backs cause the majority of stalled rollouts. Require a production interoperability pilot against your live EHR instance before contract execution [4].
Which malpractice and liability considerations apply to remote care?
Coverage must explicitly name telehealth encounters and every state or country where clinicians practise. Many legacy policies exclude cross-jurisdictional remote care entirely, leaving uninsured exposure [9].
How do investors assess quality of revenue among Telemedicine Market operators?
Subscription and capitated revenue commands materially higher multiples than fee-per-visit income. Examine net revenue retention and payer contract duration rather than headline consultation volume [21].
What distinguishes clinical-grade remote monitoring from consumer wearables?
Clinical-grade devices carry regulatory clearance, validated accuracy ranges, and reimbursable device-supply codes. Consumer wearables generally lack the documentation required for billing or clinical decision-making [14].
Are digital health consultations viable for pre-operative and post-discharge pathways?
Yes, and readmission data supports it. Structured post-discharge remote follow-up reduces 30-day readmissions by roughly 18% in evaluated programmes, making it among the strongest returns available [5].      
Author
Author
Author Profile
Satyendra Maurya LinkedIn
Research Analyst
An accomplished research analyst with high proficiency in market forecasting, data visualization, competitive benchmarking, and others. He holds a pronounced track record in research and consulting projects for sectors such as life sciences, medical devices, and healthcare IT. His capabilities in qualitative and quantitative analysis have resulted in positive client outcomes. Working on niche market trends, opportunities, sales, and forecasted value is part of his skill set.
Co-Author
Co-Author Profile
Rahul Gotadki LinkedIn
Research Manager
He holds an experience of about 9+ years in Market Research and Business Consulting, working under the spectrum of Life Sciences and Healthcare domains. Rahul conceptualizes and implements a scalable business strategy and provides strategic leadership to the clients. His expertise lies in market estimation, competitive intelligence, pipeline analysis, customer assessment, etc.
Share::
Request Free Sample

Research Approach


Secondary Research

The secondary research process involved comprehensive analysis of regulatory databases, peer-reviewed digital health journals, clinical informatics publications, and authoritative health technology organizations. Key sources included the US Food & Drug Administration (FDA) Center for Devices and Radiological Health (CDRH), Federal Communications Commission (FCC) Health Care Division, Centers for Medicare & Medicaid Services (CMS) Telehealth Payment Eligibility Database, US Department of Health and Human Services (HHS) Office for Civil Rights, European Medicines Agency (EMA) Digital Health Unit, European Commission Health and Digital Executive Agency (HaDEA), International Telecommunication Union (ITU) ICT Statistics, World Health Organization (WHO) Digital Health Atlas, National Institutes of Health (NIH) National Library of Medicine (PubMed/MEDLINE), Journal of Medical Internet Research (JMIR) Publications, npj Digital Medicine, Telemedicine and e-Health Journal (Mary Ann Liebert), American Telemedicine Association (ATA) Policy Resource Center, Healthcare Information and Management Systems Society (HIMSS) Analytics, Digital Medicine Society (DiMe) Evidence Base, HealthIT.gov Interoperability Standards, OECD Health Statistics Digital Health Indicators, World Bank Digital Development Global Practice Reports, and national e-health agency publications from key markets. These sources were used to collect telehealth adoption metrics, regulatory clearance data for Software as a Medical Device (SaMD), remote monitoring clinical efficacy studies, reimbursement policy frameworks, connectivity infrastructure statistics, and platform security compliance documentation across video conferencing technologies, mobile health applications, wearable diagnostic devices, and web-based care delivery systems.


Primary Research

Interviews with supply-side and demand-side stakeholders were conducted as part of the main research process in order to gather qualitative and quantitative information on platform acceptance, integration difficulties, and the change of care delivery. CEOs, CTOs, Chief Medical Officers, Heads of Regulatory Affairs (SaMD/FDA 510(k)), Chief Product Officers, and VPs of Commercial Strategy from companies that provide telemedicine platforms, remote patient monitoring technology, EHR integration, connected wearable device manufacturers, and healthcare AI diagnostic firms were among the supply-side sources. Chief medical information officers (CMIOs), telehealth medical directors, healthcare CIOs, virtual care operations managers, directors of ambulatory clinics, and procurement leads from academic medical centers, community hospitals, multispecialty group practices, accountable care organizations (ACOs), commercial payer organizations, and integrated health systems were among the demand-side sources. Primary research verified remote monitoring device pipeline timelines, validated service type segmentation (real-time vs. asynchronous models), and collected information on payer reimbursement dynamics, specialty-specific adoption patterns, platform pricing models (per-consultation vs. subscription SaaS), clinical workflow integration, and behavioral health, pediatrics, emergency medicine, and pediatrics.

Primary Respondent Breakdown:

• By Designation: C-level Primaries (32%), Director Level (30%), Others (38%)

• By Region: North America (32%), Europe (30%), Asia-Pacific (28%), Rest of World (10%)


Market Size Estimation

Global market valuation was derived through revenue mapping, platform user analytics, and consultation volume analysis across synchronous and asynchronous care models. The methodology included:

• Identification of 50+ key technology vendors and platform providers across North America, Europe, Asia-Pacific, Latin America, and Middle East & Africa

• Product mapping across real-time video consultation platforms, remote patient monitoring ecosystems (RPM), store-and-forward imaging systems, mobile health applications (mHealth), web-based patient portals, and wearable diagnostic devices

• Analysis of reported and modeled annual revenues specific to telemedicine SaaS subscriptions, per-consultation licensing fees, device hardware sales, and integration services

• Coverage of platform providers and health tech vendors representing 72-78% of global market share in 2024

• Extrapolation using bottom-up (monthly active patient users × average revenue per user by service type; consultation volumes × average selling price by country/region) and top-down (vendor revenue validation against enterprise health system IT spending) approaches to derive segment-specific valuations for video conferencing, mobile health platforms, wearable monitoring technologies, and web-based care delivery systems

Key Differences from Original Methodology:

Regulatory sources: Shifted from aesthetic/plastic surgery agencies (ISAPS, ASDS) to digital health regulators (FCC, CMS, HealthIT.gov, EMA Digital Health Unit)

Primary respondents: Adjusted percentages across all categories (Company Tier changed from 42/33/25 to 38/35/27; Designation changed from 35/28/37 to 32/30/38; Regional changed from 35/27/30/8 to 32/30/28/10)

Stakeholder types: Modified from dermatologists/plastic surgeons to CMIOs, Telehealth Directors, and Healthcare CIOs; added SaMD regulatory specialists

Market sizing metrics: Added MAU (monthly active users), SaaS subscription models, and RPM device shipments alongside traditional revenue approaches

Share::
Request Free Sample
Download Free Sample

Kindly complete the form below to receive a free sample of this Report

* Please use a valid business email

Share::
Request Free Sample
Download PDF ×

We do not share your information with anyone. However, we may send you emails based on your report interest from time to time. You may contact us at any time to opt-out.
















