Increased Focus on Customer Experience
The visual analytics market is significantly influenced by the growing emphasis on customer experience. Organizations are leveraging visual analytics to gain deeper insights into customer behavior and preferences, enabling them to tailor their offerings accordingly. This focus on customer-centric strategies is driving the demand for visual analytics solutions that can provide actionable insights. As businesses aim to enhance customer satisfaction and loyalty, the visual analytics market is expected to see continued growth. Companies that effectively utilize visual analytics to understand and respond to customer needs are likely to gain a competitive edge in their respective industries.
Expansion of Business Intelligence Solutions
The visual analytics market is benefiting from the expansion of business intelligence (BI) solutions. As organizations strive to improve their analytical capabilities, the integration of visual analytics within BI platforms is becoming increasingly prevalent. This integration allows users to seamlessly access and analyze data, leading to more informed decision making. The BI market is projected to reach $40 billion by 2027, with visual analytics playing a crucial role in this growth. By providing users with the tools to visualize data in real-time, organizations can enhance their operational efficiency and responsiveness to market changes, thereby solidifying the relevance of visual analytics in the broader BI landscape.
Advancements in Technology and Infrastructure
The visual analytics market is expected to grow due to advancements in technology and infrastructure. Innovations in cloud computing, big data, and machine learning are enhancing the capabilities of visual analytics tools, making them more accessible and effective for organizations. As technology continues to evolve, businesses are increasingly adopting these advanced solutions to improve their analytical processes. The market for visual analytics is projected to expand as organizations invest in modern infrastructure that supports data integration and visualization. This trend indicates a shift towards more sophisticated analytics capabilities, positioning the visual analytics market as a critical component of future business strategies.
Rising Importance of Data Visualization Tools
The visual analytics market is witnessing a notable increase in the adoption of data visualization tools. These tools enable users to interpret complex data sets through intuitive graphical representations, making it easier to identify trends and patterns. As organizations generate vast amounts of data, the need for effective visualization becomes paramount. Reports indicate that the market for data visualization tools is expected to reach $10 billion by 2026, reflecting a growing recognition of their importance in the analytics process. This trend underscores the necessity for businesses to invest in visual analytics solutions that enhance their ability to communicate insights effectively and drive data-centric strategies.
Growing Demand for Data-Driven Decision Making
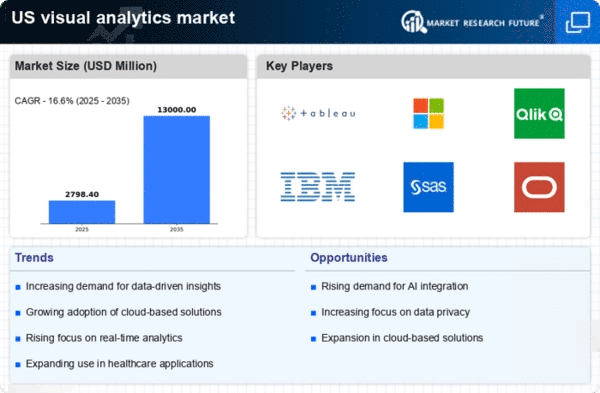
The visual analytics market is experiencing a surge in demand as organizations increasingly prioritize data-driven decision making. Companies across various sectors are recognizing the value of leveraging data insights to enhance operational efficiency and drive strategic initiatives. According to recent estimates, the market is projected to grow at a CAGR of approximately 25% from 2025 to 2030. This growth is fueled by the need for businesses to remain competitive in a rapidly evolving landscape. As organizations seek to harness the power of data, the visual analytics market is positioned to play a pivotal role in transforming raw data into actionable insights, thereby facilitating informed decision making and fostering innovation.


