Vanilla Bean Market

Key Players: Symrise AG, dsm-firmenich, Givaudan SA, Archer Daniels Midland (ADM), Nielson-Massey Vanillas, Prova SAS, Heilala Vanilla, Estรฉe Lauder Companies

Vanilla Bean Market

Vanilla Bean Market Size, Share, Industry Trend & Analysis Research Report By Form (Whole Vanilla Beans, Vanilla Extract & Vanilla Paste, Vanilla Powder), By Species (Vanilla Planifolia (Bourbon), Vanilla Tahitensis (Tahitian), Vanilla Pompona), By Application (Food & Beverage, Cosmetics & Personal Care, Pharmaceutical), By Region (North America, Europe, Asia-Pacific, South America, Middle East & Africa) - Forecast to 2035
ID: MRFR/FnB/36631-HCR
128 Pages
Sakshi Gupta
Last Updated: June 22, 2026

Vanilla Bean Market Summary

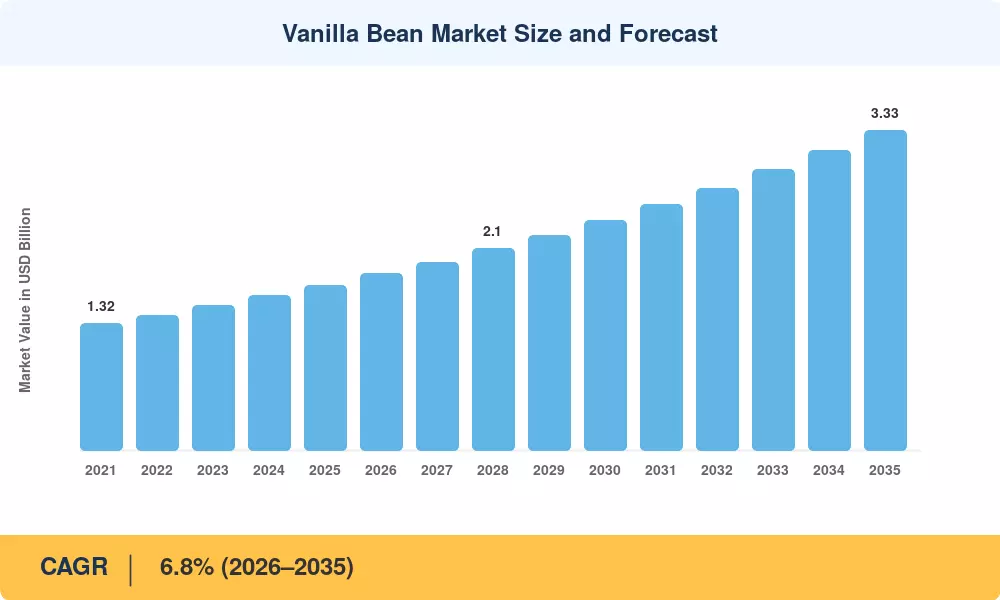
The vanilla bean market reached an estimated USD 1.72 billion in 2025 and is projected to grow from USD 1.84 billion in 2026 to USD 3.33 billion by 2035, registering a CAGR of 6.8% across the forecast period. Clean-label legislation in the EU and the U.S. FDA's tightened guidelines on "natural flavor" declarations have pushed food manufacturers to replace synthetic vanillin with natural vanilla flavor compounds, creating a demand floor that price volatility alone cannot erode [2]. The global ice cream sector โ€” valued at over USD 90 billion โ€” remains the single largest consumption channel, and premium brands increasingly specify origin-traceable vanilla planifolia cultivation sources from Madagascar and Comoros [3].

Supply-side transformation is accelerating across the vanilla bean market. Controlled-environment agriculture pilots in Israel, Australia, and the Netherlands are challenging the centuries-old model of open-field vanilla planifolia cultivation by compressing the 9-month curing and drying vanilla beans cycle to under 4 months using enzymatic and ultrasonic post-harvest techniques [4]. Blockchain-verified traceability platforms now cover roughly 18% of globally traded vanilla extract and vanilla paste volumes, up from less than 3% in 2020 [5].

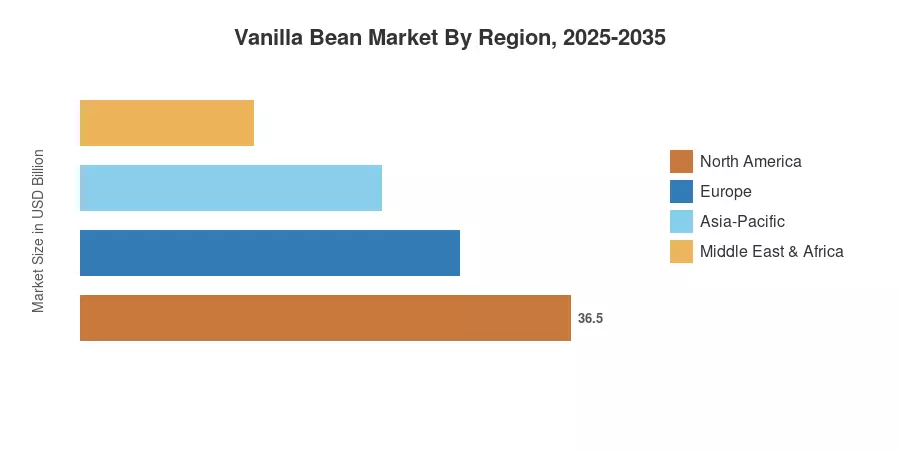
North America holds an estimated 35.2% share of the vanilla bean market, anchored by the United States' outsized demand for natural vanilla flavor compounds in dairy, bakery, and personal-care formulations. Asia-Pacific represents the fastest-growing region at a projected CAGR of 7.8%, driven by rising consumption of Western-style desserts in China and India. Europe remains the second-largest consumption base, accounting for roughly 28.4% of global value, with France and Germany serving as refining and re-export hubs for Madagascar and Tahitian vanilla beans.

ย 

Key Report Takeaways

โ€ข By Form

  • Whole vanilla beans commanded the largest revenue share in the vanilla bean market in 2025, driven by artisanal bakery and fine-dining demand for premium-grade pods.
  • Vanilla extract and vanilla paste collectively represent the fastest-growing form segment at a CAGR of 7.4%, fueled by industrial food-processing scalability.

โ€ข By Application

  • Food and beverage applications accounted for over 68% of the global vanilla bean market consumption in 2025, with ice cream and confectionery as dominant end-use channels.
  • Cosmetics and personal-care applications are projected to reach USD 0.52 billion by 2035 as Madagascar and Tahitian vanilla beans gain traction in fragrance formulations.

โ€ข By Region

  • North America held a 35.2% share of the vanilla bean market in 2025, supported by robust clean-label and organic certification mandates.
  • Asia-Pacific is expected to register a 7.8% CAGR through 2035, with China and India leading demand for natural vanilla flavor compounds.

ย 

Vanilla Bean Market Size and Forecast (2021โ€“2035)

MRFR's market sizing combines customs trade data from UN Comtrade, farm-gate price surveys in Madagascar, Uganda, and Papua New Guinea, and proprietary demand-side modeling calibrated against quarterly earnings disclosures from leading flavor houses. Historical values reflect actual traded volumes adjusted for quality-grade price differentials; forecast values apply an econometric model linking clean-label regulatory adoption, vanilla planifolia cultivation area expansion, and downstream reformulation rates[7].

Vanilla Bean Market Size and Forecast
Our Impact
Enabled $4.3B Revenue Impact for Fortune 500 and Leading Multinationals
Partnering with 2000+ Global Organizations Each Year
30K+ Citations by Top-Tier Firms in the Industry

Driver Impact Analysis

Driver ~% Impact on CAGR Geographic Relevance Impact Timeline
Clean-label and natural-flavor regulations +1.4% North America, Europe Short-term (โ‰ค2 yr)
Premium ice cream and confectionery growth +1.1% Global Medium-term (2โ€“4 yr)
Blockchain traceability and farmer pre-financing +0.8% Madagascar, East Africa Medium-term (2โ€“4 yr)
Asia-Pacific Western dessert adoption +0.9% China, India, ASEAN Long-term (โ‰ฅ4 yr)
Controlled-environment vanilla planifolia cultivation +0.6% Israel, Australia, Netherlands Long-term (โ‰ฅ4 yr)
Personal-care and fragrance reformulation +0.5% Europe, North America Medium-term (2โ€“4 yr)
Carbon-credit and ESG-linked vanilla sourcing +0.4% Global Long-term (โ‰ฅ4 yr)

ย 

Clean-Label Regulatory Tailwinds

The U.S. FDA's long standing 21 CFR 169 standards and the EU's Regulation (EC) No 1334/2008 both tighten the definition of "natural flavoring," requiring that vanilla extract and vanilla paste used in consumer products derive from Vanilla planifolia or Vanilla tahitensis rather than biofermented vanillin [2]. These mandates affect an estimated USD 14 billion in labeled food products across North America and Europe, forcing reformulation toward genuine natural vanilla flavor compounds and creating inelastic demand within the vanilla bean market [2][9].

Premium Ice Cream and Confectionery Expansion

In 2024, global sales of premium ice cream topped USD 28 billion. In addition, vanilla with origin labels, particularly Madagascar and Tahitian vanilla beans, are commanding a 40-60% price premium over commodity-grade pods in the B2B ingredient channel [3]. Brands like Hรคagen-Dazs, Magnum, and local artisanal producers describe curing and drying techniques for vanilla beans that leave vanillin, p-hydroxybenzaldehyde, and other natural vanilla flavor components that taste chemists prize [3][12].

ย 

Blockchain Traceability and Supply-Chain Financing

In a pilot project with 450 Malagasy farmers, Estรฉe Lauder demonstrated that blockchain-verified traceability reduced bean theft by an estimated 11% and justified a 15% retail premium on traceable vanilla extract and vanilla paste [5]. Symrise, Givaudan, and DSM-Firmenich have each developed farmer pre-financing programmes that lock-in supply of premium-cured vanilla planifolia cultivation output while generating verified carbon credits [5][11].

ย 

Asia-Pacific Dessert Culture Shift

Rising disposable incomes in China and India are transforming the vanilla bean market as customers transition from synthetic-vanillin-flavored items to real vanilla in bakeries, cafรฉs, and packaged dessert brands. In 2024, Indiaโ€™s FSSAI published draft guidelines that would require processed foods to disclose synthetic vs natural vanilla, which may spur demand for imported vanilla beans, curing, and drying products [10].

ย 

ย 

Restraints Impact Analysis

Restraint ~% Impact on CAGR Geographic Relevance Impact Timeline
Madagascar supply concentration and cyclone risk โˆ’0.9% Global (supply-side) Short-term (โ‰ค2 yr)
Price volatility and speculative trading โˆ’0.7% Global Short-term (โ‰ค2 yr)
Synthetic vanillin substitution pressure โˆ’0.6% Asia-Pacific, South America Medium-term (2โ€“4 yr)
Narrow genetic diversity of Vanilla planifolia โˆ’0.5% Madagascar, Comoros Long-term (โ‰ฅ4 yr)
Organized theft and quality fraud โˆ’0.4% Madagascar Medium-term (2โ€“4 yr)

ย 

Madagascar Supply Concentration

Madagascar accounts for over one-third of global vanilla production, and the island's eastern coast is one of the world's most cyclone-exposed agricultural zones [8]. A single severe cyclone season can destroy 20โ€“30% of the standing crop, sending farm-gate prices of vanilla planifolia cultivation output from USD 250/kg to over USD 500/kg within weeks [8][13]. This fragility makes forward planning for vanilla extract and vanilla paste manufacturers exceptionally difficult.

Synthetic Vanillin Substitution

Synthetic vanillin โ€” produced from guaiacol, lignin, or biofermented ferulic acid โ€” costs roughly 1/100th to 1/250th of natural vanilla and captures over 95% of global vanillin volume by weight [14]. In cost-sensitive segments across Asia-Pacific and South America, synthetic substitutes directly suppress demand growth in the vanilla bean market, particularly in commodity baked goods and low-price-point beverages where consumers cannot distinguish natural vanilla flavor compounds from synthetic alternatives [14].

Genetic Vulnerability

More than 95% of the commercially grown vanilla globally is derived from a single clonal lineage of Vanilla planifolia, resulting in severe vulnerability to Fusarium root rot and other diseases [15]. Breeding projects at CIRAD (France) and the University of Rรฉunion are seeking to introduce disease resistance, but the 3โ€“4 year juvenile period of vanilla hampers the variety release cycles within the vanilla bean market [15].

ย 

ย 

Vanilla Bean Market Opportunities

Controlled-Environment Cultivation

Indoor vertical-farm pilots by Vanilla Vida (Israel) and Australian Vanilla have demonstrated year-round pollination and enzymatic curing and drying vanilla beans processes that compress the traditional 6-9-months farm-to-extract timeline to under 3 months [4]. If production costs fall below USD 300/kg, these facilities could supply 8โ€“12% of global vanilla bean market demand by 2032.

Carbon-Credit Vanilla Programs

Agroforestry-based vanilla planifolia cultivation in Madagascar and Uganda sequesters an estimated 2.5โ€“4.0 tonnes of COโ‚‚ per hectare annually, creating a stackable revenue stream for smallholders through voluntary carbon markets [11]. Flavor houses that bundle carbon credits with traceability-verified vanilla extract and vanilla paste can command an additional 10โ€“15% premium from ESG-committed FMCG clients.

Value-Added Vanilla Products in E-Commerce

Direct-to-consumer brands selling single-origin Madagascar and Tahitian vanilla beans have grown at over 25% annually on platforms such as Amazon and specialty food marketplaces [16]. This channel enables grower cooperatives to bypass traditional intermediary margins and capture USD 50โ€“80/kg more than wholesale pricing, expanding the addressable vanilla bean market at the premium end.

Pharmaceutical and Nutraceutical Applications

Vanillin's demonstrated anti-inflammatory and antioxidant properties have attracted clinical interest, with studies published since 2020 exploring natural vanilla flavor compounds for adjunctive therapy in metabolic syndrome and neurodegenerative conditions [17]. Pharmaceutical-grade vanilla extract and vanilla paste represent a nascent but high-margin segment within the vanilla bean market.

African Origin Diversification

Uganda, Tanzania, and the Democratic Republic of Congo combined boosted the area under vanilla planifolia cultivation by 35% between 2020 and 2024, allowing purchasers regional diversification away from Madagascarโ€™s corridor exposed to cyclones [8]. East Africa may be a USD200-million-plus origin by 2030 if it invests in local curing and drying vanilla beans infrastructure.

ย 

ย 

Vanilla Bean Market Future Outlook

Supply-Chain Digitization and AI-Powered Quality Grading

Machine-vision systems and near-infrared spectroscopy are entering the curing and drying vanilla beans value chain, enabling real-time vanillin-content grading that replaces subjective visual inspection [4]. By 2030, AI-driven quality assessment could reduce post-harvest losses in the vanilla bean market by 15โ€“20%, simultaneously lowering costs for vanilla extract and vanilla paste manufacturers and improving consistency for end-users [4][12].

Origin Diversification Beyond Madagascar

The vanilla bean market is gradually shifting away from single-origin dependence. Uganda's vanilla planifolia cultivation acreage doubled between 2019 and 2024, and Indonesia's Sulawesi region is attracting flavor-house investment in curing infrastructure [8]. Papua New Guinea and Tonga offer differentiated flavor profiles โ€” floral, fruity, and anise-forward โ€” that appeal to craft producers seeking alternatives to standard Madagascar and Tahitian vanilla beans [7].

ESG Integration and Deforestation-Free Supply Chains

The U.S. FOREST Act proposals will compel importers to demonstrate that vanilla planifolia cultivation does not contribute to primary-forest conversion [9][11]. Companies that invest early in agroforestry certification and carbon-credit programs will secure preferential access to the vanilla bean market's fastest-growing buyer segments, particularly in European personal care and North American organic food [11].

Precision Fermentation and Hybrid Flavor Systems

Biotech firms producing nature-identical vanillin via precision fermentation will continue to compete at the commodity end of the vanilla bean market, but the complexity of natural vanilla โ€” which contains over 250 distinct natural vanilla flavor compounds โ€” ensures that whole-bean and cold-extracted vanilla extract and vanilla paste retain a defensible premium position through 2035 [14][17].

ย 

Vanilla Bean Market Segmentation

By Form

Segment Key Metric Primary Demand Driver
Whole Vanilla Beans 41.3% share (2025) Artisanal bakery, fine dining, premium retail
Vanilla Extract & Vanilla Paste CAGR 7.4% Industrial food processing scalability
Vanilla Powder USD 0.19 Billion (2025) Dry-mix products and nutraceutical blending

ย 

Whole vanilla beans remain the backbone of the vanilla bean market's value structure, commanding premium pricing due to labor-intensive hand-pollination and the 6โ€“9-month curing and drying vanilla beans process required to develop full flavor [12]. Madagascar Bourbon beans โ€” the industry's gold standard from vanilla planifolia cultivation โ€” account for the majority of whole-bean trade volume, while Tahitian beans (Vanilla tahitensis) occupy a niche prized by pastry chefs for their floral, cherry-forward profile.

Vanilla extract and vanilla paste represent the fastest-growing form segment, driven by food manufacturers seeking shelf-stable, dosage-consistent natural vanilla flavor compounds that integrate seamlessly into large-batch production lines [3]. Co-extracted blends that combine Madagascar and Tahitian vanilla beans in a single paste format are gaining traction among premium ice cream and beverage brands seeking complex flavor layering.

By Application

Segment Key Metric Primary Demand Driver
Food & Beverage 68.2% share (2025) Ice cream, bakery, confectionery, dairy
Cosmetics & Personal Care CAGR 8.1% Fragrance, skincare, clean-beauty trend
Pharmaceutical USD 0.06 Billion (2025) Vanillin bioactivity research; excipient use

ย 

Food and beverage applications dominate the vanilla bean market, with ice cream alone consuming an estimated 35% of global natural vanilla supply. Clean-label trends in North America and Europe have prompted major CPG brands to replace synthetic vanillin with natural vanilla flavor compounds sourced from traceable vanilla planifolia cultivation origins [2][3].

Cosmetics and personal care is the fastest-growing applications in the vanilla bean market. Luxury fragrance houses in France and the United States increasingly specify single-origin Madagascar and Tahitian vanilla beans for base-note formulations, while the clean-beauty movement elevates demand for naturally derived vanilla extract and vanilla paste in skincare.

By Species

Segment Key Metric Primary Demand Driver
Vanilla Planifolia (Bourbon) 82.6% share (2025) Industry-standard flavor; Madagascar origin
Vanilla Tahitensis (Tahitian) CAGR 7.9% Floral-profile niche; pastry and fragrance
Vanilla Pompona USD 0.02 Billion (2025) Regional Caribbean and Central American use

ย 

Vanilla planifolia cultivation accounts for the vast majority of global production and trade, with Madagascar, Comoros, and Uganda serving as primary origins. Vanilla tahitensis, cultivated primarily in French Polynesia and Papua New Guinea, is the fastest-growing species in the vanilla bean market due to its distinctive Madagascar and Tahitian vanilla bean flavor contrast that appeals to specialty food and fragrance buyers [7][12].

ย 

Regional Market Share Analysis

Region Key Metric Primary Investment Themes
North America 35.2% share (2025) Clean-label mandates; premium dairy and bakery
Europe 28.4% share (2025) Fragrance/flavor refining; deforestation compliance
Asia-Pacific 7.8% CAGR (2026โ€“2035) Western dessert adoption; India regulatory push
South America USD 0.15 Billion (2025) Domestic cultivation pilots; confectionery growth
Middle East & Africa 5.8% CAGR (2026โ€“2035) Halal-certified natural flavors; UAE F&B tourism
Total USD 1.72 Billion (2025) โ€”

The vanilla bean market exhibits a concentrated demand structure, with North America and Europe together accounting for over 63% of global consumption value. Asia-Pacific is reshaping the competitive balance through the accelerated adoption of natural vanilla flavor compounds in processed food and cosmetics.

ย 

North America

Country Key Metric Key Driver
United States 78.3% of regional share FDA natural-flavor labeling compliance
Canada CAGR 6.4% Organic vanilla demand in specialty retail
Mexico USD 0.03 Billion Domestic Vanilla planifolia cultivation revival

ย 

The United States drives the bulk of the North American vanilla bean market demand, consuming an estimated 2,400 metric tonnes of cured beans annually for ice cream, baked goods, and premium personal-care products. Canada's organic-certified food sector has expanded by 9% year-over-year, elevating demand for traceable Madagascar and Tahitian vanilla beans, while Mexico โ€” the botanical origin of Vanilla planifolia โ€” is reviving small-scale cultivation in Veracruz and Puebla states [18].

Europe

Country Key Metric Key Driver
Germany 22.1% of regional share Flavor-house processing hub
United Kingdom CAGR 6.1% Artisanal bakery and premium ice cream
France USD 0.11 Billion Fragrance refining and re-export
Italy CAGR 5.8% Gelato and confectionery premiumization
Spain 5.4% of regional share Horeca sector expansion
Nordic Countries CAGR 6.3% Clean-label consumer preferences
Russia USD 0.02 Billion Import-substitution confectionery demand
Rest of Europe 14.7% of regional share EU deforestation regulation compliance

ย 

Europe functions as both a consumption center and a processing gateway for the vanilla bean market. Germany's Hamburg and France's Grasse remain the primary refining hubs where raw Madagascar and Tahitian vanilla beans are converted into vanilla extract and vanilla paste for distribution across the continent. The EU Deforestation Regulation (EUDR), effective June 2025, requires full traceability of imported vanilla, accelerating investment in blockchain-verified curing and drying vanilla bean supply chains [9].

Asia-Pacific

Country Key Metric Key Driver
China CAGR 8.2% Premium bakery and cafรฉ chain expansion
India 7.9% CAGR FSSAI natural-flavor disclosure guidelines
Japan 18.4% of regional share High-end confectionery and cosmetics
South Korea USD 0.04 Billion K-beauty natural ingredient sourcing
ASEAN CAGR 7.1% Tourism-driven foodservice growth
Rest of Asia-Pacific 9.2% of regional share Papua New Guinea vanilla cultivation

ย 

Asia-Pacific is the fastest-growing region in the vanilla bean market, fueled by a consumer shift toward premium, Western-style desserts in China's tier-1 and tier-2 cities. India's draft FSSAI guidelines on natural versus synthetic flavor disclosure could unlock substantial demand for natural vanilla flavor compounds among domestic food processors, while Japan's established appetite for high-quality vanilla planifolia cultivation output sustains premium pricing [10].

South America

Country Key Metric Key Driver
Brazil 52.8% of regional share Confectionery and dairy industry scale
Argentina CAGR 5.6% Dulce de leche and artisanal bakery
Rest of South America USD 0.03 Billion Emerging vanilla cultivation in Ecuador

ย 

Brazil anchors South American demand in the vanilla bean market, with large-scale dairy and confectionery manufacturers increasingly specifying natural vanilla extract and vanilla paste to meet export-market labeling requirements for the U.S. and EU [18].

Middle East & Africa

Country Key Metric Key Driver
Saudi Arabia 28.5% of regional share Vision 2030 F&B tourism investment
UAE CAGR 6.9% Premium hotel and foodservice demand
South Africa USD 0.02 Billion Growing artisanal food culture
Egypt CAGR 5.3% Confectionery import growth
Rest of MEA 31.4% of regional share Madagascar and Comoros as production origins

ย 

The Middle East & Africa region plays a dual role in the vanilla bean market โ€” as both a production origin (Madagascar, Comoros, Uganda) and a fast-growing consumption zone. Saudi Arabia's Vision 2030 hospitality investments and the UAE's premium hotel and restaurant sector create robust demand for natural vanilla flavor compounds and high-grade curing and drying vanilla bean products [11].

ย 

Vanilla Bean Market By Region, 2025-2035

Competitive Benchmarking

The vanilla bean market is moderately concentrated at the processing and distribution stage, with the top five flavor houses controlling an estimated 38โ€“45% of global trade value. The Herfindahl-Hirschman Index (HHI) for the processing segment is approximately 1,100โ€“1,300, indicating moderate concentration, while upstream production remains highly fragmented among roughly 200,000 smallholder farmers[5].

Company Est. Revenue Share Range Key Offerings Strategic Positioning
Symrise AG ~8โ€“11% Vanilla sourcing, natural flavor compounds, traceability Vertically integrated Madagascar operations
dsm-firmenich ~7โ€“10% Vanilla extract and vanilla paste, fragrance ingredients Combined flavor-fragrance platform post-merger
Givaudan SA ~7โ€“9% Premium vanilla extract, natural flavor compounds Direct farmer partnerships in Uganda and Madagascar
Archer Daniels Midland (ADM) ~5โ€“8% Sweet-flavor portfolio, vanilla extraction Revela Foods acquisition (2024) for dairy-flavor synergies
McCormick & Company ~4โ€“7% Consumer and industrial vanilla extract and vanilla paste Retail brand dominance in North America
Nielson-Massey Vanillas ~3โ€“5% Single-origin Madagascar and Tahitian vanilla beans, paste Premium artisanal positioning
Prova SAS ~3โ€“5% Vanilla extract, cocoa-vanilla blends European B2B flavor specialist
Heilala Vanilla ~2โ€“4% Tongan-origin vanilla, sustainable sourcing Carbon-neutral supply chain certification
Estรฉe Lauder Companies ~2โ€“3% Vanilla-based fragrance ingredients Blockchain traceability pilot in Madagascar
Vanilla Vida ~1โ€“2% Controlled-environment vanilla planifolia cultivation Technology-driven indoor farming model

ย 

ย 

Recent News & Developments

  • ADM (January 2024): Completed the acquisition of Revela Foods to expand dairy-flavor capabilities and secure additional vanilla extraction capacity across its sweet-flavor portfolio [19].
  • Symrise AG (June 2024): Announced a five-year, USD 25-million farmer pre-financing program in Madagascar's SAVA region to stabilize vanilla planifolia cultivation supply and improve the quality of curing and drying vanilla beans [5].

ย 

  • Givaudan SA (September 2024): Launched a carbon-credit pilot linking agroforestry-based vanilla planifolia cultivation in Uganda to voluntary carbon markets, targeting 5,000 tonnes of verified COโ‚‚ offsets annually [11].
  • Estรฉe Lauder (November 2024): Expanded its blockchain traceability pilot from 450 to 1,200 Malagasy farmers, reporting a further reduction in bean theft and improved quality grading for natural vanilla flavor compounds [5].
  • FSSAI (India) (January 2025): Published draft guidelines requiring labeling disclosure of synthetic versus natural vanilla in processed foods, a move expected to accelerate imports of vanilla extract and vanilla paste into India [10].

ย 

ย 

Vanilla Bean Market Report Scope

Parameter Detail
Market Scope Global vanilla bean market covering whole beans, extract, paste, and powder across food & beverage, cosmetics, and pharmaceutical applications
Study Period 2021โ€“2035
CAGR 6.8% (2026โ€“2035)
Market Size (2025) USD 1.72 Billion
Market Size (2035) USD 3.33 Billion
Fastest Growing Segment Vanilla Extract & Vanilla Paste (by form); Asia-Pacific (by region)
Companies Profiled Symrise, dsm-firmenich, Givaudan, ADM, McCormick, Nielson-Massey, Prova, Heilala, Estรฉe Lauder, Vanilla Vida
Valuation Currency USD Billion

ย 

ย 

FAQs

How does the vanillin content in cured beans vary by origin, and why does it matter for procurement?

Madagascar Bourbon beans typically contain 1.6โ€“2.4% vanillin, while Tahitian beans average 1.0โ€“1.4% with higher anisyl-compound concentrations. Procurement teams should match origin chemistry to product flavor profiles [12].

What shelf-life considerations affect bulk purchasing of natural vanilla extract and vanilla paste?

Properly stored vanilla extract retains potency for 3โ€“5 years, while vanilla paste degrades faster due to seed-pulp oxidation. Buyers should specify nitrogen-flushed packaging for paste orders exceeding 6-month inventory horizons [12].

How do EU Deforestation Regulation requirements change vanilla sourcing compliance costs?

EUDR geo-traceability documentation adds an estimated USD 0.80โ€“1.50 per kilogram to import costs. Buyers sourcing from EUDR-compliant cooperatives can pre-negotiate price adjustments to absorb this overhead [9].

What role does hand-pollination play in constraining vanilla bean market supply scalability?

Each Vanilla planifolia flower must be hand-pollinated within a 12-hour window, limiting per-farmer output to roughly 50 kg of green beans annually. This labor bottleneck keeps natural vanilla inherently supply-constrained [15].

How do precision-fermentation vanillin producers affect pricing for natural vanilla beans?

Biofermented vanillin competes primarily in the sub-USD 15/kg commodity segment and exerts minimal direct pricing pressure on natural beans trading above USD 300/kg. The two products serve largely non-overlapping buyer segments [14].

What insurance or hedging instruments exist for managing vanilla price volatility?

No standardized futures contract exists for vanilla. Buyers typically manage risk through fixed-price forward contracts with flavor houses or by blending origins to reduce single-source exposure [13].

How does the 6โ€“9 month curing and drying vanilla beans cycle create working-capital challenges for mid-size processors?

The extended curing timeline locks up capital for 8โ€“14 months from green-bean purchase to finished-extract sale. Pre-financing programs from major flavor houses partially address this gap for certified suppliers [5][8]. ย  ย 
Author
Author
Author Profile
Sakshi Gupta LinkedIn
Team Lead - Research
Currently a Team Lead in consumer goods, FMCG, and F&B, she translates rigorous research into decisive strategy. She develops GTM roadmaps, pricing architectures, and competitive benchmarks for companies across Europe, the US, and APAC. She synthesize insights, align cross-functional teams, and drive execution from brief to measurable outcomes. She leads end-to-end engagements with crisp analysis, compelling storytelling, and a strong command of Power BI, Tableau, SQL, and advanced research platforms.

Research Approach

ย 

Secondary Research

The secondary research process involved comprehensive analysis of agricultural databases, food science journals, commodity trade publications, and authoritative agricultural and food safety organizations. Key sources included the Food and Agriculture Organization of the United Nations (FAO), International Trade Centre (ITC), United States Department of Agriculture (USDA) Foreign Agricultural Service, European Food Safety Authority (EFSA), Food Standards Australia New Zealand (FSANZ), Bureau of Indian Standards (BIS), Madagascar National Institute of Statistics (INSTAT), Indonesian Ministry of Agriculture, Comoros National Center for Documentation and Scientific Research (CNDRS), International Federation of Essential Oils and Aroma Trades (IFEAT), International Organization for Standardization (ISO) Technical Committee 34 (Food Products), World Customs Organization (WCO) Harmonized System Committee, International Monetary Fund (IMF) Commodity Price Statistics, World Bank Commodity Markets Outlook, International Vanilla Exporters Association (IVEA), Sustainable Vanilla Initiative (SVI), Rainforest Alliance Certification Database, Fairtrade International Standards, and national customs and export promotion agencies from key vanilla-producing regions. These sources were utilized to collect production statistics, export/import trade data, quality certification standards, price trend analysis, cultivation area data, and supply chain mapping for natural vanilla beans, organic vanilla beans, and synthetic vanilla flavoring across whole bean, powder, and extract forms.

ย 

Primary Research

In order to gather both qualitative and quantitative insights, supply-side and demand-side stakeholders were interviewed during the primary research process. Managing Directors, Heads of Sourcing and Procurement, Quality Assurance Managers, and Export Operations were examples of supply-side sources. Managers from cooperatives, flavor houses, curing factories, vanilla bean growers, and spice trading firms. Procurement directors from food and beverage businesses, R&D heads from cosmetics and personal care companies, flavor chemists from pharmaceutical companies, executive chefs from culinary institutes, and category managers from retail and e-commerce platforms were examples of demand-side suppliers. In addition to confirming organic certification timelines and validating market segmentation across food and beverage, cosmetics and personal care, pharmaceutical, and culinary applications, primary research also gathered information on quality grading preferences, pricing volatility management, and the adoption of sustainable sourcing.

Primary Respondent Breakdown:

By Designation: C-level Primaries (28%), Director Level (35%), Others (37%)

By Region: North America (32%), Europe (29%), Asia-Pacific (28%), Rest of World (11%)

ย 

Market Size Estimation

Global market valuation was derived through production volume mapping and revenue analysis across the value chain. The methodology included:

Identification of 60+ key stakeholders across Madagascar, Indonesia, Mexico, Papua New Guinea, Uganda, India, and other producing regions

Product mapping across natural vanilla beans (Bourbon, Tahitian, Mexican varieties), organic certified beans, synthetic vanillin, and alternative natural flavors

Analysis of reported and modeled annual revenues specific to vanilla bean portfolios from raw material suppliers to finished flavor manufacturers

Coverage of stakeholders representing 75-80% of global market share in 2024

Extrapolation using bottom-up (production volume ร— farm-gate/FOB/retail pricing by grade and origin) and top-down (processor and flavor house revenue validation) approaches to derive segment-specific valuations for whole beans, powder, and extract forms across food industry, household, and perfume and fragrance industry end uses

Download Free Sample

Kindly complete the form below to receive a free sample of this Report

Download PDF ×

We do not share your information with anyone. However, we may send you emails based on your report interest from time to time. You may contact us at any time to opt-out.