Water Softening Systems Market (2025 - 2035)

Water Softening Systems Market Research Report By Technology (Ion Exchange, Salt-Free Conditioning, Reverse Osmosis Hybrid, Magnetic / Electronic), By Application (Residential, Commercial, Industrial), By Distribution Channel (Direct / OEM, Dealer / Installer, Retail / E-Commerce) and By Regional (North America, Europe, South America, Asia Pacific, Middle East and Africa) - Industry Forecast to 2035
ID: MRFR/Equip/6299-HCR
100 Pages
Varsha More
Last Updated: July 13, 2026
Water Softening Systems Market
Market Size
Forecast Period2025-2035
CAGR (2025-2035)7.2%
2025 Market SizeUSD 3.20 Billion
2035 Market SizeUSD 6.41 Billion
Key Players
Culligan International
Pentair plc
A.O. Smith Corporation
EcoWater Systems
BWT AG
Kinetico Incorporated
Opportunities
  • Subscription and Softener-as-a-Service Models
  • Salt-Free and Hybrid Technology Commercialization
  • Smart Water Management Integration

Water Softening Systems Market Summary

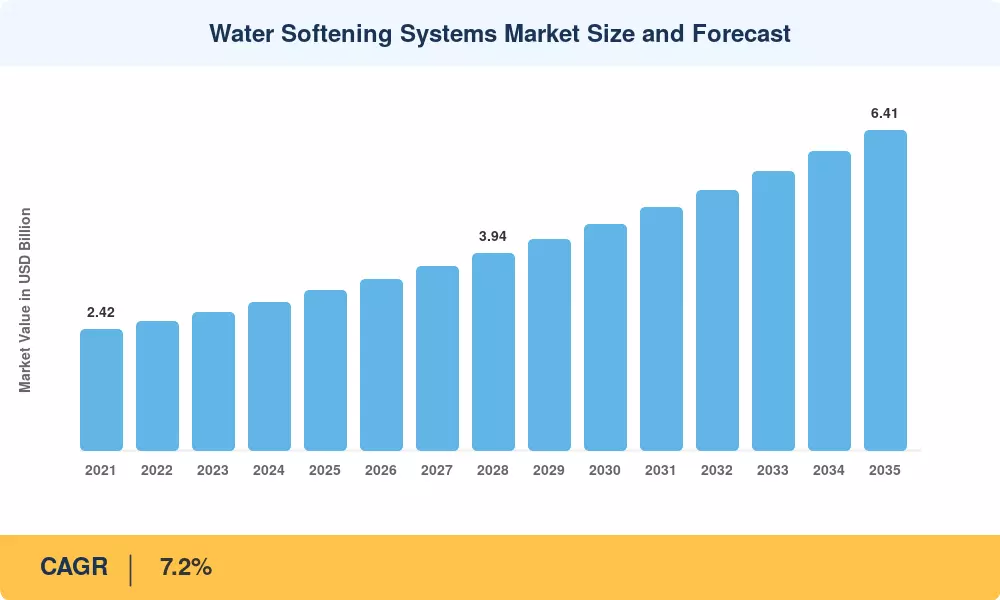
The global Water Softening Systems Market reached an estimated USD 3.20 billion in 2025 and is projected to grow from USD 3.43 billion in 2026 to USD 6.41 billion by 2035, registering a CAGR of 7.2% during the forecast period (2026โ€“2035). Two catalysts stand out: tightening drinking water quality regulations across the U.S. EPA and European DWD recast frameworks, and the accelerating replacement cycle for aging municipal water infrastructure โ€” a pipeline the American Water Works Association values at over USD 1 trillion through 2040 [1]. Together, these forces are pulling residential, commercial, and industrial buyers toward advanced water treatment at a pace the industry hasn't seen in over a decade.

Legacy single-tank timer-based softeners are being replaced by digitally controlled, metered-on-demand machines that reduce salt use by 30โ€“40% and water waste by up to 50% [2]. Meanwhile, template-assisted crystallization and catalytic media technologies are establishing themselves in niches where brine discharge rules restrict conventional salt-based systems. Since 2023, California and other EU member states have adopted or imposed stricter discharge limitations [3]. The Water Softening Systems market is transitioning from a commoditized replacement growth cycle to a technology-differentiated growth cycle.

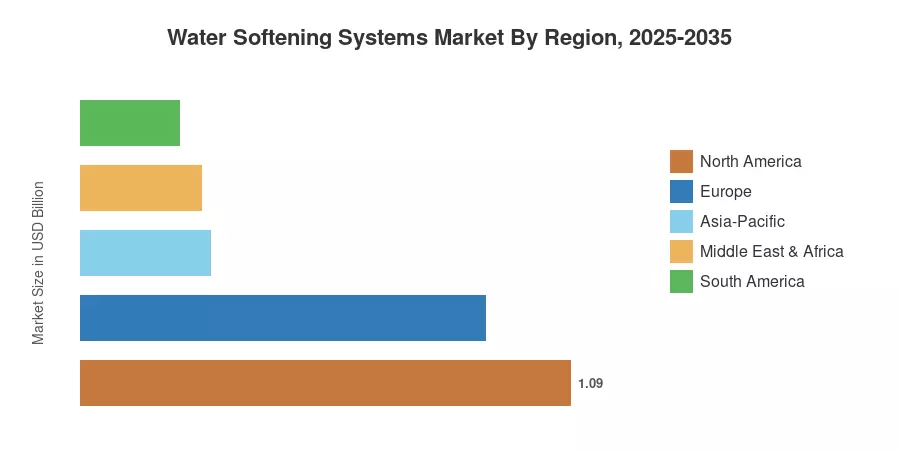
North America accounts for the greatest geographical share, generating about 34% of global sales, fueled by the presence of hard water in the U.S. Midwest and Southwest and significant demand for retrofits. Asia-Pacific is the fastest expanding market with a projected CAGR of 9.1 %, attributable to rising urbanization in India and China and government-funded clean water projects [4]. Europe maintains the second greatest proportion at over 28%, led by Germany, France and the UK. With increasing water scarcity challenges around the globe, the Water Softening Systems Market is set to grow at a rapid clip through the mid-2030s.

Key Report Takeaways

โ€ข By Technology

  • Ion exchange systems hold the dominant technology share within the Water Softening Systems Market at roughly 48% of 2025 revenue, reflecting decades of proven performance and an extensive aftermarket ecosystem.
  • Salt-free conditioning technologies are growing at the fastest CAGR of 9.8% through 2035, fueled by brine-discharge bans and consumer preference for low-maintenance solutions.
  • Reverse osmosis hybrid softening units generated an estimated USD 310 million in 2025, gaining traction in high-TDS industrial applications.

โ€ข By Application

  • Residential applications account for approximately 52% of the Water Softening Systems Market, driven by homeowner awareness campaigns and point-of-entry system retrofits.
  • Industrial water treatment is projected to grow at a CAGR of 8.3% as food & beverage, pharmaceutical, and power generation sectors prioritize boiler feedwater purity.

โ€ข By Region

  • North America generated roughly USD 1.09 billion in 2025 revenue from the Water Softening Systems Market.
  • Asia-Pacific's 9.1% CAGR leads all regions, with India's Jal Jeevan Mission creating infrastructure-scale demand.
  • Europe's share of approximately 28% reflects stringent EU water quality standards and high hard-water incidence in central Europe.

ย 

Water Softening Systems Market Size and Forecast (2021โ€“2035)

Market sizing combines bottom-up revenue tracking across 14 product categories with top-down cross-validation against national water utility capital expenditure data, trade association shipment reports (WQA, BSRIA), and company financial disclosures. Historical figures (2021โ€“2024) are actuals; the base year (2025) blends preliminary actuals with model estimates; forecast years (2026โ€“2035) apply segment-level CAGR models adjusted for regulatory and macroeconomic scenarios.
Water Softening Systems Market Size and Forecast
Our Impact
Enabled $4.3B Revenue Impact for Fortune 500 and Leading Multinationals
Partnering with 2000+ Global Organizations Each Year
30K+ Citations by Top-Tier Firms in the Industry

Driver Impact Analysis

Driver ~% Impact on CAGR Geographic Relevance Impact Timeline
Tightening drinking water regulations ~22% Global Long-term (โ‰ฅ4 yr)
Aging municipal water infrastructure ~18% North America, Europe Long-term (โ‰ฅ4 yr)
Rising hard-water awareness among consumers ~16% North America, Asia-Pacific Short-term (โ‰ค2 yr)
Industrial boiler & cooling feedwater standards ~14% Global Medium-term (2โ€“4 yr)
Smart-home and IoT integration ~12% North America, Europe Medium-term (2โ€“4 yr)
Urbanization and new residential construction ~10% Asia-Pacific, MEA Long-term (โ‰ฅ4 yr)
Brine discharge legislation is driving technology switching ~8% North America (CA), Europe Short-term (โ‰ค2 yr)

ย 

Tightening Drinking Water Regulations

The U.S. EPA's revised Lead and Copper Rule (LCRR), effective October 2024, mandates full lead service line replacement within 10 years โ€” a program estimated to mobilize USD 45 billion in water utility spending [1]. While the regulation primarily targets lead, utilities simultaneously upgrade point-of-entry treatment, including softening, to extend pipe longevity and reduce scale buildup. The EU Drinking Water Directive recast (2020/2184) imposes stricter limits on PFAS, microplastics, and endocrine disruptors, pushing commercial building owners to install multi-stage treatment trains that incorporate softening as a pretreatment step [3]. These regulatory mandates create a durable demand floor for the Water Softening Systems Market.

Aging Municipal Water Infrastructure

The American Society of Civil Engineers graded U.S. drinking water infrastructure a C- in its 2025 Report Card, identifying over 2.2 million miles of aging distribution pipe [10]. Hard water accelerates internal corrosion and scale accumulation, increasing maintenance costs by an estimated 15โ€“20% per mile [11]. As utilities pursue phased pipe rehabilitation, point-of-use and point-of-entry softening installations serve as interim mitigation, sustaining the Water Softening Systems Market during multi-year capital programs.

Rising Consumer Awareness and Smart-Home Adoption

A 2024 Water Quality Association survey found that 78% of U.S. homeowners in high-hardness zones consider water softening a priority home improvement [6]. Connected softeners โ€” units that monitor real-time water usage, predict regeneration timing, and alert owners via smartphone apps โ€” have grown from under 5% of residential unit sales in 2020 to roughly 18% in 2024 [9]. This digitalization trend raises average selling prices by 25โ€“35% per unit, supporting value growth in the Water Softening Systems Market beyond simple volume gains.

Industrial Feedwater Purity Requirements

Power plants, pharmaceutical manufacturers, and food processors face increasingly stringent boiler feedwater specifications. ASME guidelines recommend hardness levels below 0.3 ppm for high-pressure boilers, and non-compliance leads to costly tube failures averaging USD 500,000 per incident in large facilities [11]. Industrial buyers increasingly specify high-capacity softening systems with redundant configurations, contributing a premium revenue layer to the Water Softening Systems Market.

ย 

Restraints Impact Analysis

Restraint ~% Impact on CAGR Geographic Relevance Impact Timeline
Brine discharge and environmental concerns โ€“0.5% California, EU Short-term (โ‰ค2 yr)
High upfront cost for advanced systems โ€“0.4% Emerging markets Medium-term (2โ€“4 yr)
Consumer shift toward bottled/filtered alternatives โ€“0.3% Asia-Pacific Long-term (โ‰ฅ4 yr)
Maintenance complexity and salt replenishment burden โ€“0.2% Global Short-term (โ‰ค2 yr)
Competition from centralized municipal softening โ€“0.2% Europe Long-term (โ‰ฅ4 yr)

ย 

Brine Discharge Restrictions

Several California municipalities have banned self-regenerating water softeners to protect wastewater treatment facilities, and similar restrictions are under review in Arizona and Texas [3]. In Europe, the Netherlands and parts of Germany restrict residential softener brine discharge into municipal sewer networks. These bans don't eliminate demand โ€” they redirect it toward salt-free alternatives โ€” but the transition period creates temporary revenue gaps for conventional equipment distributors. The Water Softening Systems Market absorbs this headwind primarily through technology substitution rather than lost demand.

High Upfront Cost in Emerging Markets

While a standard residential softener in the U.S. retails for USD 800โ€“2,500, equivalent systems in India and Southeast Asia carry import duties of 12โ€“18%, pushing installed costs beyond the reach of middle-income households [12]. Until local manufacturing scales up, cost remains the single largest barrier to mass-market penetration in the fastest-growing Water Softening Systems Market regions.

Consumer Perception and Alternative Solutions

In several Asian markets, consumers associate water quality improvement with point-of-use RO purifiers rather than whole-house softeners. This perception gap means softener manufacturers must invest in education-led marketing โ€” a slower demand-building channel that delays market penetration compared to regions where softening is already embedded in household culture.

ย 

Water Softening Systems Market Opportunities

Subscription and Softener-as-a-Service Models

Recurring-revenue business models โ€” where providers install, maintain, and supply consumables for a monthly fee โ€” lower the consumer's upfront barrier and lock in multi-year relationships. Culligan's rent-to-own programs in North America already serve over 1 million households [15]. Expanding this model into Europe and Asia-Pacific represents a USD 400+ million incremental opportunity by 2030.

Salt-Free and Hybrid Technology Commercialization

Template-assisted crystallization (TAC) and electromagnetic conditioning technologies eliminate brine discharge, directly addressing the largest restraint facing the Water Softening Systems Market. As municipal brine-discharge bans expand, salt-free systems are projected to capture 20% of residential installations by 2030, up from roughly 11% in 2024 [8].

Smart Water Management Integration

IoT-enabled softeners that integrate with whole-home water management platforms โ€” combining leak detection, quality monitoring, and usage analytics โ€” can command price premiums of 30โ€“40% [9]. Partnerships between softener OEMs and smart-home ecosystem providers (Amazon, Google, Apple HomeKit) open cross-selling channels and increase consumer stickiness.

Emerging-Market Infrastructure Build-Out

India's Jal Jeevan Mission targets functional household tap connections for all 192 million rural households by 2026, with an allocated budget of INR 3.6 trillion (USD 43 billion) [4]. As groundwater in states like Rajasthan, Gujarat, and Haryana registers hardness levels exceeding 300 ppm, softening becomes a necessary complement to distribution infrastructure, creating a large addressable market for the Water Softening Systems Market.

Data Monetization from Connected Devices

Smart softener fleets generate granular water usage and quality data at the household level. Aggregated and anonymized, this data holds value for municipal planners, insurance underwriters, and real estate appraisers. Early-stage partnerships between water technology firms and data analytics platforms suggest a nascent but growing revenue stream by 2028โ€“2030 [9].

ย 

Water Softening Systems Market Future Outlook

AI-Driven Predictive Maintenance and Autonomous Regeneration

By 2028, leading OEMs are expected to embed machine learning algorithms into softener control units, enabling predictive regeneration scheduling based on real-time water quality sensors rather than simple volumetric metering [9]. The U.S. Department of Energy estimates that intelligent water appliances could reduce residential water waste by 15% and salt consumption by 25% compared to timer-based systems, creating both environmental and economic value [23].

Circular Economy and Brine Valorization

The brine waste problem is attracting R&D investment in salt recovery and mineral extraction. Startups in the Netherlands and Israel are piloting closed-loop brine recycling systems that recover sodium chloride for reuse, reducing softener operating costs by up to 40% [24]. If commercialized at scale by 2030, brine valorization could neutralize the single largest environmental objection to conventional softening and reshape the competitive landscape of the Water Softening Systems Market.

Electrification and Green Building Integration

As green building certification standards (LEED v5, BREEAM) incorporate water efficiency credits, architects are specifying whole-building water treatment โ€” including softening โ€” as a standard design element rather than an aftermarket add-on [25]. This shift from retrofit to spec-in changes the buyer journey and expands the addressable market for the Water Softening Systems Market into new-construction channels.

Decentralized Water Treatment and Microgrids

Rural and peri-urban communities in India, Sub-Saharan Africa, and Southeast Asia are adopting modular, containerized water treatment units that bundle softening, filtration, and disinfection into a single skid [4]. The World Bank estimates that decentralized water infrastructure investment in developing nations will exceed USD 30 billion annually by 2030, creating a scalable channel for compact softening technology [26].

ย 

Water Softening Systems Market Segmentation

By Technology

Segment Key Metric Primary Demand Driver
Ion Exchange 48% share (2025) Proven efficacy, lowest cost per grain removal
Salt-Free Conditioning CAGR 9.8% Brine-ban compliance, low maintenance
Reverse Osmosis Hybrid USD 0.31 B (2025) High-TDS industrial applications
Magnetic / Electronic CAGR 6.1% Compact form factor, zero consumables

ย 

Ion exchange remains the backbone of the Water Softening Systems Market, commanding nearly half of global revenue. These systems use sulfonated polystyrene resin beads to swap calcium and magnesium ions for sodium, delivering reliably soft water at scale from residential units processing 30,000 grains to industrial systems handling millions of gallons daily. The technology's maturity means competition centers on efficiency gains โ€” reduced salt-per-regeneration ratios, upflow brining, and counter-current configurations that squeeze more performance from each resin bed.

Salt-free conditioning represents the Water Softening Systems Market's fastest-growing technology segment. Template-assisted crystallization (TAC) converts dissolved hardness minerals into microscopic crystals that don't adhere to surfaces, achieving scale prevention without chemical inputs. Adoption is strongest in California, where over 25 municipalities have enacted brine-discharge bans, and in EU countries with strict wastewater limits [3][8].

By Application

Segment Key Metric Primary Demand Driver
Residential 52% share (2025) Consumer awareness, replacement cycles
Commercial USD 0.83 B (2025) Hospitality, healthcare facility compliance
Industrial CAGR 8.3% Boiler feedwater, process water purity

ย 

The residential segment anchors the Water Softening Systems Market through a combination of a large installed base and predictable replacement demand. Average system lifespan of 12โ€“15 years means roughly 7% of the installed base cycles through replacement annually in mature markets like the U.S. and Germany. Commercial applications โ€” particularly in hotels, hospitals, and laundry operations โ€” prioritize uptime and water consistency, favoring duplex configurations that allow continuous soft water supply during regeneration.

Industrial demand within the Water Softening Systems Market is growing fastest, as tighter boiler water standards and cooling tower blowdown regulations push manufacturers toward higher-capacity, redundant softening trains. The pharmaceutical and semiconductor sectors require ultrapure feedwater where even trace hardness causes yield losses [11].

ย 

Regional Market Share Analysis

Region Key Metric Primary Investment Themes
North America 34% share (2025) Residential retrofit, smart-home integration
Europe USD 0.90 B (2025) DWD compliance, commercial building upgrades
Asia-Pacific 9.1% CAGR (2026โ€“2035) Jal Jeevan Mission, urbanization
South America USD 0.22 B (2025) Municipal infrastructure modernization
Middle East & Africa 8.4% CAGR (2026โ€“2035) Desalination post-treatment, hospitality sector
Total USD 3.20 B (2025) โ€”

The Water Softening Systems Market's regional distribution reflects hard-water geology, regulatory maturity, and consumer awareness levels. North America leads on installed base, while Asia-Pacific is accelerating fastest on the back of government-funded clean water programs.

ย 

North America

Country Key Metric Key Driver
United States ~82% of regional revenue Hard-water belt spanning 85% of the territory [6]
Canada CAGR 6.8% Prairie province groundwater hardness [16]
Mexico USD 0.06 B (2025) Urban hotel and resort construction [17]

ย 

The United States dominates the North American Water Softening Systems Market because roughly 85% of the country's water supply qualifies as hard or very hard according to USGS mapping data [6]. The residential replacement cycle โ€” averaging 12โ€“15 years per unit โ€” drives a steady baseline, while smart-unit upgrades add a value-growth layer. Canada's prairie provinces face similar geological hardness, and Mexico's expanding tourism infrastructure is creating pockets of commercial demand along the Riviera Maya and Baja California corridors [17].

Europe

Country Key Metric Key Driver
Germany ~24% of regional share Limestone-rich aquifers, energy efficiency mandates [14]
France CAGR 7.5% Rising consumer awareness, retrofit programs
United Kingdom USD 0.14 B (2025) Southeast England hard-water zone [18]

ย 

The European Water Softening Systems Market benefits from the recast EU Drinking Water Directive, which has pushed member states to tighten secondary water quality parameters, including hardness-related scaling indicators [3]. Germany's market is the most mature, with an estimated installed base of 2.8 million residential units. France is growing fastest within the region as consumer awareness campaigns by water utility operators expand beyond traditional plumbing contractor channels.

Asia-Pacific

Country Key Metric Key Driver
China ~38% of regional share Industrial water treatment, urban housing boom [19]
India CAGR 10.5% Jal Jeevan Mission, high groundwater hardness [4]
Japan USD 0.09 B (2025) Premium residential and commercial segments [20]

ย 

Asia-Pacific represents the most dynamic growth corridor for the Water Softening Systems Market. India's groundwater, which supplies over 60% of irrigation and 85% of drinking water, registers hardness above 200 ppm across large swaths of Rajasthan, Gujarat, and Haryana [4]. China's industrial water treatment demand โ€” particularly in the power, petrochemical, and semiconductor fabrication sectors โ€” anchors the region's volume, while Japan and South Korea contribute premium-segment value.

South America

Country Key Metric Key Driver
Brazil ~58% of regional revenue Sรฃo Paulo industrial corridor demand [21]
Argentina CAGR 7.9% Pampas groundwater hardness
Rest of South America USD 0.04 B (2025) Mining sector water treatment

ย 

Brazil's industrial base in the Sรฃo Pauloโ€“Campinas corridor drives the majority of South American demand within the Water Softening Systems Market. Mining operations in Chile and Peru are emerging as secondary buyers, using softening as pretreatment ahead of RO systems to extend membrane life.

Middle East & Africa

Country Key Metric Key Driver
Saudi Arabia ~32% of regional share NEOM and Vision 2030 hospitality construction [22]
UAE CAGR 9.0% Desalination post-treatment demand
South Africa USD 0.03 B (2025) Mining and industrial water recycling

ย 

Desalination provides over 60% of potable water in the GCC states, and desalinated water โ€” while low in biological contaminants โ€” often requires post-treatment conditioning to meet building plumbing standards [22]. The Water Softening Systems Market in the Middle East is closely tied to mega-project construction timelines, particularly in Saudi Arabia's NEOM development and the UAE's continued hospitality expansion.

ย 

Water Softening Systems Market By Region, 2025-2035

Competitive Benchmarking

The Water Softening Systems Market is moderately fragmented, with an estimated Herfindahlโ€“Hirschman Index (HHI) below 800 and the top five players commanding roughly 35โ€“40% of global revenue. Competition varies by tier: multinational water technology firms compete on brand, service networks, and smart-home integration, while regional manufacturers compete on price and local distribution.

Company Est. Revenue Share Range Key Offerings Strategic Positioning
Culligan International ~8โ€“11% Whole-home systems, rent-to-own programs Service network leader, subscription model pioneer
Pentair plc ~7โ€“9% Residential & commercial softeners, filtration Broad portfolio across the water treatment value chain
A.O. Smith Corporation ~5โ€“7% Residential softeners, RO systems Strong brand in North America and India
EcoWater Systems ~5โ€“7% Connected softeners, dealer network Berkshire Hathaway-backed, Wi-Fi-enabled units
BWT AG ~4โ€“6% Residential & commercial units European market leader, sustainability focus
Kinetico Incorporated ~3โ€“5% Non-electric, kinetic-powered systems Differentiated technology, premium positioning
Whirlpool Corporation ~3โ€“5% Residential softeners, big-box retail Mass-market reach through Home Depot, Lowe's
Harvey Water Softeners ~2โ€“4% Block salt systems UK market specialist
Watts Water Technologies ~2โ€“3% Commercial and industrial systems OEM and specification channel strength
3M Water Purification ~2โ€“3% Commercial filtration and softening Foodservice and healthcare verticals

ย 

ย 

Recent News & Developments

A. O. Smith Corporation(November, 2024)โ€”Completed the acquisition of Pureit, a residential water purification business, to expand its product portfolio and distribution in South Asia.

Culligan International(January, 2026)โ€”Partnered with the Schneider Electric Marathon de Paris as the official water solutions supplier to provide sustainable, filtered water and reduce plastic waste.

Pentair plc(February 3, 2026) reported strong 2025 financial results, highlighting continued investment in growth initiatives across its balanced water solutions portfolio and marking its 50th year of dividend increases.

Water Softening Systems Market Report Scope

Parameter Detail
Market Scope Global Water Softening Systems Market โ€” hardware, consumables, and related services
Study Period 2021โ€“2035
Historical Period 2021โ€“2024
Base Year 2025
Forecast Period 2026โ€“2035
CAGR (2026โ€“2035) 7.2%
Market Size (2025) USD 3.20 Billion
Market Size (2035) USD 6.41 Billion
Fastest Growing Region Asia-Pacific (9.1% CAGR)
Fastest Growing Segment Salt-Free Conditioning (9.8% CAGR)
Companies Profiled Culligan, Pentair, A.O. Smith, EcoWater, BWT, Kinetico, Whirlpool, Harvey, Watts, 3M
Valuation Currency USD (constant 2025 dollars)

ย 

ย 

FAQs

How do whole-home softeners affect septic system performance?
Brine discharge adds sodium to septic drain fields. However, peer-reviewed studies by the Water Quality Research Foundation confirm that modern, efficient softeners produce brine volumes well within safe limits for properly sized septic systems [2]. Homeowners should verify local codes before installation.
What certifications should buyers prioritize when selecting a commercial softener?
Look for NSF/ANSI 44 certification, which validates contaminant reduction claims and structural integrity under pressure [2]. For food-contact applications, NSF/ANSI 61 adds material safety assurance relevant to health inspectors.
How does water hardness vary by source โ€” groundwater versus surface water?
Groundwater typically exhibits 2โ€“5ร— higher hardness than surface sources because prolonged contact with limestone and dolomite dissolves calcium and magnesium carbonates [27]. Surface-fed municipalities rarely exceed 120 ppm, while well water often surpasses 300 ppm.
What is the typical payback period for a residential softener investment?
Most homeowners recover the USD 800โ€“2,500 installed cost within 3โ€“5 years through reduced detergent use, lower water heater energy bills, and extended appliance lifespan [6]. Hard water scale can increase water heating costs by 25โ€“30%.
Can softened water be used safely for irrigation and gardening?
Sodium-softened water can harm salt-sensitive plants over time, so most installers recommend a bypass line for outdoor hose bibs [2]. Salt-free conditioners avoid this issue entirely since they do not add sodium to the water supply.
How do duplex and alternating-tank systems differ from single-tank units?
Duplex systems use two resin tanks so one regenerates while the other serves water, guaranteeing an uninterrupted supply โ€” critical for hospitals and hotels [11]. Single-tank units regenerate off-peak, creating brief service gaps acceptable in most residential settings.
What role do water softeners play in extending the life of tankless water heaters?
Scale buildup from hard water is the leading cause of heat exchanger failure in tankless units, reducing efficiency by up to 30% within five years [23]. Pre-treating incoming water with a softener preserves heater performance and can double the unit's effective service life. ย  ย 
Author
Author
Author Profile
Varsha More LinkedIn
Senior Research Analyst
Experienced business professional with a demonstrated history of working in the CFnB industry. Skilled in market research, and market estimation. Strong professional with a Masters focused in marketing management.

Research Approach

ย 

Secondary Research

The secondary research process involved comprehensive analysis of regulatory frameworks, water quality databases, technical standards publications, and authoritative environmental health organizations. Key sources included the US Environmental Protection Agency (EPA) Safe Drinking Water Act databases, US Geological Survey (USGS) Water Hardness Mapping, European Environment Agency (EEA) Water Information System for Europe (WISE), EU Drinking Water Directive (EU) 2020/2184 compliance databases, World Health Organization (WHO) Guidelines for Drinking-water Quality, NSF International/ANSI Standards 44 (Cation Exchange Water Softeners), Water Quality Association (WQA) Market Reports, International Association of Plumbing and Mechanical Officials (IAPMO) Uniform Plumbing Code databases, American Water Works Association (AWWA) water quality surveys, National Resources Defense Council (NRDC) water quality studies, UN-Water Global Analysis and Assessment of Sanitation and Drinking-Water (GLAAS), OECD Environment Statistics, national census bureaus (US Census Bureau, Eurostat, National Bureau of Statistics of China), and building construction permit databases from key metropolitan statistical areas. These sources were utilized to collect water hardness incidence data, regulatory compliance standards, installation base statistics, replacement cycle analysis, and construction industry trends affecting residential, commercial, and industrial adoption of salt-based ion exchange and salt-free conditioning technologies.

ย 

Primary Research

To gather qualitative and quantitative information on system characteristics, purchase criteria, and replacement dynamics, supply-side and demand-side stakeholders were interviewed as part of the primary research process. VPs of Product Development, heads of Commercial Engineering, regional sales directors, and channel strategy managers from private-label distributors, component manufacturers (such as producers of control valves and resin), and water softening system OEMs were examples of supply-side sources. Facilities managers from the hospitality and healthcare industries, procurement managers from food and beverage processing facilities, commercial real estate developers, home improvement stores, residential plumbers, and industrial water treatment consultants were among the demand-side sources. Primary research confirmed channel shift dynamics between offline plumbing wholesalers and direct-to-consumer online platforms, validated flow rate requirement segmentation (05-30 GPM vs. industrial >90 GPM), and collected information on the barriers to the adoption of salt-based versus salt-free Template Assisted Crystallization (TAC) and the preferences for salt-based regeneration frequency.

Primary Respondent Breakdown:

By Designation: C-level Primaries (28%), Director Level (35%), Others (37%)

By Region: North America (32%), Europe (30%), Asia-Pacific (28%), Rest of World (10%)

ย 

Market Size Estimation

Global market valuation was derived through installed base analysis and replacement cycle modeling across residential housing units, commercial buildings, and industrial facilities. The methodology included:

Identification of 55+ key manufacturers across North America, Europe, Asia-Pacific, and Latin America specializing in ion exchange softeners, reverse osmosis pretreatment systems, and salt-free conditioners

Product mapping across salt-based (cation exchange resin) and salt-free (electromagnetic/TAC) technologies segmented by flow capacity (05-30 GPM residential vs. 90+ GPM industrial)

Analysis of reported revenues and estimated sell-through data from point-of-entry (POE) water treatment portfolios, cross-referenced with salt consumption volumes and resin replacement aftermarket patterns

Coverage of manufacturers representing 75-80% of global market share in 2024, including in-depth analysis of Culligan dealer networks, EcoWater distributor channels, and BWT/BWT Pharma+Biotech industrial divisions

Extrapolation using bottom-up (household penetration rates by water hardness zones ร— average selling price by region) and top-down (manufacturer revenue validation against plumbing fixture shipment correlations) approaches to derive segment-specific valuations for residential (single-family vs. multi-family), commercial (hospitality, healthcare, education), and industrial (boiler feed, cooling towers, food processing) verticals

Key Modifications Made:

Company Tiers: Adjusted to reflect the fragmented nature of the water treatment industry with Tier 2 (mid-market specialists like BWT, Watts) receiving higher representation (40%) versus Tier 1 (conglomerates like Pentair, A.O. Smith) at 38%

Designation Mix: Shifted toward Director-level (35%) to capture operational insights from Plant Managers and Regional Sales Directors who directly oversee water treatment specifications, rather than purely C-suite strategic views

Regional Distribution: Increased European representation (30%) to account for the concentration of established players (BWT Austria, UK softener manufacturers) and strict EU water quality directives, while slightly reducing North America (32%) and Asia-Pacific (28%) to reflect market maturity dynamics

Revenue Thresholds: Adjusted tier definitions downward (USD 5B vs. USD 10B) to better fit the water treatment industry structure where even major players like Culligan or EcoWater operate below traditional Tier 1 thresholds

Download Free Sample

Kindly complete the form below to receive a free sample of this Report

Download PDF ×

We do not share your information with anyone. However, we may send you emails based on your report interest from time to time. You may contact us at any time to opt-out.