White Biotechnology Market (2026 - 2035)

White Biotechnology Market Research Report: Size, Share, Trend Analysis By Applications (Biofuels, Bioplastics, Biopharmaceuticals, Food Ingredients, Agricultural Biotechnology), By Technology (Enzymatic Processes, Fermentation, Biocatalysis, Synthetic Biology, Genetic Engineering), By End Use (Food and Beverage, Healthcare, Agriculture, Chemical Industry, Energy Sector), By Source (Microorganisms, Plant Extracts, Animal Sources, Fungi, Algae) and By Regional (North America, Europe, South America, Asia Pacific, Middle East and Africa) - Growth Outlook & Industry Forecast 2025 To 2035

Forecast Period
2026-2035
CAGR
6.64%
2025 Market Size
USD 385.2 Billion
2035 Market Size
USD 732.7 Billion
Healthcare ● Updated August 24, 2026 Report ID: MRFR/HC/20290-HCR | Pages: 200 | Author: Nidhi Mandole, Rahul Gotadki

White Biotechnology Market Summary

The White Biotechnology Market closed 2025 at USD 385.2 billion and is projected to grow to USD 732.7 billion by 2035, expanding at a compound annual growth rate (CAGR) of 6.64% between 2026 and 2035. Market value is expected to reach USD 410.8 billion in 2026 as the first year of the forecast period. This growth is being driven primarily by binding renewable fuel mandates in the European Union and production tax credits in the United States, alongside a broader technology shift from traditional petrochemical processes toward continuous fermentation and engineered biocatalysts.

The EU Renewable Energy Directive III obliges member states to lift renewable content in transport fuel to 29% by 2030. This binding mandate is directly driving demand for bio-based fuel alternatives across the European Union. In the United States, the 45Z Clean Fuel Production Credit prices low-carbon-intensity output on a sliding scale worth up to USD 1.75 per gallon for aviation fuel, converting climate policy directly into producer revenue rather than remaining a regulatory aspiration.

Producers are also retiring naphtha crackers and single-pass sugar mills in favor of continuous fermentation trains paired with engineered biocatalysts. Machine-guided strain design has cut typical development cycles from roughly 36 months to under 18, and enzyme dosage per tonne of product has fallen sharply across detergent and textile applications. IEA Bioenergy estimates global biorefinery capital commitments exceeded USD 34 billion in 2024 alone, much of it flowing into brownfield conversions where existing utilities and logistics reduce payback risk for new projects.

By region, North America holds the largest share of the White Biotechnology Market, at 29.4% of 2025 value, supported by corn-ethanol infrastructure and 45Z tax credit eligibility. Asia-Pacific is the fastest-growing region, with a projected CAGR of 8.6% through 2035, propelled by India's E20 ethanol blending programme and China's bio-manufacturing targets under its fourteenth and fifteenth Five-Year Plans. Europe holds the second-largest position, where carbon border pricing and mandatory sustainability disclosure keep bio-content procurement resilient even during softer macroeconomic conditions. Overall, the White Biotechnology Market is shifting from pilot-stage economics toward established balance-sheet infrastructure.


Key Report Takeaways

• By Type

  • Biofuels commanded 37.3% of White Biotechnology Market revenue in 2025, underpinned by blending mandates across three continents
  • Biomaterials post the fastest expansion at a 7.8% CAGR through 2035 as packaging brands convert Scope 3 pledges into purchase orders
  • Biochemicals generated USD 94.8 billion in 2025 across solvents, acids and platform intermediates

• By Application

  • Bioenergy held 39.4% of application revenue in 2025
  • Food and beverages advanced at an 8.8% CAGR, the quickest of any application
  • Pharmaceuticals contributed USD 81.7 billion in 2025 through biocatalytic API routes

• By Region

  • North America retained 29.4% of global value in 2025
  • Asia-Pacific records an 8.6% CAGR over 2026–2035, the fastest regional rate in the White Biotechnology Market
  • Europe delivered USD 107.1 billion in 2025


Market Size and Forecast (2021–2035)

Estimates blend audited producer disclosures, customs-level trade flows for ethanol and bio-polymers, plant-by-plant nameplate capacity tracking, and utilisation assumptions validated against regulatory registries. Historical years reflect reconciled shipment data; forecast years apply capacity commissioning schedules discounted for slippage. The following series presents the White Biotechnology Market on a consistent value basis.
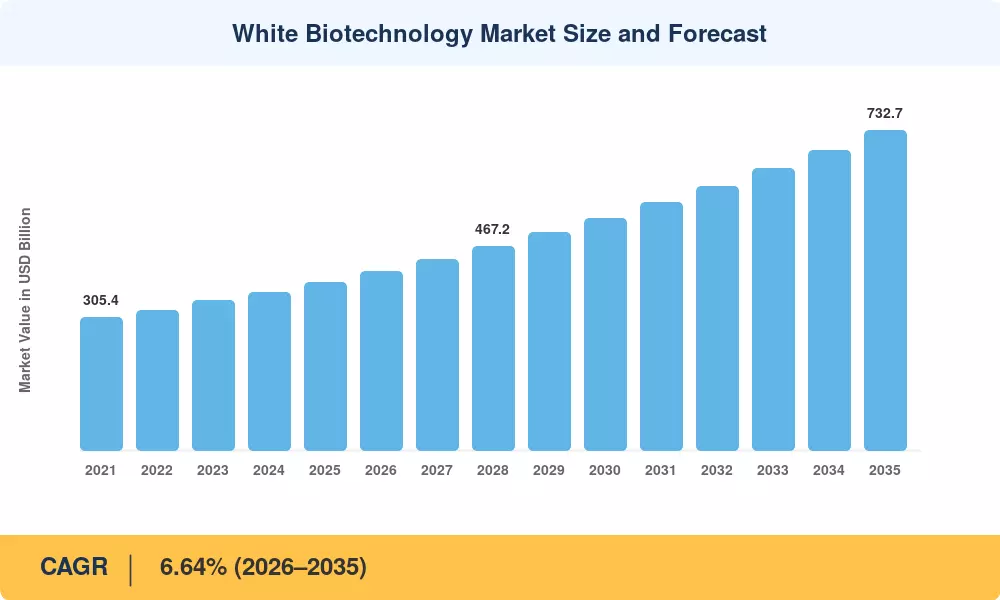
White Biotechnology Market Size and Forecast
Our Impact
Enabled $4.3B Revenue Impact for Fortune 500 and Leading Multinationals
Partnering with 2000+ Global Organizations Each Year
30K+ Citations by Top-Tier Firms in the Industry

Driver Impact Analysis

Driver ~% Impact on CAGR Geographic Relevance Impact Timeline
Aviation fuel blending mandates and carbon pricing 1.4 Europe, North America Medium-term (2–4 yr)
Brand-led bio-content procurement commitments 1.1 Global Medium-term (2–4 yr)
Synthetic biology cost curve decline 0.9 Global Long-term (≥4 yr)
Ethanol blending expansion in Asia-Pacific 0.8 Asia-Pacific Short-term (≤2 yr)
Enzyme substitution in detergents and textiles 0.6 Global Short-term (≤2 yr)
Residue and by-product valorisation economics 0.5 South America, North America Long-term (≥4 yr)
Scope 3 disclosure obligations 0.7 Europe, Asia-Pacific Medium-term (2–4 yr)


Aviation Fuel Mandates Convert Policy into Contracted Volume

The ReFuelEU Aviation initiative sets the targets of 2% sustainable aviation fuel at EU airports in 2025, 6% in 2030 and 70% in 2050 [7]. Airlines cannot hedge that obligation with offsets, so they sign decade-long physical offtakes instead. This type of contracting de-risks project finance for the White Biotechnology Market, enabling developers to complete debt at gearing levels previously only available for regulated utilities. The knock-on effect is even further upstream, as aggregators of lipid and cellulosic feedstocks are now locking in multi-year supply agreements at 12-18% premiums to commodity reference prices.


Consumer Brands Pull Bio-Content Through the Chain

Approximately 260 consumer goods businesses have committed to validated science-based targets for purchased goods and services [12]. To meet these challenges, fossil-based surfactants, solvents, and polymers need to be replaced. Unilever alone pledged EUR 1 billion to its Clean Future program to remove fossil carbon from cleaning products [8]. These purchasers are paying for proven carbon intensity, not for chemical uniqueness, so they reward incremental substitution – a considerably easier business ask than substituting an entire product category.


Strain Engineering Economics

Machine-learning guided design-build-test-learn cycles have reduced the cost of achieving commercial titre thresholds. Ginkgo Bioworks showed foundry throughput expansion with a sharp drop in cost per modified strain [13], and academic benchmarking indicated yield gains of 20–40% on existing fermentation pathways in two development cycles [3]. Improved unit economics increase the range of compounds for which bio-based chemical manufacturing is cheaper than petrochemical approaches, even without subsidies.


Asia-Pacific Blending Programmes

India reached 20% ethanol blending in fuel in 2025, five years ahead of the initial schedule, with the help of interest subvention for distillery development [9]. Indonesia upgraded its palm-based biodiesel mandate to B40. These programs offer guaranteed local demand to underpin greenfield fermentation capacity and explain why the region’s growth rate is over two percentage points higher than any other region.


Restraints Impact Analysis

Restraint ~% Impact on CAGR Geographic Relevance Impact Timeline
Agricultural feedstock price volatility -1.2 Global Short-term (≤2 yr)
Capital intensity and long construction cycles -0.9 Global Long-term (≥4 yr)
Low fossil feedstock prices in petro-regions -0.8 North America, Middle East Medium-term (2–4 yr)
Fragmented sustainability certification regimes -0.5 Europe, Asia-Pacific Medium-term (2–4 yr)
Scale-up attrition from pilot to commercial titre -0.6 Global Long-term (≥4 yr)


Feedstock Volatility Erodes Margin Predictability

Sugar, corn and vegetable oil inputs comprise 45–65% of cash cost across most fermentation platforms. The FAO’s food price index has fluctuated over 20 points throughout 2022-2024 [11]. And few producers have hedges beyond 12 months, as liquid forward curves simply do not exist for cellulosic residues or spent frying oil. The outcome is a quarterly earnings dispersion that prevents generalist stock investors from funding the expansion of the White Biotechnology market.


Capital Intensity and Build Cycles

A 100,000-tonne integrated biorefinery costs roughly USD 500–900 million and takes 42–60 months from the final investment decision to steady-state operation [4]. Interest costs are incurred during that period without any offsetting revenue. Several stated projects between 2023 and 2025 have pushed back their commissioning dates by two years or more. Lenders now commonly seek completion guarantees from sponsors with investment-grade balance sheets, which excludes most independent developers.


Certification Fragmentation

Buyers must reconcile ISCC EU, RSB, RED III national transpositions and CORSIA eligibility criteria, each with distinct chain-of-custody and land-use rules [14]. Duplicate audits add USD 80,000–150,000 per site annually and, more damagingly, create the risk that a certified volume qualifies in one jurisdiction but not another. That mismatch fragments what should be a globally fungible commodity pool.


White Biotechnology Market Opportunities

Brownfield Conversion of Idle Petrochemical Assets

Europe is expected to retire several million tonnes of steam-cracker capacity this decade. Converting the utilities, tankage and port access at those sites cuts greenfield capex by 30–40% and shortens permitting timelines materially. Developers who secure sites before demolition capture the cheapest incremental capacity available anywhere in the White Biotechnology Market.

Precision Fermentation in Food Protein

Regulatory clearances for fermentation-derived dairy and egg proteins accelerated across the US, Singapore, and Israel between 2023 and 2025 [16]. Food applications carry gross margins two to three times those of fuel-grade output, which explains the 8.8% application CAGR. Producers with idle biopharmaceutical suites can enter with modest retrofit spend.

Emerging-Market Residue Valorisation

Brazil, Thailand and Indonesia generate enormous volumes of bagasse, rice husk and palm residue that currently earn negligible value. Localised second-generation plants convert that liability into feedstock at delivered costs well below imported sugar. The World Bank has flagged residue-based bioeconomy investment as a rural employment lever in tropical agricultural economies [17].

Data and Strain Licensing Business Models

Rather than selling molecules, several platform companies now license engineered strains and process packages against milestone and royalty structures. This asset-light approach converts R&D into recurring revenue and lets incumbents access frontier biology without building foundries. Expect licensing to become a distinct revenue line within the White Biotechnology Market by 2030.

Carbon-Intensity Premiums as a Tradable Attribute

As environmental registries mature, verified low carbon-intensity (CI) scores command premium pricing on Environmental Attribute Certificates (EACs). Producers achieving sub-20g CO2c/MJ scores can trade these verified attributes to off-takers needing deep emissions reductions, maximizing monetization while complying with strict regulatory safeguards against double-counting across compliance markets.


White Biotechnology Market Future Outlook

Autonomous Bioprocess Control

Continuous monitoring paired with model-predictive control is replacing operator-set fermentation recipes. Early deployments report batch-to-batch variance reductions above 30% and measurable yield gains without capital additions [15]. Over the decade, autonomous control becomes the cheapest debottlenecking lever available to the White Biotechnology Market, extracting incremental tonnes from installed assets before any new steel is ordered.

Platform Economics and Multi-Product Plants

Single-product biorefineries struggle when one output cycles down. Operators are designing shared upstream trains with switchable downstream purification, letting a site pivot between organic acid, protein and fuel intermediate output as spreads move. That flexibility raises capex modestly but transforms return volatility.

Feedstock Diversification Beyond First-Generation Sugars

IEA projects sustainable biofuel supply must roughly triple by 2030 to align with net-zero pathways, a volume unreachable on food-crop feedstock alone [5]. Municipal organic waste, agricultural residue and gaseous carbon feedstocks will supply the marginal tonne. Gas fermentation in particular has moved from demonstration to commercial operation at steel-mill sites in China.

Verified Sustainability Reporting Becomes Procurement Infrastructure

The Corporate Sustainability Reporting Directive brings tens of thousands of companies into mandatory value-chain disclosure [12]. Once emissions data becomes audited rather than voluntary, purchasing managers face internal accountability for fossil-carbon intensity. That single shift converts sustainability from a marketing budget line into a procurement specification, and it is the most durable structural support for the White Biotechnology Market over the next decade.


White Biotechnology Market Segmentation

Segment behaviour within the White Biotechnology Market splits between volume-driven fuel categories and margin-driven specialty categories, and investors should not evaluate them on the same return criteria.

By Type

Segment Metric Primary Demand Driver
Biofuels 37.3% share (2025) Blending mandates and aviation obligations
Biomaterials 7.8% CAGR (2026–2035) Packaging and textile substitution
Biochemicals USD 94.8 Billion (2025) Solvent and intermediate replacement
Industrial Enzymes 15.8% share (2025) Detergent, feed and textile processing


Biofuels anchor volume in the White Biotechnology Market because mandates create demand independent of price competitiveness. Biomaterials grow faster from a smaller base: polylactic acid and polyhydroxyalkanoate capacity announcements have clustered around Asian and European converter hubs, and brand offtakes now routinely cover 60–70% of nameplate before commissioning. Industrial enzymes remain the quiet margin engine, where enzyme-based bioprocessing displaces harsh chemistry and cuts customer energy bills simultaneously.

By Application

Segment Metric Primary Demand Driver
Bioenergy 39.4% share (2025) Transport decarbonisation policy
Pharmaceuticals USD 81.7 Billion (2025) Biocatalytic API synthesis routes
Food and Beverages 8.8% CAGR (2026–2035) Precision fermentation ingredients
Animal Feed 9.4% share (2025) Phytase and protein efficiency
Other Applications 5.1% CAGR (2026–2035) Textiles, pulp and water treatment


Bioenergy dominates today, yet its share erodes gradually as higher-value categories scale. Food and beverages post the sharpest gradient in the White Biotechnology Market, driven by regulatory clearances for fermentation-derived proteins and by ingredient makers seeking supply chains insulated from agricultural weather risk. Pharmaceutical biocatalysis deserves separate attention: enzymatic routes have eliminated multiple protection steps in complex syntheses, cutting solvent consumption by more than half in documented commercial processes [10].


Regional Market Share Analysis

Region Metric (2025 unless noted) Primary Investment Themes
North America 29.4% share 45Z credits, corn-ethanol retrofit, SAF hubs
Europe USD 107.1 Billion RED III compliance, chemical recycling adjacency
Asia-Pacific 8.6% CAGR (2026–2035) Blending mandates, greenfield fermentation
South America 7.4% share Sugarcane integration, residue conversion
Middle East & Africa USD 18.5 Billion Diversification funds, feed and food security
Total USD 385.2 Billion

Regional performance in the White Biotechnology Market diverges sharply along policy lines rather than resource endowment, with mandate certainty proving a better predictor of capacity growth than feedstock availability.


North America

Country Metric Key Driver
US 72.8% of region 45Z clean fuel credit stacking
Canada USD 17.4 Billion Clean Fuel Regulations compliance
Mexico 7.1% CAGR Industrial enzyme import substitution


The US Department of Energy has committed more than USD 3 billion through its Bioenergy Technologies Office and loan programmes to first-of-a-kind conversion facilities [18]. Existing corn-ethanol infrastructure gives American producers a structural advantage: carbon capture retrofits on fermentation vents are among the cheapest abatement options available, dropping carbon intensity scores enough to unlock premium credit tiers. Canada's parallel regime creates a genuinely continental compliance pool.

Europe

Country Metric Key Driver
Germany 24.6% of region Chemical industry decarbonisation
UK USD 15.3 Billion SAF mandate and revenue certainty mechanism
France 6.2% CAGR Agricultural cooperative integration
Italy 9.1% of region HVO and biorefinery conversion
Spain USD 8.2 Billion Waste-oil collection networks
Nordic Countries 6.9% CAGR Forestry residue platforms
Russia 6.4% of region Domestic enzyme production
Rest of Europe 12.5% of region Central European ethanol capacity


Europe's Carbon Border Adjustment Mechanism began definitive reporting in 2026, raising the landed cost of imported fossil-derived intermediates and improving relative economics for domestic bio-routes [19]. German chemical majors have responded with mass-balance certified product lines that let downstream customers claim bio-content without dedicated supply chains — a pragmatic bridge while dedicated capacity is built.

Asia-Pacific

Country Metric Key Driver
China 41.2% of region Five-Year Plan bio-manufacturing targets
India 10.4% CAGR E20 achievement and distillery expansion
Japan USD 15.7 Billion Enzyme and specialty biochemical exports
South Korea 7.6% of region Bio-polymer and battery-adjacent materials
ASEAN 9.1% CAGR Palm and cassava feedstock integration
Rest of Asia-Pacific 9.8% of region Feed enzyme adoption


China designated bio-manufacturing a strategic emerging industry, directing provincial funds toward amino acid, organic acid, and enzyme capacity [20]. Scale is the differentiator here — Chinese citric and lactic acid producers already set global reference prices. Within the White Biotechnology Market, Asia-Pacific's advantage lies in commissioning speed: plants that take four years to build in Europe reach mechanical completion in under thirty months across coastal industrial parks.

South America

Country Metric Key Driver
Brazil 64.3% of region RenovaBio decarbonisation credits
Argentina USD 5.1 Billion Soy-based biodiesel export capacity
Rest of South America 6.3% CAGR Colombian and Peruvian blending policy


Brazil's RenovaBio programme issues tradable CBIO certificates tied to verified lifecycle emissions, and the market cleared well over 30 million certificates in recent compliance cycles [21]. Sugarcane mills operating flexible sugar-ethanol配 configurations can pivot output within a crushing season, giving Brazilian producers a hedging capability few global peers possess.

Middle East & Africa

Country Metric Key Driver
Saudi Arabia 27.4% of region Vision 2030 industrial diversification
UAE 9.6% CAGR SAF partnerships around aviation hubs
South Africa USD 3.6 Billion Sugar sector repurposing
Egypt 12.8% of region Feed enzyme and food ingredient demand
Rest of MEA 21.1% of region Development finance pilots


Gulf sovereign funds treat bio-manufacturing as a hedge against terminal oil demand rather than a near-term profit centre, which permits longer payback tolerance than commercial developers can accept. Aviation hub operators in the UAE have signed procurement frameworks tied to CORSIA compliance, seeding regional demand ahead of local supply.


White Biotechnology Market By Region, 2025-2035

Competitive Benchmarking

Concentration in the White Biotechnology Market sits in the moderate band, with an estimated HHI near 780 and a top-five combined share around 34–38%. The structure is barbelled: a handful of integrated majors control enzyme and fermentation platform technology, while a long tail of regional ethanol and organic acid producers competes on feedstock proximity rather than differentiation.

Company Est. Revenue Share Range Key Offerings for White Biotechnology Market Strategic Positioning
Novonesis ~9–12% Industrial enzymes, microbial cultures, biosolutions Technology leader with broadest enzyme portfolio
BASF SE ~7–10% Bio-based intermediates, enzymes, mass-balance products Integrated chemistry with certified bio-content lines
Cargill Incorporated ~6–9% Fermentation-derived acids, polyols, feed ingredients Feedstock-integrated global footprint
Archer Daniels Midland ~5–8% Ethanol, bio-solvents, nutrition ingredients Upstream origination advantage
dsm-firmenich ~4–7% Feed enzymes, nutritional actives, bio-actives Premium specialty and health positioning
IFF (Danisco Division) ~4–6% Cultures, enzymes, biomaterials Formulation-led customer intimacy
POET LLC ~3–5% Bioethanol, distillers grains, bio-oils Largest dedicated ethanol platform
Corbion N.V. ~2–4% Lactic acid, PLA precursors, preservation Focused biochemical specialist
Evonik Industries ~2–4% Bio-based amino acids, biosurfactants Specialty chemistry with fermentation depth
Braskem S.A. ~2–3% Bio-polyethylene, green ethylene Only large-scale sugarcane polymer producer
Codexis Inc. ~1–2% Engineered enzymes, biocatalysis licensing Asset-light protein engineering licensor


Recent News & Developments

  • Novonesis (January 2024): Completed integration of Chr. Hansen operations, consolidating enzyme and culture portfolios under one platform and creating the sector's largest biosolutions supplier [3].


  • European Commission (July 2024): Adopted implementing rules for recycled carbon and renewable fuels of non-biological origin under RED III, resolving a two-year certification ambiguity [1].
  • dsm-firmenich (May 2024): Launched a feed enzyme portfolio targeting methane reduction in ruminants, tied to emerging livestock emissions accounting frameworks [23].
  • Government of India (June 2024): Extended interest subvention for grain-based distilleries, adding capacity ahead of the E20 milestone reached in 2025 [9].
  • Cargill (November 2023): Announced a joint venture to scale fermentation-derived specialty ingredients in Asia, targeting food and personal care customers [24].


White Biotechnology Market Report Scope

Parameter Detail
Market Scope Global White Biotechnology Market across biofuels, biomaterials, biochemicals and industrial enzymes
Study Period 2021–2035 (Historical 2021–2024; Base Year 2025; Forecast 2026–2035)
CAGR 6.64% (2026–2035)
Market Size Checkpoints USD 385.2 Billion (2025); USD 410.8 Billion (2026); USD 732.7 Billion (2035)
Fastest Growing Segments Biomaterials (Type); Food and Beverages (Application); Asia-Pacific (Region)
Companies Profiled 11 major players including Novonesis, BASF, Cargill, ADM, dsm-firmenich, IFF, POET, Corbion, Evonik, Braskem, Codexis
Valuation Currency USD Billion

FAQs

How should procurement teams structure offtake contracts in the White Biotechnology Market?
Index pricing to feedstock benchmarks rather than fixed rates, and separate the carbon-intensity attribute from the physical volume. Include commissioning-delay remedies, since first-of-a-kind plants routinely slip six to eighteen months [4].
What financing instruments do lenders require for first-of-a-kind biorefineries?
Completion guarantees from investment-grade sponsors, technology performance insurance covering titre and yield shortfalls, and a debt service reserve of at least twelve months. Without all three, project debt rarely clears credit committee [4].
Which certification schemes matter most for buyers entering the White Biotechnology Market?
ISCC EU dominates European compliance volumes, RSB carries broader credibility for aviation, and CORSIA eligibility governs international flight claims. Dual certification costs more but preserves optionality across jurisdictions [14].
How does precision fermentation differ commercially from conventional biocatalysis?
Precision fermentation produces the target molecule inside the organism, requiring downstream purification suites resembling biopharmaceutical facilities. Biocatalysis uses isolated enzymes in conventional reactors, making it far cheaper to retrofit into existing chemical plants [15].
What integration challenges arise when retrofitting petrochemical sites for the White Biotechnology Market?
Sterility requirements, aqueous waste volumes, and materially different corrosion profiles drive most cost overruns. Existing tankage and utilities transfer well; reactors and separation trains generally do not [4].
Is toll manufacturing a viable entry route for smaller developers?
Yes, for volumes under roughly 20,000 tonnes annually. Contract fermentation capacity is available across Europe and Asia at rates that beat owning assets until utilisation exceeds about 70% [24].
How do intellectual property strategies differ between strain developers and process licensors?
Strain developers rely on trade secrecy because published sequences invite design-around work. Process licensors patent unit operations and control parameters, which are harder to conceal but easier to enforce commercially [13].    
Author
Author
Author Profile
Nidhi Mandole LinkedIn
Senior Research Analyst
She is an extremely curious individual currently working in Healthcare and Medical Devices Domain. Nidhi is comfortably versed in data centric research backed by healthcare educational background. She leverages extensive data mining and analytics tools such as Primary and Secondary Research, Statistical Analysis, Machine Learning, Data Modelling. Her key role also involves Technical Sales Support, Client Interaction and Project management within the Healthcare team. Lastly, she showcases extensive affinity towards learning new skills and remain fascinated in implementing them.
Co-Author
Co-Author Profile
Rahul Gotadki LinkedIn
Research Manager
He holds an experience of about 9+ years in Market Research and Business Consulting, working under the spectrum of Life Sciences and Healthcare domains. Rahul conceptualizes and implements a scalable business strategy and provides strategic leadership to the clients. His expertise lies in market estimation, competitive intelligence, pipeline analysis, customer assessment, etc.
Share::
Request Free Sample
Download Free Sample

Kindly complete the form below to receive a free sample of this Report

* Please use a valid business email

Share::
Request Free Sample
Download PDF ×

We do not share your information with anyone. However, we may send you emails based on your report interest from time to time. You may contact us at any time to opt-out.
















