• Cat-intel
  • MedIntelliX
  • Resources
  • About Us
  • Hero Background
    English
    Chinese
    French
    Japanese
    Korean
    German
    Spanish

    Bottled Water Products Market Size

    ID: MRFR/F-B & N/12493-HCR
    128 Pages
    Varsha More
    October 2025

    Bottled Water Products Market Research Report: By Type (Spring Water, Mineral Water, Purified Water, Sparkling Water, Flavored Water), By Packaging Type (PET Bottles, Glass Bottles, Cartons, Kegs, Pouches), By Distribution Channel (Supermarkets/Hypermarkets, Convenience Stores, Online Retail, Restaurants/Cafes, Health Food Stores), By End User (Residential, Commercial, Institutional) andBy Regi...

    Share:
    Download PDF ×

    We do not share your information with anyone. However, we may send you emails based on your report interest from time to time. You may contact us at any time to opt-out.

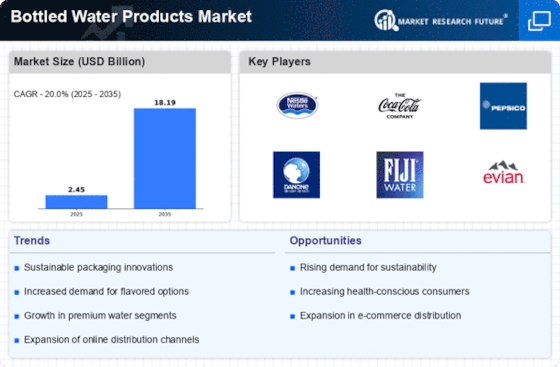
    Bottled Water Products Market Infographic
    $ 4,950.0
    $ 5,950.0
    $ 7,250.0

    Bottled Water Products Size

    Bottled Water Products Market Growth Projections and Opportunities

    The bottled water products market is influenced by a variety of factors that collectively shape its growth and dynamics. One of the primary drivers is the increasing emphasis on health and wellness among consumers. With growing awareness of the importance of hydration for overall well-being, bottled water has become a popular choice for individuals seeking a convenient and readily available source of clean and safe drinking water. The health-conscious trend, coupled with concerns about sugary beverages, has propelled the demand for bottled water as a healthier alternative.

    Environmental consciousness and sustainability considerations have a significant impact on the bottled water market. As consumers become more environmentally aware, there is a growing demand for sustainable packaging solutions and eco-friendly practices within the industry. This has led to the rise of initiatives such as using recycled materials for bottles, promoting recyclability, and reducing single-use plastic. Companies adopting sustainable practices and communicating these efforts to consumers often gain a competitive edge in the market.

    Geographical and demographic factors play a crucial role in shaping the bottled water market. Regions with concerns about water quality or limited access to clean drinking water often witness higher consumption of bottled water. Additionally, urbanization and a fast-paced lifestyle contribute to the demand for convenient on-the-go hydration, further boosting the market in densely populated areas. Demographic factors, such as an aging population and the increasing number of health-conscious millennials, also influence consumption patterns.

    Regulatory frameworks and quality standards are essential factors that impact the bottled water market. Stringent regulations governing water quality, safety, and labeling influence manufacturing processes and marketing strategies. Adherence to these standards is crucial for building consumer trust, and companies that consistently meet or exceed regulatory requirements often establish a positive brand image. Additionally, changes in regulations regarding plastic use and environmental impact may prompt companies to adopt more sustainable practices.

    Economic conditions and consumer purchasing power contribute to market dynamics. In times of economic stability, consumers may be more willing to spend on convenience and premium bottled water products. Conversely, during economic downturns, there may be a shift towards more cost-conscious choices. Market participants need to be attuned to these economic dynamics and adjust pricing strategies and product offerings accordingly.

    Brand perception and marketing strategies significantly influence the bottled water market. Consumers often choose bottled water based on brand reputation, perceived purity, and messaging around the source of the water. Companies invest in marketing campaigns highlighting the health benefits, purity, and sustainability of their products to differentiate themselves in a crowded market. Effective branding and communication strategies can significantly impact consumer choices and brand loyalty.

    Technological advancements in water purification and bottling processes are driving innovation in the bottled water market. Advanced filtration technologies, such as reverse osmosis and ultraviolet treatment, contribute to the production of purified and mineral-enriched water. Packaging innovations, including lightweight and sustainable materials, enhance the convenience and environmental friendliness of bottled water products. Companies that invest in technology to improve product quality and sustainability often gain a competitive advantage.

    Distribution channels and retail partnerships are critical elements in the bottled water market. Accessibility through supermarkets, convenience stores, vending machines, and online platforms plays a vital role in reaching consumers. Collaborations with retailers and effective distribution strategies contribute to the visibility and availability of bottled water, influencing purchasing decisions.

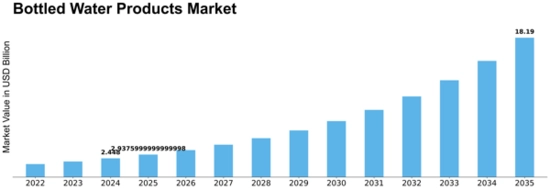
    Bottled Water Products Market Size Graph
    Author
    Varsha More
    Research Analyst

    Experienced business professional with a demonstrated history of working in the CFnB industry. Skilled in market research, and market estimation. Strong professional with a Masters focused in marketing management.

    Leave a Comment

    FAQs

    What is the projected market valuation for the Bottled Water Products Market in 2035?

    The projected market valuation for the Bottled Water Products Market in 2035 is 18.19 USD Billion.

    Market Summary

    As per MRFR analysis, the Bottled Water Products Market was estimated at 2.448 USD Billion in 2024. The bottled water industry is projected to grow from 2.938 in 2025 to 18.19 by 2035, exhibiting a compound annual growth rate (CAGR) of 20.0 during the forecast period 2025 - 2035.

    Key Market Trends & Highlights

    The Bottled Water Products Market is experiencing a dynamic shift towards health-conscious and sustainable offerings.

    • The North American market remains the largest, driven by a strong health and wellness focus among consumers.
    • In the Asia-Pacific region, the bottled water market is the fastest-growing, fueled by increasing urbanization and disposable income.
    • Spring water continues to dominate as the largest segment, while sparkling water is rapidly gaining popularity among health-conscious consumers.
    • Key market drivers include heightened health consciousness and a growing emphasis on environmental sustainability, influencing product innovation.

    Market Size & Forecast

    2024 Market Size 2.448 (USD Billion)
    2035 Market Size 18.19 (USD Billion)
    CAGR (2025 - 2035) 20.0%
    Largest Regional Market Share in 2024 North America

    Major Players

    <p>Nestle Waters (CH), Coca-Cola (US), PepsiCo (US), Danone (FR), Fiji Water (US), Evian (FR), Gerolsteiner (DE), Voss Water (NO), San Pellegrino (IT)</p>

    Market Trends

    The Bottled Water Products Market is currently experiencing a dynamic evolution, driven by shifting consumer preferences and increasing health consciousness. As individuals become more aware of the importance of hydration, the demand for bottled water continues to rise. This market encompasses a diverse range of products, including spring water, mineral water, and flavored varieties, catering to various tastes and lifestyles. Additionally, the growing trend towards sustainability is influencing production practices, with companies exploring eco-friendly packaging options and sourcing methods. This shift not only appeals to environmentally conscious consumers but also aligns with broader global initiatives aimed at reducing plastic waste. Moreover, the Bottled Water Products Market is witnessing innovations in product offerings, with brands introducing functional waters infused with vitamins, electrolytes, and natural flavors. These developments suggest a potential shift in consumer behavior, as individuals seek beverages that provide added health benefits. The competitive landscape is also evolving, with both established brands and new entrants vying for market share. As the market continues to expand, it appears that adaptability and responsiveness to consumer trends will be crucial for success in this sector. Overall, the Bottled Water Products Market is poised for continued growth, driven by health trends, sustainability efforts, and innovative product development.

    Health and Wellness Focus

    The Bottled Water Products Market is increasingly influenced by a growing emphasis on health and wellness. Consumers are gravitating towards products that promote hydration and overall well-being, leading to a rise in demand for functional waters that offer additional health benefits.

    Sustainability Initiatives

    Sustainability is becoming a central theme within the Bottled Water Products Market. Companies are actively seeking eco-friendly packaging solutions and sustainable sourcing practices to appeal to environmentally conscious consumers, reflecting a broader commitment to reducing environmental impact.

    Product Innovation

    Innovation plays a pivotal role in the Bottled Water Products Market, with brands introducing new flavors and formulations. This trend indicates a shift towards more diverse offerings, as consumers seek unique and enjoyable hydration experiences.

    The bottled water market is experiencing a notable shift towards sustainable packaging solutions, reflecting a growing consumer preference for environmentally friendly products.

    U.S. Environmental Protection Agency

    Bottled Water Products Market Market Drivers

    Health Consciousness

    The increasing awareness of health and wellness among consumers appears to be a primary driver for the Bottled Water Products Market. As individuals prioritize hydration and seek healthier alternatives to sugary beverages, bottled water has gained traction. According to recent data, bottled water consumption has surged, with a notable increase of approximately 6 percent annually. This trend suggests that consumers are gravitating towards products that promote well-being, thereby enhancing the market's growth potential. Furthermore, the rise of fitness culture and the emphasis on maintaining a balanced lifestyle contribute to the demand for bottled water, as it is perceived as a convenient and healthy option. Consequently, the Bottled Water Products Market is likely to continue expanding as health-conscious consumers increasingly opt for bottled water over other drink options.

    Diverse Product Offerings

    The Bottled Water Products Market is experiencing a notable expansion in product diversity, which serves as a key driver of growth. Consumers are increasingly seeking variety, leading to the introduction of flavored, mineral-infused, and functional waters. This diversification caters to different taste preferences and health needs, thereby attracting a broader audience. Recent data suggests that flavored bottled water has seen a growth rate of approximately 8 percent, indicating a shift in consumer preferences towards more innovative options. As brands continue to experiment with new flavors and formulations, the Bottled Water Products Market is likely to benefit from heightened consumer interest and engagement. This trend not only enhances market competitiveness but also encourages brands to differentiate themselves through unique product offerings.

    Environmental Sustainability

    Sustainability initiatives are becoming increasingly pivotal in shaping consumer preferences within the Bottled Water Products Market. As environmental concerns rise, consumers are more inclined to support brands that demonstrate a commitment to eco-friendly practices. This shift is evidenced by the growing demand for bottled water packaged in recyclable materials and the introduction of biodegradable bottles. Recent statistics indicate that nearly 50 percent of consumers are willing to pay a premium for sustainable products, which underscores the potential for growth in this segment. Companies that adopt sustainable practices not only enhance their brand image but also align with the values of environmentally conscious consumers. Thus, the Bottled Water Products Market is likely to witness a transformation as brands innovate to meet the expectations of a more eco-aware customer base.

    Convenience and Accessibility

    The convenience factor associated with bottled water is a significant driver for the Bottled Water Products Market. In an increasingly fast-paced world, consumers seek products that offer ease of use and accessibility. Bottled water provides a portable hydration solution that fits seamlessly into busy lifestyles. Recent market analysis indicates that convenience stores and vending machines are among the top distribution channels for bottled water, accounting for a substantial share of sales. This trend suggests that as urbanization continues to rise, the demand for easily accessible bottled water will likely increase. Additionally, the proliferation of on-the-go consumption patterns further supports the growth of the Bottled Water Products Market, as consumers prioritize products that can be consumed anytime and anywhere.

    Marketing and Branding Strategies

    Effective marketing and branding strategies are crucial drivers for the Bottled Water Products Market. As competition intensifies, brands are increasingly focusing on creating strong identities and engaging narratives to capture consumer attention. Innovative advertising campaigns and social media presence play a vital role in shaping consumer perceptions and preferences. Recent studies indicate that brands with robust marketing strategies experience higher customer loyalty and retention rates. This suggests that as companies invest in brand development and consumer engagement, they are likely to see a positive impact on sales and market share. Furthermore, the Bottled Water Products Market may witness a shift towards experiential marketing, where brands create memorable experiences that resonate with consumers, thereby fostering deeper connections and driving growth.

    Market Segment Insights

    By Type: Spring Water (Largest) vs. Sparkling Water (Fastest-Growing)

    <p>In the Bottled Water Products Market, the share distribution indicates that Spring Water holds the largest segment, revered for its natural origins and perceived purity. Following closely, Mineral Water and Purified Water show considerable popularity, appealing to health-conscious consumers. Flavored Water is gradually making its mark, particularly among younger demographics looking for alternative hydration options. These shifting preferences highlight diverse consumer tastes in bottled water offerings. Growth trends reveal that the Bottled Water Products Market is thriving, driven by increasing health awareness and lifestyle choices. Sparkling Water is noted as the fastest-growing segment, catering to a demand for carbonated, refreshing beverages without sacrificing health benefits. The rise in flavored options also signifies a shift in consumer behavior, emphasizing personalized and convenient hydration experiences.</p>

    <p>Spring Water (Dominant) vs. Flavored Water (Emerging)</p>

    <p>Spring Water stands out as the most dominant player in the Bottled Water Products Market, recognized for its minimal processing and the natural minerals it retains from its source. This segment enjoys high consumer trust, appealing to individuals seeking purity and quality in their hydration choices. Conversely, Flavored Water is rapidly emerging, creating an innovative niche with its variety of taste options designed to enhance the drinking experience. Targeted towards health-conscious consumers who prefer non-sugary alternatives to carbonated sodas, Flavored Water benefits from the trend towards healthier lifestyle choices. While Spring Water offers authenticity and natural appeal, Flavored Water introduces excitement and variety, particularly among younger consumers.</p>

    By Packaging Type: PET Bottles (Largest) vs. Glass Bottles (Fastest-Growing)

    <p>In the Bottled Water Products Market, PET bottles dominate the packaging type segment, holding the largest market share due to their light weight, durability, and cost-effectiveness. Glass bottles are gaining attention for premium bottled water offerings, accounting for a smaller yet significant share in comparison. Other packaging types like cartons, kegs, and pouches hold niche segments, appealing to specific consumer preferences and use cases, but do not match the overall share of PET or glass.</p>

    <p>PET Bottles (Dominant) vs. Glass Bottles (Emerging)</p>

    <p>PET bottles are the dominant choice in the bottled water market, known for their convenience and recyclability. They cater to mass market demands and are favored for single-serve options. Glass bottles, while less common, are emerging as a popular alternative in high-end markets due to their environmentally friendly perception and ability to preserve water quality. Consumers increasingly gravitate towards stylish, reusable glass options, especially in health-conscious demographics. As eco-friendly practices gain traction, both PET and glass are likely to evolve, addressing sustainability concerns across production and disposal.</p>

    By Distribution Channel: Supermarkets/Hypermarkets (Largest) vs. Online Retail (Fastest-Growing).webp

    <p>In the Bottled Water Products Market, distribution channels play a pivotal role in shaping consumer accessibility and purchasing behavior. Supermarkets and hypermarkets dominate the landscape, responsible for a significant proportion of bottled water sales owing to their geographical reach and diverse product range. Following closely, convenience stores, restaurants, and cafes contribute to market dynamics, while health food stores cater to health-conscious consumers looking for premium bottled water options.</p>

    <p>Supermarkets/Hypermarkets: Dominant vs. Online Retail: Emerging</p>

    <p>Supermarkets and hypermarkets are the dominant distribution channel in the bottled water market, providing extensive selections and competitive pricing that attract a wide consumer base. Their ability to bundle products and offer promotions enhances purchase motivation. Conversely, online retail is an emerging channel rapidly gaining traction, particularly among younger consumers who value convenience and accessibility. The surge in e-commerce platforms, combined with advancements in logistics and delivery services, is driving online sales, positioning it as a crucial segment for future growth. The appeal of home delivery and subscription services is also significantly influencing consumer preferences.</p>

    By End User: Residential (Largest) vs. Commercial (Fastest-Growing)

    <p>The bottled water products market is characterized by diverse end user segments, including residential, commercial, and institutional. Among these, the residential segment holds the largest share, driven by increasing consumer health consciousness and the convenience of bottled water. The commercial segment is witnessing rapid growth as businesses, restaurants, and hospitality sectors increasingly opt for bottled water offerings to meet customer demands and enhance their service portfolios. These trends reflect a shifting preference towards accessible hydration solutions in various environments.</p>

    <p>Residential (Dominant) vs. Commercial (Emerging)</p>

    <p>The residential segment is the dominant force in the bottled water products market, characterized by a consistent and high demand as consumers seek convenient hydration options at home. This segment benefits from increased health awareness, with many households prioritizing bottled water for its perceived purity and health benefits. On the other hand, the commercial segment is emerging rapidly, driven by a surge in demand from the food and beverage industry, fitness centers, and workplaces. As companies recognize the importance of providing quality hydration options to their clients and employees, the commercial sector is expected to experience significant growth, catering to new consumer trends that prioritize convenience and quality.</p>

    Get more detailed insights about Bottled Water Products Market Research Report — Global Forecast till 2035

    Regional Insights

    North America : Market Leader in Bottled Water

    North America is the largest market for bottled water products, holding approximately 40% of the global market share. The region's growth is driven by increasing health consciousness, a shift from sugary beverages to healthier options, and stringent regulations on water quality. The demand for premium bottled water is also rising, supported by consumer preferences for natural and mineral water. The United States is the leading country in this market, followed by Canada. Major players like Coca-Cola, PepsiCo, and Nestle Waters dominate the landscape, offering a wide range of bottled water products. The competitive environment is characterized by innovation in packaging and sustainability initiatives, as companies strive to meet consumer expectations and regulatory standards.

    Europe : Sustainable Growth and Innovation

    Europe is the second-largest market for bottled water, accounting for around 30% of the global share. The region's growth is fueled by increasing demand for eco-friendly packaging and a shift towards healthier lifestyles. Regulatory frameworks, such as the EU's Single-Use Plastics Directive, are catalyzing innovation in sustainable practices within the bottled water sector. Leading countries include Germany, France, and Italy, with significant contributions from brands like Evian, San Pellegrino, and Gerolsteiner. The competitive landscape is marked by a focus on premium products and local sourcing, as consumers increasingly prefer brands that align with their values. The presence of key players ensures a dynamic market, adapting to evolving consumer preferences and regulatory requirements.

    Asia-Pacific : Rapid Growth and Urbanization

    Asia-Pacific is witnessing rapid growth in the bottled water market, holding approximately 25% of the global share. The region's expansion is driven by urbanization, rising disposable incomes, and increasing health awareness among consumers. Regulatory support for safe drinking water is also a significant catalyst for market growth, as governments promote bottled water as a safe alternative. China and India are the leading countries in this market, with a growing number of local and international brands entering the space. Key players like Coca-Cola and PepsiCo are expanding their portfolios to include a variety of bottled water products. The competitive landscape is characterized by aggressive marketing strategies and a focus on product differentiation to capture the growing consumer base.

    Middle East and Africa : Emerging Market Potential

    The Middle East and Africa region is an emerging market for bottled water, accounting for about 5% of the global share. The growth is driven by increasing urbanization, a rising population, and a growing awareness of health and wellness. Regulatory initiatives aimed at improving water quality and safety are also contributing to market expansion. Countries like South Africa and the UAE are leading the market, with a mix of local and international brands competing for market share. Key players include Nestle Waters and local brands that focus on affordability and accessibility. The competitive landscape is evolving, with companies investing in marketing and distribution channels to reach a broader audience and meet the growing demand for bottled water products.

    Key Players and Competitive Insights

    The Bottled Water Products Market is characterized by a dynamic competitive landscape, driven by increasing consumer demand for health-conscious beverages and sustainable packaging solutions. Major players such as Nestle Waters (CH), Coca-Cola (US), and PepsiCo (US) are strategically positioned to leverage their extensive distribution networks and brand recognition. Nestle Waters (CH) has focused on enhancing its product portfolio with premium offerings, while Coca-Cola (US) and PepsiCo (US) are investing heavily in marketing campaigns that emphasize the health benefits of hydration. This collective emphasis on innovation and brand loyalty shapes a competitive environment that is both robust and evolving.

    Key business tactics within the Bottled Water Products Market include localizing manufacturing and optimizing supply chains to enhance efficiency and reduce costs. The market appears moderately fragmented, with a mix of established brands and emerging players vying for market share. The influence of key players is significant, as their operational strategies often set industry standards, compelling smaller companies to adapt or innovate in response.

    In August 2025, Coca-Cola (US) announced a partnership with a leading technology firm to develop a new line of eco-friendly bottled water products. This strategic move underscores Coca-Cola's commitment to sustainability and aligns with growing consumer preferences for environmentally responsible products. By integrating advanced technology into their production processes, Coca-Cola (US) aims to reduce its carbon footprint while appealing to a more environmentally conscious demographic.

    In September 2025, PepsiCo (US) launched a new initiative aimed at reducing plastic waste by introducing a fully recyclable bottle made from plant-based materials. This initiative not only enhances PepsiCo's sustainability credentials but also positions the company as a leader in innovation within the bottled water segment. The strategic importance of this move lies in its potential to attract consumers who prioritize eco-friendly products, thereby expanding PepsiCo's market reach.

    In July 2025, Danone (FR) expanded its distribution network in Asia by acquiring a local bottled water brand, which allows it to tap into the rapidly growing demand for bottled water in that region. This acquisition is strategically significant as it enhances Danone's market presence and enables the company to leverage local insights to better cater to consumer preferences. Such expansions are indicative of a broader trend where established companies seek to consolidate their positions in emerging markets.

    As of October 2025, current competitive trends in the Bottled Water Products Market are increasingly defined by digitalization, sustainability, and the integration of artificial intelligence in supply chain management. Strategic alliances are becoming more prevalent, as companies recognize the value of collaboration in enhancing innovation and operational efficiency. Looking ahead, competitive differentiation is likely to evolve from traditional price-based competition to a focus on innovation, technological advancements, and the reliability of supply chains, reflecting a shift in consumer expectations and market dynamics.

    Key Companies in the Bottled Water Products Market market include

    Industry Developments

    The Global Bottled Water Products Market has seen significant developments recently, particularly with companies like San Pellegrino, Danone, Smartwater, and Fiji Water focusing on sustainable sourcing and eco-friendly packaging. Notably, in October 2023, Coca Cola announced a strategic initiative aimed at reducing plastic use in its bottled water lines, which includes Poland Spring and Dasani. Additionally, Aquafina, under PepsiCo, is expanding its product range to include flavored waters, capturing the health-conscious consumer segment. In terms of mergers and acquisitions, Danone completed the acquisition of a local bottled water brand in March 2023, which bolstered its presence in the Asian market.

    The market valuation for major players, including Nestle and Monster Beverage, has been positively impacted due to rising consumer demand for hydration options amidst health trends. Over the past two years, the bottled water sector has experienced a growth spurt, particularly following the pandemic, as consumers increasingly seek healthier beverage alternatives. New regulations aimed at reducing plastic waste are also shaping market strategies across companies like Primo Water Corporation and Voss Water, prompting innovation in packaging solutions. The ongoing shift towards sustainability remains a key focus in the industry.

    .webp

    Future Outlook

    Bottled Water Products Market Future Outlook

    <p>The Bottled Water Products Market is projected to grow at a 20.0% CAGR from 2024 to 2035, driven by health trends, convenience, and sustainability initiatives.</p>

    New opportunities lie in:

    • <p>Expansion of eco-friendly packaging solutions</p>
    • <p>Development of flavored and functional water products</p>
    • <p>Implementation of direct-to-consumer subscription models</p>

    <p>By 2035, the market is expected to achieve substantial growth, reflecting evolving consumer preferences and innovative strategies.</p>

    Market Segmentation

    Bottled Water Products Market Type Outlook

    • Spring Water
    • Mineral Water
    • Purified Water
    • Sparkling Water
    • Flavored Water

    Bottled Water Products Market End User Outlook

    • Residential
    • Commercial
    • Institutional

    Bottled Water Products Market Packaging Type Outlook

    • PET Bottles
    • Glass Bottles
    • Cartons
    • Kegs
    • Pouches

    Bottled Water Products Market Distribution Channel Outlook

    • Supermarkets/Hypermarkets.webp
    • Convenience Stores
    • Online Retail
    • Restaurants/Cafes.webp
    • Health Food Stores

    Report Scope

    MARKET SIZE 20242.448(USD Billion)
    MARKET SIZE 20252.938(USD Billion)
    MARKET SIZE 203518.19(USD Billion)
    COMPOUND ANNUAL GROWTH RATE (CAGR)20.0% (2024 - 2035)
    REPORT COVERAGERevenue Forecast, Competitive Landscape, Growth Factors, and Trends
    BASE YEAR2024
    Market Forecast Period2025 - 2035
    Historical Data2019 - 2024
    Market Forecast UnitsUSD Billion
    Key Companies ProfiledMarket analysis in progress
    Segments CoveredMarket segmentation analysis in progress
    Key Market OpportunitiesGrowing consumer preference for sustainable packaging in the Bottled Water Products Market presents significant opportunities.
    Key Market DynamicsRising consumer preference for sustainable packaging drives innovation in the bottled water products market.
    Countries CoveredNorth America, Europe, APAC, South America, MEA

    Market Highlights

    Author

    Varsha More
    Research Analyst

    She holds an experience of about 6+ years in market research and business consulting, working under the spectrum of information communication technology, telecommunications and semiconductor domains. aarti conceptualizes and implements a scalable business strategy and provides strategic leadership to the clients. her expertise lies in market estimation, competitive intelligence, pipeline analysis, customer assessment, etc.

    Leave a Comment

    Latest Comments

    John Doe
    john@example.com

    This is a great article! Really helped me understand the topic better.

    Posted on July 23, 2025, 10:15 AM
    Jane Smith
    jane@domain.com

    Thanks for sharing this. I’ve bookmarked it for later reference.

    Posted on July 22, 2025, 7:45 PM

    FAQs

    What is the projected market valuation for the Bottled Water Products Market in 2035?

    The projected market valuation for the Bottled Water Products Market in 2035 is 18.19 USD Billion.

    1. FACTOR ANALYSIS
      1. \r\n\r\n\r\nValue chain Analysis
      2. \r\n\r\n\r\nPorter's
      3. Five Forces Analysis
      4. \r\n\r\n\r\nBargaining Power of Suppliers
      5. \r\n\r\n\r\nBargaining
      6. Power of Buyers
      7. \r\n\r\n\r\nThreat of New Entrants
      8. \r\n\r\n\r\nThreat
      9. of Substitutes
      10. \r\n\r\n\r\nIntensity of Rivalry
      11. \r\n\r\n\r\n\r\n\r\nCOVID-19
      12. Impact Analysis
      13. \r\n\r\n\r\nMarket Impact Analysis
      14. \r\n\r\n\r\nRegional
      15. Impact
      16. \r\n\r\n\r\nOpportunity and Threat Analysis
      17. \r\n\r\n\r\n\r\n\r\n\r\n\r\n
      18. \r\n
      19. \r\n\r\n\r\nBottled
    2. Water Products Market, BY Type (USD Billion)
      1. \r\n\r\n\r\nSpring
      2. Water
      3. \r\n\r\n\r\nMineral Water
      4. \r\n\r\n\r\nPurified
      5. Water
      6. \r\n\r\n\r\nSparkling Water
      7. \r\n\r\n\r\nFlavored
      8. Water
      9. \r\n\r\n\r\n\r\n\r\nBottled Water Products
    3. Market, BY Packaging Type (USD Billion)
      1. \r\n\r\n\r\nPET
      2. Bottles
      3. \r\n\r\n\r\nGlass Bottles
      4. \r\n\r\n\r\nCartons
      5. \r\n\r\n\r\nKegs
      6. \r\n\r\n\r\nPouches
      7. \r\n\r\n\r\n\r\n\r\nBottled
    4. Water Products Market, BY Distribution Channel (USD Billion)
      1. \r\n\r\n\r\nSupermarkets/Hypermarkets
      2. \r\n\r\n\r\nConvenience
      3. Stores
      4. \r\n\r\n\r\nOnline Retail
      5. \r\n\r\n\r\nRestaurants/Cafes
      6. \r\n\r\n\r\nHealth
      7. Food Stores
      8. \r\n\r\n\r\n\r\n\r\nBottled Water Products
    5. Market, BY End User (USD Billion)
      1. \r\n\r\n\r\nResidential
      2. \r\n\r\n\r\nCommercial
      3. \r\n\r\n\r\nInstitutional
      4. \r\n\r\n\r\n\r\n\r\nBottled
    6. Water Products Market, BY Regional (USD Billion)
      1. \r\n\r\n\r\nNorth
      2. America
      3. \r\n\r\n\r\nUS
      4. \r\n\r\n\r\nCanada
      5. \r\n\r\n\r\n\r\n\r\nEurope
      6. \r\n\r\n\r\nGermany
      7. \r\n\r\n\r\nUK
      8. \r\n\r\n\r\nFrance
      9. \r\n\r\n\r\nRussia
      10. \r\n\r\n\r\nItaly
      11. \r\n\r\n\r\nSpain
      12. \r\n\r\n\r\nRest
      13. of Europe
      14. \r\n\r\n\r\n\r\n\r\nAPAC
      15. \r\n\r\n\r\nChina
      16. \r\n\r\n\r\nIndia
      17. \r\n\r\n\r\nJapan
      18. \r\n\r\n\r\nSouth
      19. Korea
      20. \r\n\r\n\r\nMalaysia
      21. \r\n\r\n\r\nThailand
      22. \r\n\r\n\r\nIndonesia
      23. \r\n\r\n\r\nRest
      24. of APAC
      25. \r\n\r\n\r\n\r\n\r\nSouth America
      26. \r\n\r\n\r\nBrazil
      27. \r\n\r\n\r\nMexico
      28. \r\n\r\n\r\nArgentina
      29. \r\n\r\n\r\nRest
      30. of South America
      31. \r\n\r\n\r\n\r\n\r\nMEA
      32. \r\n\r\n\r\nGCC
      33. Countries
      34. \r\n\r\n\r\nSouth Africa
      35. \r\n\r\n\r\nRest
      36. of MEA
      37. \r\n\r\n\r\n\r\n\r\n\r\n\r\n
      38. \r\n
      39. \r\n\r\n\r\nCompetitive
      40. Landscape
      41. \r\n\r\n\r\nOverview
      42. \r\n\r\n\r\nCompetitive
      43. Analysis
      44. \r\n\r\n\r\nMarket share Analysis
      45. \r\n\r\n\r\nMajor
      46. Growth Strategy in the Bottled Water Products Market
      47. \r\n\r\n\r\nCompetitive
      48. Benchmarking
      49. \r\n\r\n\r\nLeading Players in Terms of Number of Developments
      50. in the Bottled Water Products Market
      51. \r\n\r\n\r\nKey developments
      52. and growth strategies
      53. \r\n\r\n\r\nNew Product Launch/Service Deployment
      54. \r\n\r\n\r\nMerger
      55. & Acquisitions
      56. \r\n\r\n\r\nJoint Ventures
      57. \r\n\r\n\r\n\r\n\r\nMajor
      58. Players Financial Matrix
      59. \r\n\r\n\r\nSales and Operating Income
      60. \r\n\r\n\r\nMajor
      61. Players R&D Expenditure. 2023
      62. \r\n\r\n\r\n\r\n\r\n\r\n\r\nCompany
      63. Profiles
      64. \r\n\r\n\r\nSan Pellegrino
      65. \r\n\r\n\r\nFinancial
      66. Overview
      67. \r\n\r\n\r\nProducts Offered
      68. \r\n\r\n\r\nKey
      69. Developments
      70. \r\n\r\n\r\nSWOT Analysis
      71. \r\n\r\n\r\nKey
      72. Strategies
      73. \r\n\r\n\r\n\r\n\r\nDanone
      74. \r\n\r\n\r\nFinancial
      75. Overview
      76. \r\n\r\n\r\nProducts Offered
      77. \r\n\r\n\r\nKey
      78. Developments
      79. \r\n\r\n\r\nSWOT Analysis
      80. \r\n\r\n\r\nKey
      81. Strategies
      82. \r\n\r\n\r\n\r\n\r\nSmartwater
      83. \r\n\r\n\r\nFinancial
      84. Overview
      85. \r\n\r\n\r\nProducts Offered
      86. \r\n\r\n\r\nKey
      87. Developments
      88. \r\n\r\n\r\nSWOT Analysis
      89. \r\n\r\n\r\nKey
      90. Strategies
      91. \r\n\r\n\r\n\r\n\r\nFiuggi
      92. \r\n\r\n\r\nFinancial
      93. Overview
      94. \r\n\r\n\r\nProducts Offered
      95. \r\n\r\n\r\nKey
      96. Developments
      97. \r\n\r\n\r\nSWOT Analysis
      98. \r\n\r\n\r\nKey
      99. Strategies
      100. \r\n\r\n\r\n\r\n\r\nPoland Spring
      101. \r\n\r\n\r\nFinancial
      102. Overview
      103. \r\n\r\n\r\nProducts Offered
      104. \r\n\r\n\r\nKey
      105. Developments
      106. \r\n\r\n\r\nSWOT Analysis
      107. \r\n\r\n\r\nKey
      108. Strategies
      109. \r\n\r\n\r\n\r\n\r\nAquafina
      110. \r\n\r\n\r\nFinancial
      111. Overview
      112. \r\n\r\n\r\nProducts Offered
      113. \r\n\r\n\r\nKey
      114. Developments
      115. \r\n\r\n\r\nSWOT Analysis
      116. \r\n\r\n\r\nKey
      117. Strategies
      118. \r\n\r\n\r\n\r\n\r\nNestle
      119. \r\n\r\n\r\nFinancial
      120. Overview
      121. \r\n\r\n\r\nProducts Offered
      122. \r\n\r\n\r\nKey
      123. Developments
      124. \r\n\r\n\r\nSWOT Analysis
      125. \r\n\r\n\r\nKey
      126. Strategies
      127. \r\n\r\n\r\n\r\n\r\nPepsiCo
      128. \r\n\r\n\r\nFinancial
      129. Overview
      130. \r\n\r\n\r\nProducts Offered
      131. \r\n\r\n\r\nKey
      132. Developments
      133. \r\n\r\n\r\nSWOT Analysis
      134. \r\n\r\n\r\nKey
      135. Strategies
      136. \r\n\r\n\r\n\r\n\r\nCocaCola
      137. \r\n\r\n\r\nFinancial
      138. Overview
      139. \r\n\r\n\r\nProducts Offered
      140. \r\n\r\n\r\nKey
      141. Developments
      142. \r\n\r\n\r\nSWOT Analysis
      143. \r\n\r\n\r\nKey
      144. Strategies
      145. \r\n\r\n\r\n\r\n\r\nFiji Water
      146. \r\n\r\n\r\nFinancial
      147. Overview
      148. \r\n\r\n\r\nProducts Offered
      149. \r\n\r\n\r\nKey
      150. Developments
      151. \r\n\r\n\r\nSWOT Analysis
      152. \r\n\r\n\r\nKey
      153. Strategies
      154. \r\n\r\n\r\n\r\n\r\nNestle Waters
      155. \r\n\r\n\r\nFinancial
      156. Overview
      157. \r\n\r\n\r\nProducts Offered
      158. \r\n\r\n\r\nKey
      159. Developments
      160. \r\n\r\n\r\nSWOT Analysis
      161. \r\n\r\n\r\nKey
      162. Strategies
      163. \r\n\r\n\r\n\r\n\r\nMonster Beverage
      164. \r\n\r\n\r\nFinancial
      165. Overview
      166. \r\n\r\n\r\nProducts Offered
      167. \r\n\r\n\r\nKey
      168. Developments
      169. \r\n\r\n\r\nSWOT Analysis
      170. \r\n\r\n\r\nKey
      171. Strategies
      172. \r\n\r\n\r\n\r\n\r\nPrimo Water Corporation
      173. \r\n\r\n\r\nFinancial
      174. Overview
      175. \r\n\r\n\r\nProducts Offered
      176. \r\n\r\n\r\nKey
      177. Developments
      178. \r\n\r\n\r\nSWOT Analysis
      179. \r\n\r\n\r\nKey
      180. Strategies
      181. \r\n\r\n\r\n\r\n\r\nVoss Water
      182. \r\n\r\n\r\nFinancial
      183. Overview
      184. \r\n\r\n\r\nProducts Offered
      185. \r\n\r\n\r\nKey
      186. Developments
      187. \r\n\r\n\r\nSWOT Analysis
      188. \r\n\r\n\r\nKey
      189. Strategies
      190. \r\n\r\n\r\n\r\n\r\nEvian
      191. \r\n\r\n\r\nFinancial
      192. Overview
      193. \r\n\r\n\r\nProducts Offered
      194. \r\n\r\n\r\nKey
      195. Developments
      196. \r\n\r\n\r\nSWOT Analysis
      197. \r\n\r\n\r\nKey
      198. Strategies
      199. \r\n\r\n\r\n\r\n\r\n\r\n\r\nAppendix
      200. \r\n\r\n\r\nReferences
      201. \r\n\r\n\r\nRelated
      202. Reports
      203. \r\n\r\n\r\n\r\n\r\nLIST Of tables
      204. \r\n
      205. \r\n\r\n\r\nLIST
    7. OF ASSUMPTIONS
      1. \r\n\r\n\r\nNorth America Bottled Water Products Market
      2. SIZE ESTIMATES & FORECAST, BY TYPE, 2019-2035 (USD Billions)
      3. \r\n\r\n\r\nNorth
    8. America Bottled Water Products Market SIZE ESTIMATES & FORECAST, BY PACKAGING
      1. TYPE, 2019-2035 (USD Billions)
      2. \r\n\r\n\r\nNorth America Bottled
    9. Water Products Market SIZE ESTIMATES & FORECAST, BY DISTRIBUTION CHANNEL, 2019-2035
      1. (USD Billions)
      2. \r\n\r\n\r\nNorth America Bottled Water Products Market
      3. SIZE ESTIMATES & FORECAST, BY END USER, 2019-2035 (USD Billions)
      4. \r\n\r\n\r\nNorth
    10. America Bottled Water Products Market SIZE ESTIMATES & FORECAST, BY REGIONAL,
      1. \r\n\r\n\r\nUS Bottled Water Products Market
      2. SIZE ESTIMATES & FORECAST, BY TYPE, 2019-2035 (USD Billions)
      3. \r\n\r\n\r\nUS
    11. Bottled Water Products Market SIZE ESTIMATES & FORECAST, BY PACKAGING TYPE,
      1. \r\n\r\n\r\nUS Bottled Water Products Market
      2. SIZE ESTIMATES & FORECAST, BY DISTRIBUTION CHANNEL, 2019-2035 (USD Billions)
      3. \r\n\r\n\r\nUS
    12. Bottled Water Products Market SIZE ESTIMATES & FORECAST, BY END USER, 2019-2035
      1. (USD Billions)
      2. \r\n\r\n\r\nUS Bottled Water Products Market SIZE
      3. ESTIMATES & FORECAST, BY REGIONAL, 2019-2035 (USD Billions)
      4. \r\n\r\n\r\nCanada
    13. Bottled Water Products Market SIZE ESTIMATES & FORECAST, BY TYPE, 2019-2035
      1. (USD Billions)
      2. \r\n\r\n\r\nCanada Bottled Water Products Market SIZE
      3. ESTIMATES & FORECAST, BY PACKAGING TYPE, 2019-2035 (USD Billions)
      4. \r\n\r\n\r\nCanada
    14. Bottled Water Products Market SIZE ESTIMATES & FORECAST, BY DISTRIBUTION CHANNEL,
      1. \r\n\r\n\r\nCanada Bottled Water Products
    15. Market SIZE ESTIMATES & FORECAST, BY END USER, 2019-2035 (USD Billions)
      1. \r\n\r\n\r\nCanada
    16. Bottled Water Products Market SIZE ESTIMATES & FORECAST, BY REGIONAL, 2019-2035
      1. (USD Billions)
      2. \r\n\r\n\r\nEurope Bottled Water Products Market SIZE
      3. ESTIMATES & FORECAST, BY TYPE, 2019-2035 (USD Billions)
      4. \r\n\r\n\r\nEurope
    17. Bottled Water Products Market SIZE ESTIMATES & FORECAST, BY PACKAGING TYPE,
      1. \r\n\r\n\r\nEurope Bottled Water Products
    18. Market SIZE ESTIMATES & FORECAST, BY DISTRIBUTION CHANNEL, 2019-2035 (USD Billions)
      1. \r\n\r\n\r\nEurope
    19. Bottled Water Products Market SIZE ESTIMATES & FORECAST, BY END USER, 2019-2035
      1. (USD Billions)
      2. \r\n\r\n\r\nEurope Bottled Water Products Market SIZE
      3. ESTIMATES & FORECAST, BY REGIONAL, 2019-2035 (USD Billions)
      4. \r\n\r\n\r\nGermany
    20. Bottled Water Products Market SIZE ESTIMATES & FORECAST, BY TYPE, 2019-2035
      1. (USD Billions)
      2. \r\n\r\n\r\nGermany Bottled Water Products Market
      3. SIZE ESTIMATES & FORECAST, BY PACKAGING TYPE, 2019-2035 (USD Billions)
      4. \r\n\r\n\r\nGermany
    21. Bottled Water Products Market SIZE ESTIMATES & FORECAST, BY DISTRIBUTION CHANNEL,
      1. \r\n\r\n\r\nGermany Bottled Water Products
    22. Market SIZE ESTIMATES & FORECAST, BY END USER, 2019-2035 (USD Billions)
      1. \r\n\r\n\r\nGermany
    23. Bottled Water Products Market SIZE ESTIMATES & FORECAST, BY REGIONAL, 2019-2035
      1. (USD Billions)
      2. \r\n\r\n\r\nUK Bottled Water Products Market SIZE
      3. ESTIMATES & FORECAST, BY TYPE, 2019-2035 (USD Billions)
      4. \r\n\r\n\r\nUK
    24. Bottled Water Products Market SIZE ESTIMATES & FORECAST, BY PACKAGING TYPE,
      1. \r\n\r\n\r\nUK Bottled Water Products Market
      2. SIZE ESTIMATES & FORECAST, BY DISTRIBUTION CHANNEL, 2019-2035 (USD Billions)
      3. \r\n\r\n\r\nUK
    25. Bottled Water Products Market SIZE ESTIMATES & FORECAST, BY END USER, 2019-2035
      1. (USD Billions)
      2. \r\n\r\n\r\nUK Bottled Water Products Market SIZE
      3. ESTIMATES & FORECAST, BY REGIONAL, 2019-2035 (USD Billions)
      4. \r\n\r\n\r\nFrance
    26. Bottled Water Products Market SIZE ESTIMATES & FORECAST, BY TYPE, 2019-2035
      1. (USD Billions)
      2. \r\n\r\n\r\nFrance Bottled Water Products Market SIZE
      3. ESTIMATES & FORECAST, BY PACKAGING TYPE, 2019-2035 (USD Billions)
      4. \r\n\r\n\r\nFrance
    27. Bottled Water Products Market SIZE ESTIMATES & FORECAST, BY DISTRIBUTION CHANNEL,
      1. \r\n\r\n\r\nFrance Bottled Water Products
    28. Market SIZE ESTIMATES & FORECAST, BY END USER, 2019-2035 (USD Billions)
      1. \r\n\r\n\r\nFrance
    29. Bottled Water Products Market SIZE ESTIMATES & FORECAST, BY REGIONAL, 2019-2035
      1. (USD Billions)
      2. \r\n\r\n\r\nRussia Bottled Water Products Market SIZE
      3. ESTIMATES & FORECAST, BY TYPE, 2019-2035 (USD Billions)
      4. \r\n\r\n\r\nRussia
    30. Bottled Water Products Market SIZE ESTIMATES & FORECAST, BY PACKAGING TYPE,
      1. \r\n\r\n\r\nRussia Bottled Water Products
    31. Market SIZE ESTIMATES & FORECAST, BY DISTRIBUTION CHANNEL, 2019-2035 (USD Billions)
      1. \r\n\r\n\r\nRussia
    32. Bottled Water Products Market SIZE ESTIMATES & FORECAST, BY END USER, 2019-2035
      1. (USD Billions)
      2. \r\n\r\n\r\nRussia Bottled Water Products Market SIZE
      3. ESTIMATES & FORECAST, BY REGIONAL, 2019-2035 (USD Billions)
      4. \r\n\r\n\r\nItaly
    33. Bottled Water Products Market SIZE ESTIMATES & FORECAST, BY TYPE, 2019-2035
      1. (USD Billions)
      2. \r\n\r\n\r\nItaly Bottled Water Products Market SIZE
      3. ESTIMATES & FORECAST, BY PACKAGING TYPE, 2019-2035 (USD Billions)
      4. \r\n\r\n\r\nItaly
    34. Bottled Water Products Market SIZE ESTIMATES & FORECAST, BY DISTRIBUTION CHANNEL,
      1. \r\n\r\n\r\nItaly Bottled Water Products
    35. Market SIZE ESTIMATES & FORECAST, BY END USER, 2019-2035 (USD Billions)
      1. \r\n\r\n\r\nItaly
    36. Bottled Water Products Market SIZE ESTIMATES & FORECAST, BY REGIONAL, 2019-2035
      1. (USD Billions)
      2. \r\n\r\n\r\nSpain Bottled Water Products Market SIZE
      3. ESTIMATES & FORECAST, BY TYPE, 2019-2035 (USD Billions)
      4. \r\n\r\n\r\nSpain
    37. Bottled Water Products Market SIZE ESTIMATES & FORECAST, BY PACKAGING TYPE,
      1. \r\n\r\n\r\nSpain Bottled Water Products
    38. Market SIZE ESTIMATES & FORECAST, BY DISTRIBUTION CHANNEL, 2019-2035 (USD Billions)
      1. \r\n\r\n\r\nSpain
    39. Bottled Water Products Market SIZE ESTIMATES & FORECAST, BY END USER, 2019-2035
      1. (USD Billions)
      2. \r\n\r\n\r\nSpain Bottled Water Products Market SIZE
      3. ESTIMATES & FORECAST, BY REGIONAL, 2019-2035 (USD Billions)
      4. \r\n\r\n\r\nRest
    40. of Europe Bottled Water Products Market SIZE ESTIMATES & FORECAST, BY TYPE,
      1. \r\n\r\n\r\nRest of Europe Bottled Water
    41. Products Market SIZE ESTIMATES & FORECAST, BY PACKAGING TYPE, 2019-2035 (USD
      1. Billions)
      2. \r\n\r\n\r\nRest of Europe Bottled Water Products Market
      3. SIZE ESTIMATES & FORECAST, BY DISTRIBUTION CHANNEL, 2019-2035 (USD Billions)
      4. \r\n\r\n\r\nRest
    42. of Europe Bottled Water Products Market SIZE ESTIMATES & FORECAST, BY END USER,
      1. \r\n\r\n\r\nRest of Europe Bottled Water
    43. Products Market SIZE ESTIMATES & FORECAST, BY REGIONAL, 2019-2035 (USD Billions)
      1. \r\n\r\n\r\nAPAC
    44. Bottled Water Products Market SIZE ESTIMATES & FORECAST, BY TYPE, 2019-2035
      1. (USD Billions)
      2. \r\n\r\n\r\nAPAC Bottled Water Products Market SIZE
      3. ESTIMATES & FORECAST, BY PACKAGING TYPE, 2019-2035 (USD Billions)
      4. \r\n\r\n\r\nAPAC
    45. Bottled Water Products Market SIZE ESTIMATES & FORECAST, BY DISTRIBUTION CHANNEL,
      1. \r\n\r\n\r\nAPAC Bottled Water Products
    46. Market SIZE ESTIMATES & FORECAST, BY END USER, 2019-2035 (USD Billions)
      1. \r\n\r\n\r\nAPAC
    47. Bottled Water Products Market SIZE ESTIMATES & FORECAST, BY REGIONAL, 2019-2035
      1. (USD Billions)
      2. \r\n\r\n\r\nChina Bottled Water Products Market SIZE
      3. ESTIMATES & FORECAST, BY TYPE, 2019-2035 (USD Billions)
      4. \r\n\r\n\r\nChina
    48. Bottled Water Products Market SIZE ESTIMATES & FORECAST, BY PACKAGING TYPE,
      1. \r\n\r\n\r\nChina Bottled Water Products
    49. Market SIZE ESTIMATES & FORECAST, BY DISTRIBUTION CHANNEL, 2019-2035 (USD Billions)
      1. \r\n\r\n\r\nChina
    50. Bottled Water Products Market SIZE ESTIMATES & FORECAST, BY END USER, 2019-2035
      1. (USD Billions)
      2. \r\n\r\n\r\nChina Bottled Water Products Market SIZE
      3. ESTIMATES & FORECAST, BY REGIONAL, 2019-2035 (USD Billions)
      4. \r\n\r\n\r\nIndia
    51. Bottled Water Products Market SIZE ESTIMATES & FORECAST, BY TYPE, 2019-2035
      1. (USD Billions)
      2. \r\n\r\n\r\nIndia Bottled Water Products Market SIZE
      3. ESTIMATES & FORECAST, BY PACKAGING TYPE, 2019-2035 (USD Billions)
      4. \r\n\r\n\r\nIndia
    52. Bottled Water Products Market SIZE ESTIMATES & FORECAST, BY DISTRIBUTION CHANNEL,
      1. \r\n\r\n\r\nIndia Bottled Water Products
    53. Market SIZE ESTIMATES & FORECAST, BY END USER, 2019-2035 (USD Billions)
      1. \r\n\r\n\r\nIndia
    54. Bottled Water Products Market SIZE ESTIMATES & FORECAST, BY REGIONAL, 2019-2035
      1. (USD Billions)
      2. \r\n\r\n\r\nJapan Bottled Water Products Market SIZE
      3. ESTIMATES & FORECAST, BY TYPE, 2019-2035 (USD Billions)
      4. \r\n\r\n\r\nJapan
    55. Bottled Water Products Market SIZE ESTIMATES & FORECAST, BY PACKAGING TYPE,
      1. \r\n\r\n\r\nJapan Bottled Water Products
    56. Market SIZE ESTIMATES & FORECAST, BY DISTRIBUTION CHANNEL, 2019-2035 (USD Billions)
      1. \r\n\r\n\r\nJapan
    57. Bottled Water Products Market SIZE ESTIMATES & FORECAST, BY END USER, 2019-2035
      1. (USD Billions)
      2. \r\n\r\n\r\nJapan Bottled Water Products Market SIZE
      3. ESTIMATES & FORECAST, BY REGIONAL, 2019-2035 (USD Billions)
      4. \r\n\r\n\r\nSouth
    58. Korea Bottled Water Products Market SIZE ESTIMATES & FORECAST, BY TYPE, 2019-2035
      1. (USD Billions)
      2. \r\n\r\n\r\nSouth Korea Bottled Water Products Market
      3. SIZE ESTIMATES & FORECAST, BY PACKAGING TYPE, 2019-2035 (USD Billions)
      4. \r\n\r\n\r\nSouth
    59. Korea Bottled Water Products Market SIZE ESTIMATES & FORECAST, BY DISTRIBUTION
      1. CHANNEL, 2019-2035 (USD Billions)
      2. \r\n\r\n\r\nSouth Korea Bottled
    60. Water Products Market SIZE ESTIMATES & FORECAST, BY END USER, 2019-2035 (USD
      1. Billions)
      2. \r\n\r\n\r\nSouth Korea Bottled Water Products Market SIZE
      3. ESTIMATES & FORECAST, BY REGIONAL, 2019-2035 (USD Billions)
      4. \r\n\r\n\r\nMalaysia
    61. Bottled Water Products Market SIZE ESTIMATES & FORECAST, BY TYPE, 2019-2035
      1. (USD Billions)
      2. \r\n\r\n\r\nMalaysia Bottled Water Products Market
      3. SIZE ESTIMATES & FORECAST, BY PACKAGING TYPE, 2019-2035 (USD Billions)
      4. \r\n\r\n\r\nMalaysia
    62. Bottled Water Products Market SIZE ESTIMATES & FORECAST, BY DISTRIBUTION CHANNEL,
      1. \r\n\r\n\r\nMalaysia Bottled Water Products
    63. Market SIZE ESTIMATES & FORECAST, BY END USER, 2019-2035 (USD Billions)
      1. \r\n\r\n\r\nMalaysia
    64. Bottled Water Products Market SIZE ESTIMATES & FORECAST, BY REGIONAL, 2019-2035
      1. (USD Billions)
      2. \r\n\r\n\r\nThailand Bottled Water Products Market
      3. SIZE ESTIMATES & FORECAST, BY TYPE, 2019-2035 (USD Billions)
      4. \r\n\r\n\r\nThailand
    65. Bottled Water Products Market SIZE ESTIMATES & FORECAST, BY PACKAGING TYPE,
      1. \r\n\r\n\r\nThailand Bottled Water Products
    66. Market SIZE ESTIMATES & FORECAST, BY DISTRIBUTION CHANNEL, 2019-2035 (USD Billions)
      1. \r\n\r\n\r\nThailand
    67. Bottled Water Products Market SIZE ESTIMATES & FORECAST, BY END USER, 2019-2035
      1. (USD Billions)
      2. \r\n\r\n\r\nThailand Bottled Water Products Market
      3. SIZE ESTIMATES & FORECAST, BY REGIONAL, 2019-2035 (USD Billions)
      4. \r\n\r\n\r\nIndonesia
    68. Bottled Water Products Market SIZE ESTIMATES & FORECAST, BY TYPE, 2019-2035
      1. (USD Billions)
      2. \r\n\r\n\r\nIndonesia Bottled Water Products Market
      3. SIZE ESTIMATES & FORECAST, BY PACKAGING TYPE, 2019-2035 (USD Billions)
      4. \r\n\r\n\r\nIndonesia
    69. Bottled Water Products Market SIZE ESTIMATES & FORECAST, BY DISTRIBUTION CHANNEL,
      1. \r\n\r\n\r\nIndonesia Bottled Water Products
    70. Market SIZE ESTIMATES & FORECAST, BY END USER, 2019-2035 (USD Billions)
      1. \r\n\r\n\r\nIndonesia
    71. Bottled Water Products Market SIZE ESTIMATES & FORECAST, BY REGIONAL, 2019-2035
      1. (USD Billions)
      2. \r\n\r\n\r\nRest of APAC Bottled Water Products Market
      3. SIZE ESTIMATES & FORECAST, BY TYPE, 2019-2035 (USD Billions)
      4. \r\n\r\n\r\nRest
    72. of APAC Bottled Water Products Market SIZE ESTIMATES & FORECAST, BY PACKAGING
      1. TYPE, 2019-2035 (USD Billions)
      2. \r\n\r\n\r\nRest of APAC Bottled Water
    73. Products Market SIZE ESTIMATES & FORECAST, BY DISTRIBUTION CHANNEL, 2019-2035
      1. (USD Billions)
      2. \r\n\r\n\r\nRest of APAC Bottled Water Products Market
      3. SIZE ESTIMATES & FORECAST, BY END USER, 2019-2035 (USD Billions)
      4. \r\n\r\n\r\nRest
    74. of APAC Bottled Water Products Market SIZE ESTIMATES & FORECAST, BY REGIONAL,
      1. \r\n\r\n\r\nSouth America Bottled Water
    75. Products Market SIZE ESTIMATES & FORECAST, BY TYPE, 2019-2035 (USD Billions)
      1. \r\n\r\n\r\nSouth
    76. America Bottled Water Products Market SIZE ESTIMATES & FORECAST, BY PACKAGING
      1. TYPE, 2019-2035 (USD Billions)
      2. \r\n\r\n\r\nSouth America Bottled
    77. Water Products Market SIZE ESTIMATES & FORECAST, BY DISTRIBUTION CHANNEL, 2019-2035
      1. (USD Billions)
      2. \r\n\r\n\r\nSouth America Bottled Water Products Market
      3. SIZE ESTIMATES & FORECAST, BY END USER, 2019-2035 (USD Billions)
      4. \r\n\r\n\r\nSouth
    78. America Bottled Water Products Market SIZE ESTIMATES & FORECAST, BY REGIONAL,
      1. \r\n\r\n\r\nBrazil Bottled Water Products
    79. Market SIZE ESTIMATES & FORECAST, BY TYPE, 2019-2035 (USD Billions)
      1. \r\n\r\n\r\nBrazil
    80. Bottled Water Products Market SIZE ESTIMATES & FORECAST, BY PACKAGING TYPE,
      1. \r\n\r\n\r\nBrazil Bottled Water Products
    81. Market SIZE ESTIMATES & FORECAST, BY DISTRIBUTION CHANNEL, 2019-2035 (USD Billions)
      1. \r\n\r\n\r\nBrazil
    82. Bottled Water Products Market SIZE ESTIMATES & FORECAST, BY END USER, 2019-2035
      1. (USD Billions)
      2. \r\n\r\n\r\nBrazil Bottled Water Products Market SIZE
      3. ESTIMATES & FORECAST, BY REGIONAL, 2019-2035 (USD Billions)
      4. \r\n\r\n\r\nMexico
    83. Bottled Water Products Market SIZE ESTIMATES & FORECAST, BY TYPE, 2019-2035
      1. (USD Billions)
      2. \r\n\r\n\r\nMexico Bottled Water Products Market SIZE
      3. ESTIMATES & FORECAST, BY PACKAGING TYPE, 2019-2035 (USD Billions)
      4. \r\n\r\n\r\nMexico
    84. Bottled Water Products Market SIZE ESTIMATES & FORECAST, BY DISTRIBUTION CHANNEL,
      1. \r\n\r\n\r\nMexico Bottled Water Products
    85. Market SIZE ESTIMATES & FORECAST, BY END USER, 2019-2035 (USD Billions)
      1. \r\n\r\n\r\nMexico
    86. Bottled Water Products Market SIZE ESTIMATES & FORECAST, BY REGIONAL, 2019-2035
      1. (USD Billions)
      2. \r\n\r\n\r\nArgentina Bottled Water Products Market
      3. SIZE ESTIMATES & FORECAST, BY TYPE, 2019-2035 (USD Billions)
      4. \r\n\r\n\r\nArgentina
    87. Bottled Water Products Market SIZE ESTIMATES & FORECAST, BY PACKAGING TYPE,
      1. \r\n\r\n\r\nArgentina Bottled Water Products
    88. Market SIZE ESTIMATES & FORECAST, BY DISTRIBUTION CHANNEL, 2019-2035 (USD Billions)
      1. \r\n\r\n\r\nArgentina
    89. Bottled Water Products Market SIZE ESTIMATES & FORECAST, BY END USER, 2019-2035
      1. (USD Billions)
      2. \r\n\r\n\r\nArgentina Bottled Water Products Market
      3. SIZE ESTIMATES & FORECAST, BY REGIONAL, 2019-2035 (USD Billions)
      4. \r\n\r\n\r\nRest
      5. of South America Bottled Water Products Market SIZE ESTIMATES & FORECAST, BY
      6. TYPE, 2019-2035 (USD Billions)
      7. \r\n\r\n\r\nRest of South America
    90. Bottled Water Products Market SIZE ESTIMATES & FORECAST, BY PACKAGING TYPE,
      1. \r\n\r\n\r\nRest of South America Bottled
    91. Water Products Market SIZE ESTIMATES & FORECAST, BY DISTRIBUTION CHANNEL, 2019-2035
      1. (USD Billions)
      2. \r\n\r\n\r\nRest of South America Bottled Water Products
    92. Market SIZE ESTIMATES & FORECAST, BY END USER, 2019-2035 (USD Billions)
      1. \r\n\r\n\r\nRest
      2. of South America Bottled Water Products Market SIZE ESTIMATES & FORECAST, BY
      3. REGIONAL, 2019-2035 (USD Billions)
      4. \r\n\r\n\r\nMEA Bottled Water
    93. Products Market SIZE ESTIMATES & FORECAST, BY TYPE, 2019-2035 (USD Billions)
      1. \r\n\r\n\r\nMEA
    94. Bottled Water Products Market SIZE ESTIMATES & FORECAST, BY PACKAGING TYPE,
      1. \r\n\r\n\r\nMEA Bottled Water Products Market
      2. SIZE ESTIMATES & FORECAST, BY DISTRIBUTION CHANNEL, 2019-2035 (USD Billions)
      3. \r\n\r\n\r\nMEA
    95. Bottled Water Products Market SIZE ESTIMATES & FORECAST, BY END USER, 2019-2035
      1. (USD Billions)
      2. \r\n\r\n\r\nMEA Bottled Water Products Market SIZE
      3. ESTIMATES & FORECAST, BY REGIONAL, 2019-2035 (USD Billions)
      4. \r\n\r\n\r\nGCC
    96. Countries Bottled Water Products Market SIZE ESTIMATES & FORECAST, BY TYPE,
      1. \r\n\r\n\r\nGCC Countries Bottled Water
    97. Products Market SIZE ESTIMATES & FORECAST, BY PACKAGING TYPE, 2019-2035 (USD
      1. Billions)
      2. \r\n\r\n\r\nGCC Countries Bottled Water Products Market
      3. SIZE ESTIMATES & FORECAST, BY DISTRIBUTION CHANNEL, 2019-2035 (USD Billions)
      4. \r\n\r\n\r\nGCC
    98. Countries Bottled Water Products Market SIZE ESTIMATES & FORECAST, BY END USER,
      1. \r\n\r\n\r\nGCC Countries Bottled Water
    99. Products Market SIZE ESTIMATES & FORECAST, BY REGIONAL, 2019-2035 (USD Billions)
      1. \r\n\r\n\r\nSouth
    100. Africa Bottled Water Products Market SIZE ESTIMATES & FORECAST, BY TYPE, 2019-2035
      1. (USD Billions)
      2. \r\n\r\n\r\nSouth Africa Bottled Water Products Market
      3. SIZE ESTIMATES & FORECAST, BY PACKAGING TYPE, 2019-2035 (USD Billions)
      4. \r\n\r\n\r\nSouth
    101. Africa Bottled Water Products Market SIZE ESTIMATES & FORECAST, BY DISTRIBUTION
      1. CHANNEL, 2019-2035 (USD Billions)
      2. \r\n\r\n\r\nSouth Africa Bottled
    102. Water Products Market SIZE ESTIMATES & FORECAST, BY END USER, 2019-2035 (USD
      1. Billions)
      2. \r\n\r\n\r\nSouth Africa Bottled Water Products Market
      3. SIZE ESTIMATES & FORECAST, BY REGIONAL, 2019-2035 (USD Billions)
      4. \r\n\r\n\r\nRest
    103. of MEA Bottled Water Products Market SIZE ESTIMATES & FORECAST, BY TYPE, 2019-2035
      1. (USD Billions)
      2. \r\n\r\n\r\nRest of MEA Bottled Water Products Market
      3. SIZE ESTIMATES & FORECAST, BY PACKAGING TYPE, 2019-2035 (USD Billions)
      4. \r\n\r\n\r\nRest
    104. of MEA Bottled Water Products Market SIZE ESTIMATES & FORECAST, BY DISTRIBUTION
      1. CHANNEL, 2019-2035 (USD Billions)
      2. \r\n\r\n\r\nRest of MEA Bottled
    105. Water Products Market SIZE ESTIMATES & FORECAST, BY END USER, 2019-2035 (USD
      1. Billions)
      2. \r\n\r\n\r\nRest of MEA Bottled Water Products Market SIZE
      3. ESTIMATES & FORECAST, BY REGIONAL, 2019-2035 (USD Billions)
      4. \r\n\r\n\r\nPRODUCT
      5. LAUNCH/PRODUCT DEVELOPMENT/APPROVAL
      6. \r\n\r\n\r\nACQUISITION/PARTNERSHIP
      7. \r\n\r\n\r\n
      8. \r\n
      9. \r\n
      10. \r\n
      11. \r\n
      12. \r\n
      13. \r\n
      14. \r\n
      15. \r\n
      16. \r\n
      17. \r\n
      18. \r\n
      19. \r\n
      20. \r\n
      21. \r\n
      22. \r\n
      23. \r\n
      24. \r\n
      25. \r\n
      26. \r\n
      27. \r\n
      28. \r\n
      29. \r\n
      30. \r\n
      31. \r\n
      32. \r\n
      33. \r\n
      34. \r\n
      35. \r\n
      36. \r\nLIST
      37. Of figures
      38. \r\n
      39. \r\n\r\n\r\nMARKET SYNOPSIS
      40. \r\n\r\n\r\nNORTH
    106. AMERICA BOTTLED WATER PRODUCTS MARKET ANALYSIS
      1. \r\n\r\n\r\nUS BOTTLED
      2. WATER PRODUCTS MARKET ANALYSIS BY TYPE
      3. \r\n\r\n\r\nUS BOTTLED WATER
      4. PRODUCTS MARKET ANALYSIS BY PACKAGING TYPE
      5. \r\n\r\n\r\nUS BOTTLED
      6. WATER PRODUCTS MARKET ANALYSIS BY DISTRIBUTION CHANNEL
      7. \r\n\r\n\r\nUS
      8. BOTTLED WATER PRODUCTS MARKET ANALYSIS BY END USER
      9. \r\n\r\n\r\nUS
      10. BOTTLED WATER PRODUCTS MARKET ANALYSIS BY REGIONAL
      11. \r\n\r\n\r\nCANADA
      12. BOTTLED WATER PRODUCTS MARKET ANALYSIS BY TYPE
      13. \r\n\r\n\r\nCANADA
      14. BOTTLED WATER PRODUCTS MARKET ANALYSIS BY PACKAGING TYPE
      15. \r\n\r\n\r\nCANADA
      16. BOTTLED WATER PRODUCTS MARKET ANALYSIS BY DISTRIBUTION CHANNEL
      17. \r\n\r\n\r\nCANADA
      18. BOTTLED WATER PRODUCTS MARKET ANALYSIS BY END USER
      19. \r\n\r\n\r\nCANADA
      20. BOTTLED WATER PRODUCTS MARKET ANALYSIS BY REGIONAL
      21. \r\n\r\n\r\nEUROPE
    107. BOTTLED WATER PRODUCTS MARKET ANALYSIS
      1. \r\n\r\n\r\nGERMANY BOTTLED
      2. WATER PRODUCTS MARKET ANALYSIS BY TYPE
      3. \r\n\r\n\r\nGERMANY BOTTLED
      4. WATER PRODUCTS MARKET ANALYSIS BY PACKAGING TYPE
      5. \r\n\r\n\r\nGERMANY
      6. BOTTLED WATER PRODUCTS MARKET ANALYSIS BY DISTRIBUTION CHANNEL
      7. \r\n\r\n\r\nGERMANY
      8. BOTTLED WATER PRODUCTS MARKET ANALYSIS BY END USER
      9. \r\n\r\n\r\nGERMANY
      10. BOTTLED WATER PRODUCTS MARKET ANALYSIS BY REGIONAL
      11. \r\n\r\n\r\nUK
      12. BOTTLED WATER PRODUCTS MARKET ANALYSIS BY TYPE
      13. \r\n\r\n\r\nUK BOTTLED
      14. WATER PRODUCTS MARKET ANALYSIS BY PACKAGING TYPE
      15. \r\n\r\n\r\nUK BOTTLED
      16. WATER PRODUCTS MARKET ANALYSIS BY DISTRIBUTION CHANNEL
      17. \r\n\r\n\r\nUK
      18. BOTTLED WATER PRODUCTS MARKET ANALYSIS BY END USER
      19. \r\n\r\n\r\nUK
      20. BOTTLED WATER PRODUCTS MARKET ANALYSIS BY REGIONAL
      21. \r\n\r\n\r\nFRANCE
      22. BOTTLED WATER PRODUCTS MARKET ANALYSIS BY TYPE
      23. \r\n\r\n\r\nFRANCE
      24. BOTTLED WATER PRODUCTS MARKET ANALYSIS BY PACKAGING TYPE
      25. \r\n\r\n\r\nFRANCE
      26. BOTTLED WATER PRODUCTS MARKET ANALYSIS BY DISTRIBUTION CHANNEL
      27. \r\n\r\n\r\nFRANCE
      28. BOTTLED WATER PRODUCTS MARKET ANALYSIS BY END USER
      29. \r\n\r\n\r\nFRANCE
      30. BOTTLED WATER PRODUCTS MARKET ANALYSIS BY REGIONAL
      31. \r\n\r\n\r\nRUSSIA
      32. BOTTLED WATER PRODUCTS MARKET ANALYSIS BY TYPE
      33. \r\n\r\n\r\nRUSSIA
      34. BOTTLED WATER PRODUCTS MARKET ANALYSIS BY PACKAGING TYPE
      35. \r\n\r\n\r\nRUSSIA
      36. BOTTLED WATER PRODUCTS MARKET ANALYSIS BY DISTRIBUTION CHANNEL
      37. \r\n\r\n\r\nRUSSIA
      38. BOTTLED WATER PRODUCTS MARKET ANALYSIS BY END USER
      39. \r\n\r\n\r\nRUSSIA
      40. BOTTLED WATER PRODUCTS MARKET ANALYSIS BY REGIONAL
      41. \r\n\r\n\r\nITALY
      42. BOTTLED WATER PRODUCTS MARKET ANALYSIS BY TYPE
      43. \r\n\r\n\r\nITALY
      44. BOTTLED WATER PRODUCTS MARKET ANALYSIS BY PACKAGING TYPE
      45. \r\n\r\n\r\nITALY
      46. BOTTLED WATER PRODUCTS MARKET ANALYSIS BY DISTRIBUTION CHANNEL
      47. \r\n\r\n\r\nITALY
      48. BOTTLED WATER PRODUCTS MARKET ANALYSIS BY END USER
      49. \r\n\r\n\r\nITALY
      50. BOTTLED WATER PRODUCTS MARKET ANALYSIS BY REGIONAL
      51. \r\n\r\n\r\nSPAIN
      52. BOTTLED WATER PRODUCTS MARKET ANALYSIS BY TYPE
      53. \r\n\r\n\r\nSPAIN
      54. BOTTLED WATER PRODUCTS MARKET ANALYSIS BY PACKAGING TYPE
      55. \r\n\r\n\r\nSPAIN
      56. BOTTLED WATER PRODUCTS MARKET ANALYSIS BY DISTRIBUTION CHANNEL
      57. \r\n\r\n\r\nSPAIN
      58. BOTTLED WATER PRODUCTS MARKET ANALYSIS BY END USER
      59. \r\n\r\n\r\nSPAIN
      60. BOTTLED WATER PRODUCTS MARKET ANALYSIS BY REGIONAL
      61. \r\n\r\n\r\nREST
      62. OF EUROPE BOTTLED WATER PRODUCTS MARKET ANALYSIS BY TYPE
      63. \r\n\r\n\r\nREST
      64. OF EUROPE BOTTLED WATER PRODUCTS MARKET ANALYSIS BY PACKAGING TYPE
      65. \r\n\r\n\r\nREST
      66. OF EUROPE BOTTLED WATER PRODUCTS MARKET ANALYSIS BY DISTRIBUTION CHANNEL
      67. \r\n\r\n\r\nREST
      68. OF EUROPE BOTTLED WATER PRODUCTS MARKET ANALYSIS BY END USER
      69. \r\n\r\n\r\nREST
      70. OF EUROPE BOTTLED WATER PRODUCTS MARKET ANALYSIS BY REGIONAL
      71. \r\n\r\n\r\nAPAC
    108. BOTTLED WATER PRODUCTS MARKET ANALYSIS
      1. \r\n\r\n\r\nCHINA BOTTLED
      2. WATER PRODUCTS MARKET ANALYSIS BY TYPE
      3. \r\n\r\n\r\nCHINA BOTTLED
      4. WATER PRODUCTS MARKET ANALYSIS BY PACKAGING TYPE
      5. \r\n\r\n\r\nCHINA
      6. BOTTLED WATER PRODUCTS MARKET ANALYSIS BY DISTRIBUTION CHANNEL
      7. \r\n\r\n\r\nCHINA
      8. BOTTLED WATER PRODUCTS MARKET ANALYSIS BY END USER
      9. \r\n\r\n\r\nCHINA
      10. BOTTLED WATER PRODUCTS MARKET ANALYSIS BY REGIONAL
      11. \r\n\r\n\r\nINDIA
      12. BOTTLED WATER PRODUCTS MARKET ANALYSIS BY TYPE
      13. \r\n\r\n\r\nINDIA
      14. BOTTLED WATER PRODUCTS MARKET ANALYSIS BY PACKAGING TYPE
      15. \r\n\r\n\r\nINDIA
      16. BOTTLED WATER PRODUCTS MARKET ANALYSIS BY DISTRIBUTION CHANNEL
      17. \r\n\r\n\r\nINDIA
      18. BOTTLED WATER PRODUCTS MARKET ANALYSIS BY END USER
      19. \r\n\r\n\r\nINDIA
      20. BOTTLED WATER PRODUCTS MARKET ANALYSIS BY REGIONAL
      21. \r\n\r\n\r\nJAPAN
      22. BOTTLED WATER PRODUCTS MARKET ANALYSIS BY TYPE
      23. \r\n\r\n\r\nJAPAN
      24. BOTTLED WATER PRODUCTS MARKET ANALYSIS BY PACKAGING TYPE
      25. \r\n\r\n\r\nJAPAN
      26. BOTTLED WATER PRODUCTS MARKET ANALYSIS BY DISTRIBUTION CHANNEL
      27. \r\n\r\n\r\nJAPAN
      28. BOTTLED WATER PRODUCTS MARKET ANALYSIS BY END USER
      29. \r\n\r\n\r\nJAPAN
      30. BOTTLED WATER PRODUCTS MARKET ANALYSIS BY REGIONAL
      31. \r\n\r\n\r\nSOUTH
      32. KOREA BOTTLED WATER PRODUCTS MARKET ANALYSIS BY TYPE
      33. \r\n\r\n\r\nSOUTH
      34. KOREA BOTTLED WATER PRODUCTS MARKET ANALYSIS BY PACKAGING TYPE
      35. \r\n\r\n\r\nSOUTH
      36. KOREA BOTTLED WATER PRODUCTS MARKET ANALYSIS BY DISTRIBUTION CHANNEL
      37. \r\n\r\n\r\nSOUTH
      38. KOREA BOTTLED WATER PRODUCTS MARKET ANALYSIS BY END USER
      39. \r\n\r\n\r\nSOUTH
      40. KOREA BOTTLED WATER PRODUCTS MARKET ANALYSIS BY REGIONAL
      41. \r\n\r\n\r\nMALAYSIA
      42. BOTTLED WATER PRODUCTS MARKET ANALYSIS BY TYPE
      43. \r\n\r\n\r\nMALAYSIA
      44. BOTTLED WATER PRODUCTS MARKET ANALYSIS BY PACKAGING TYPE
      45. \r\n\r\n\r\nMALAYSIA
      46. BOTTLED WATER PRODUCTS MARKET ANALYSIS BY DISTRIBUTION CHANNEL
      47. \r\n\r\n\r\nMALAYSIA
      48. BOTTLED WATER PRODUCTS MARKET ANALYSIS BY END USER
      49. \r\n\r\n\r\nMALAYSIA
      50. BOTTLED WATER PRODUCTS MARKET ANALYSIS BY REGIONAL
      51. \r\n\r\n\r\nTHAILAND
      52. BOTTLED WATER PRODUCTS MARKET ANALYSIS BY TYPE
      53. \r\n\r\n\r\nTHAILAND
      54. BOTTLED WATER PRODUCTS MARKET ANALYSIS BY PACKAGING TYPE
      55. \r\n\r\n\r\nTHAILAND
      56. BOTTLED WATER PRODUCTS MARKET ANALYSIS BY DISTRIBUTION CHANNEL
      57. \r\n\r\n\r\nTHAILAND
      58. BOTTLED WATER PRODUCTS MARKET ANALYSIS BY END USER
      59. \r\n\r\n\r\nTHAILAND
      60. BOTTLED WATER PRODUCTS MARKET ANALYSIS BY REGIONAL
      61. \r\n\r\n\r\nINDONESIA
      62. BOTTLED WATER PRODUCTS MARKET ANALYSIS BY TYPE
      63. \r\n\r\n\r\nINDONESIA
      64. BOTTLED WATER PRODUCTS MARKET ANALYSIS BY PACKAGING TYPE
      65. \r\n\r\n\r\nINDONESIA
      66. BOTTLED WATER PRODUCTS MARKET ANALYSIS BY DISTRIBUTION CHANNEL
      67. \r\n\r\n\r\nINDONESIA
      68. BOTTLED WATER PRODUCTS MARKET ANALYSIS BY END USER
      69. \r\n\r\n\r\nINDONESIA
      70. BOTTLED WATER PRODUCTS MARKET ANALYSIS BY REGIONAL
      71. \r\n\r\n\r\nREST
      72. OF APAC BOTTLED WATER PRODUCTS MARKET ANALYSIS BY TYPE
      73. \r\n\r\n\r\nREST
      74. OF APAC BOTTLED WATER PRODUCTS MARKET ANALYSIS BY PACKAGING TYPE
      75. \r\n\r\n\r\nREST
      76. OF APAC BOTTLED WATER PRODUCTS MARKET ANALYSIS BY DISTRIBUTION CHANNEL
      77. \r\n\r\n\r\nREST
      78. OF APAC BOTTLED WATER PRODUCTS MARKET ANALYSIS BY END USER
      79. \r\n\r\n\r\nREST
      80. OF APAC BOTTLED WATER PRODUCTS MARKET ANALYSIS BY REGIONAL
      81. \r\n\r\n\r\nSOUTH
    109. AMERICA BOTTLED WATER PRODUCTS MARKET ANALYSIS
      1. \r\n\r\n\r\nBRAZIL
      2. BOTTLED WATER PRODUCTS MARKET ANALYSIS BY TYPE
      3. \r\n\r\n\r\nBRAZIL
      4. BOTTLED WATER PRODUCTS MARKET ANALYSIS BY PACKAGING TYPE
      5. \r\n\r\n\r\nBRAZIL
      6. BOTTLED WATER PRODUCTS MARKET ANALYSIS BY DISTRIBUTION CHANNEL
      7. \r\n\r\n\r\nBRAZIL
      8. BOTTLED WATER PRODUCTS MARKET ANALYSIS BY END USER
      9. \r\n\r\n\r\nBRAZIL
      10. BOTTLED WATER PRODUCTS MARKET ANALYSIS BY REGIONAL
      11. \r\n\r\n\r\nMEXICO
      12. BOTTLED WATER PRODUCTS MARKET ANALYSIS BY TYPE
      13. \r\n\r\n\r\nMEXICO
      14. BOTTLED WATER PRODUCTS MARKET ANALYSIS BY PACKAGING TYPE
      15. \r\n\r\n\r\nMEXICO
      16. BOTTLED WATER PRODUCTS MARKET ANALYSIS BY DISTRIBUTION CHANNEL
      17. \r\n\r\n\r\nMEXICO
      18. BOTTLED WATER PRODUCTS MARKET ANALYSIS BY END USER
      19. \r\n\r\n\r\nMEXICO
      20. BOTTLED WATER PRODUCTS MARKET ANALYSIS BY REGIONAL
      21. \r\n\r\n\r\nARGENTINA
      22. BOTTLED WATER PRODUCTS MARKET ANALYSIS BY TYPE
      23. \r\n\r\n\r\nARGENTINA
      24. BOTTLED WATER PRODUCTS MARKET ANALYSIS BY PACKAGING TYPE
      25. \r\n\r\n\r\nARGENTINA
      26. BOTTLED WATER PRODUCTS MARKET ANALYSIS BY DISTRIBUTION CHANNEL
      27. \r\n\r\n\r\nARGENTINA
      28. BOTTLED WATER PRODUCTS MARKET ANALYSIS BY END USER
      29. \r\n\r\n\r\nARGENTINA
      30. BOTTLED WATER PRODUCTS MARKET ANALYSIS BY REGIONAL
      31. \r\n\r\n\r\nREST
      32. OF SOUTH AMERICA BOTTLED WATER PRODUCTS MARKET ANALYSIS BY TYPE
      33. \r\n\r\n\r\nREST
      34. OF SOUTH AMERICA BOTTLED WATER PRODUCTS MARKET ANALYSIS BY PACKAGING TYPE
      35. \r\n\r\n\r\nREST
      36. OF SOUTH AMERICA BOTTLED WATER PRODUCTS MARKET ANALYSIS BY DISTRIBUTION CHANNEL
      37. \r\n\r\n\r\nREST
      38. OF SOUTH AMERICA BOTTLED WATER PRODUCTS MARKET ANALYSIS BY END USER
      39. \r\n\r\n\r\nREST
      40. OF SOUTH AMERICA BOTTLED WATER PRODUCTS MARKET ANALYSIS BY REGIONAL
      41. \r\n\r\n\r\nMEA
    110. BOTTLED WATER PRODUCTS MARKET ANALYSIS
      1. \r\n\r\n\r\nGCC COUNTRIES
      2. BOTTLED WATER PRODUCTS MARKET ANALYSIS BY TYPE
      3. \r\n\r\n\r\nGCC COUNTRIES
      4. BOTTLED WATER PRODUCTS MARKET ANALYSIS BY PACKAGING TYPE
      5. \r\n\r\n\r\nGCC
      6. COUNTRIES BOTTLED WATER PRODUCTS MARKET ANALYSIS BY DISTRIBUTION CHANNEL
      7. \r\n\r\n\r\nGCC
      8. COUNTRIES BOTTLED WATER PRODUCTS MARKET ANALYSIS BY END USER
      9. \r\n\r\n\r\nGCC
      10. COUNTRIES BOTTLED WATER PRODUCTS MARKET ANALYSIS BY REGIONAL
      11. \r\n\r\n\r\nSOUTH
      12. AFRICA BOTTLED WATER PRODUCTS MARKET ANALYSIS BY TYPE
      13. \r\n\r\n\r\nSOUTH
      14. AFRICA BOTTLED WATER PRODUCTS MARKET ANALYSIS BY PACKAGING TYPE
      15. \r\n\r\n\r\nSOUTH
      16. AFRICA BOTTLED WATER PRODUCTS MARKET ANALYSIS BY DISTRIBUTION CHANNEL
      17. \r\n\r\n\r\nSOUTH
      18. AFRICA BOTTLED WATER PRODUCTS MARKET ANALYSIS BY END USER
      19. \r\n\r\n\r\nSOUTH
      20. AFRICA BOTTLED WATER PRODUCTS MARKET ANALYSIS BY REGIONAL
      21. \r\n\r\n\r\nREST
      22. OF MEA BOTTLED WATER PRODUCTS MARKET ANALYSIS BY TYPE
      23. \r\n\r\n\r\nREST
      24. OF MEA BOTTLED WATER PRODUCTS MARKET ANALYSIS BY PACKAGING TYPE
      25. \r\n\r\n\r\nREST
      26. OF MEA BOTTLED WATER PRODUCTS MARKET ANALYSIS BY DISTRIBUTION CHANNEL
      27. \r\n\r\n\r\nREST
      28. OF MEA BOTTLED WATER PRODUCTS MARKET ANALYSIS BY END USER
      29. \r\n\r\n\r\nREST
      30. OF MEA BOTTLED WATER PRODUCTS MARKET ANALYSIS BY REGIONAL
      31. \r\n\r\n\r\nKEY
    111. BUYING CRITERIA OF BOTTLED WATER PRODUCTS MARKET
      1. \r\n\r\n\r\nRESEARCH
      2. PROCESS OF MRFR
      3. \r\n\r\n\r\nDRO ANALYSIS OF BOTTLED WATER PRODUCTS
      4. MARKET
      5. \r\n\r\n\r\nDRIVERS IMPACT ANALYSIS: BOTTLED WATER PRODUCTS
      6. MARKET
      7. \r\n\r\n\r\nRESTRAINTS IMPACT ANALYSIS: BOTTLED WATER PRODUCTS
      8. MARKET
      9. \r\n\r\n\r\nSUPPLY / VALUE CHAIN: BOTTLED WATER PRODUCTS MARKET
      10. \r\n\r\n\r\nBOTTLED
    112. WATER PRODUCTS MARKET, BY TYPE, 2025 (% SHARE)
      1. \r\n\r\n\r\nBOTTLED
    113. WATER PRODUCTS MARKET, BY TYPE, 2019 TO 2035 (USD Billions)
      1. \r\n\r\n\r\nBOTTLED
    114. WATER PRODUCTS MARKET, BY PACKAGING TYPE, 2025 (% SHARE)
      1. \r\n\r\n\r\nBOTTLED
    115. WATER PRODUCTS MARKET, BY PACKAGING TYPE, 2019 TO 2035 (USD Billions)
      1. \r\n\r\n\r\nBOTTLED
    116. WATER PRODUCTS MARKET, BY DISTRIBUTION CHANNEL, 2025 (% SHARE)
      1. \r\n\r\n\r\nBOTTLED
    117. WATER PRODUCTS MARKET, BY DISTRIBUTION CHANNEL, 2019 TO 2035 (USD Billions)
      1. \r\n\r\n\r\nBOTTLED
    118. WATER PRODUCTS MARKET, BY END USER, 2025 (% SHARE)
      1. \r\n\r\n\r\nBOTTLED
    119. WATER PRODUCTS MARKET, BY END USER, 2019 TO 2035 (USD Billions)
      1. \r\n\r\n\r\nBOTTLED
    120. WATER PRODUCTS MARKET, BY REGIONAL, 2025 (% SHARE)
      1. \r\n\r\n\r\nBOTTLED
    121. WATER PRODUCTS MARKET, BY REGIONAL, 2019 TO 2035 (USD Billions)
      1. \r\n\r\n\r\nBENCHMARKING
      2. OF MAJOR COMPETITORS
      3. \r\n\r\n\r\n

    Bottled Water Products Market Segmentation


    • Bottled Water Products Market By Type (USD Billion, 2019-2035)

      • Spring Water
      • Mineral Water
      • Purified Water
      • Sparkling Water
      • Flavored Water


    • Bottled Water Products Market By Packaging Type (USD Billion, 2019-2035)

      • PET Bottles
      • Glass Bottles
      • Cartons
      • Kegs
      • Pouches


    • Bottled Water Products Market By Distribution Channel (USD Billion, 2019-2035)

      • Supermarkets/Hypermarkets
      • Convenience Stores
      • Online Retail
      • Restaurants/Cafes
      • Health Food Stores


    • Bottled Water Products Market By End User (USD Billion, 2019-2035)

      • Residential
      • Commercial
      • Institutional


    • Bottled Water Products Market By Regional (USD Billion, 2019-2035)

      • North America
      • Europe
      • South America
      • Asia Pacific
      • Middle East and Africa


    Bottled Water Products Market Regional Outlook (USD Billion, 2019-2035)


    • North America Outlook (USD Billion, 2019-2035)

      • North America Bottled Water Products Market by Type

        • Spring Water
        • Mineral Water
        • Purified Water
        • Sparkling Water
        • Flavored Water
      • North America Bottled Water Products Market by Packaging Type

        • PET Bottles
        • Glass Bottles
        • Cartons
        • Kegs
        • Pouches
      • North America Bottled Water Products Market by Distribution Channel Type

        • Supermarkets/Hypermarkets
        • Convenience Stores
        • Online Retail
        • Restaurants/Cafes
        • Health Food Stores
      • North America Bottled Water Products Market by End User Type

        • Residential
        • Commercial
        • Institutional
      • North America Bottled Water Products Market by Regional Type

        • US
        • Canada
      • US Outlook (USD Billion, 2019-2035)
      • US Bottled Water Products Market by Type

        • Spring Water
        • Mineral Water
        • Purified Water
        • Sparkling Water
        • Flavored Water
      • US Bottled Water Products Market by Packaging Type

        • PET Bottles
        • Glass Bottles
        • Cartons
        • Kegs
        • Pouches
      • US Bottled Water Products Market by Distribution Channel Type

        • Supermarkets/Hypermarkets
        • Convenience Stores
        • Online Retail
        • Restaurants/Cafes
        • Health Food Stores
      • US Bottled Water Products Market by End User Type

        • Residential
        • Commercial
        • Institutional
      • CANADA Outlook (USD Billion, 2019-2035)
      • CANADA Bottled Water Products Market by Type

        • Spring Water
        • Mineral Water
        • Purified Water
        • Sparkling Water
        • Flavored Water
      • CANADA Bottled Water Products Market by Packaging Type

        • PET Bottles
        • Glass Bottles
        • Cartons
        • Kegs
        • Pouches
      • CANADA Bottled Water Products Market by Distribution Channel Type

        • Supermarkets/Hypermarkets
        • Convenience Stores
        • Online Retail
        • Restaurants/Cafes
        • Health Food Stores
      • CANADA Bottled Water Products Market by End User Type

        • Residential
        • Commercial
        • Institutional
    • Europe Outlook (USD Billion, 2019-2035)

      • Europe Bottled Water Products Market by Type

        • Spring Water
        • Mineral Water
        • Purified Water
        • Sparkling Water
        • Flavored Water
      • Europe Bottled Water Products Market by Packaging Type

        • PET Bottles
        • Glass Bottles
        • Cartons
        • Kegs
        • Pouches
      • Europe Bottled Water Products Market by Distribution Channel Type

        • Supermarkets/Hypermarkets
        • Convenience Stores
        • Online Retail
        • Restaurants/Cafes
        • Health Food Stores
      • Europe Bottled Water Products Market by End User Type

        • Residential
        • Commercial
        • Institutional
      • Europe Bottled Water Products Market by Regional Type

        • Germany
        • UK
        • France
        • Russia
        • Italy
        • Spain
        • Rest of Europe
      • GERMANY Outlook (USD Billion, 2019-2035)
      • GERMANY Bottled Water Products Market by Type

        • Spring Water
        • Mineral Water
        • Purified Water
        • Sparkling Water
        • Flavored Water
      • GERMANY Bottled Water Products Market by Packaging Type

        • PET Bottles
        • Glass Bottles
        • Cartons
        • Kegs
        • Pouches
      • GERMANY Bottled Water Products Market by Distribution Channel Type

        • Supermarkets/Hypermarkets
        • Convenience Stores
        • Online Retail
        • Restaurants/Cafes
        • Health Food Stores
      • GERMANY Bottled Water Products Market by End User Type

        • Residential
        • Commercial
        • Institutional
      • UK Outlook (USD Billion, 2019-2035)
      • UK Bottled Water Products Market by Type

        • Spring Water
        • Mineral Water
        • Purified Water
        • Sparkling Water
        • Flavored Water
      • UK Bottled Water Products Market by Packaging Type

        • PET Bottles
        • Glass Bottles
        • Cartons
        • Kegs
        • Pouches
      • UK Bottled Water Products Market by Distribution Channel Type

        • Supermarkets/Hypermarkets
        • Convenience Stores
        • Online Retail
        • Restaurants/Cafes
        • Health Food Stores
      • UK Bottled Water Products Market by End User Type

        • Residential
        • Commercial
        • Institutional
      • FRANCE Outlook (USD Billion, 2019-2035)
      • FRANCE Bottled Water Products Market by Type

        • Spring Water
        • Mineral Water
        • Purified Water
        • Sparkling Water
        • Flavored Water
      • FRANCE Bottled Water Products Market by Packaging Type

        • PET Bottles
        • Glass Bottles
        • Cartons
        • Kegs
        • Pouches
      • FRANCE Bottled Water Products Market by Distribution Channel Type

        • Supermarkets/Hypermarkets
        • Convenience Stores
        • Online Retail
        • Restaurants/Cafes
        • Health Food Stores
      • FRANCE Bottled Water Products Market by End User Type

        • Residential
        • Commercial
        • Institutional
      • RUSSIA Outlook (USD Billion, 2019-2035)
      • RUSSIA Bottled Water Products Market by Type

        • Spring Water
        • Mineral Water
        • Purified Water
        • Sparkling Water
        • Flavored Water
      • RUSSIA Bottled Water Products Market by Packaging Type

        • PET Bottles
        • Glass Bottles
        • Cartons
        • Kegs
        • Pouches
      • RUSSIA Bottled Water Products Market by Distribution Channel Type

        • Supermarkets/Hypermarkets
        • Convenience Stores
        • Online Retail
        • Restaurants/Cafes
        • Health Food Stores
      • RUSSIA Bottled Water Products Market by End User Type

        • Residential
        • Commercial
        • Institutional
      • ITALY Outlook (USD Billion, 2019-2035)
      • ITALY Bottled Water Products Market by Type

        • Spring Water
        • Mineral Water
        • Purified Water
        • Sparkling Water
        • Flavored Water
      • ITALY Bottled Water Products Market by Packaging Type

        • PET Bottles
        • Glass Bottles
        • Cartons
        • Kegs
        • Pouches
      • ITALY Bottled Water Products Market by Distribution Channel Type

        • Supermarkets/Hypermarkets
        • Convenience Stores
        • Online Retail
        • Restaurants/Cafes
        • Health Food Stores
      • ITALY Bottled Water Products Market by End User Type

        • Residential
        • Commercial
        • Institutional
      • SPAIN Outlook (USD Billion, 2019-2035)
      • SPAIN Bottled Water Products Market by Type

        • Spring Water
        • Mineral Water
        • Purified Water
        • Sparkling Water
        • Flavored Water
      • SPAIN Bottled Water Products Market by Packaging Type

        • PET Bottles
        • Glass Bottles
        • Cartons
        • Kegs
        • Pouches
      • SPAIN Bottled Water Products Market by Distribution Channel Type

        • Supermarkets/Hypermarkets
        • Convenience Stores
        • Online Retail
        • Restaurants/Cafes
        • Health Food Stores
      • SPAIN Bottled Water Products Market by End User Type

        • Residential
        • Commercial
        • Institutional
      • REST OF EUROPE Outlook (USD Billion, 2019-2035)
      • REST OF EUROPE Bottled Water Products Market by Type

        • Spring Water
        • Mineral Water
        • Purified Water
        • Sparkling Water
        • Flavored Water
      • REST OF EUROPE Bottled Water Products Market by Packaging Type

        • PET Bottles
        • Glass Bottles
        • Cartons
        • Kegs
        • Pouches
      • REST OF EUROPE Bottled Water Products Market by Distribution Channel Type

        • Supermarkets/Hypermarkets
        • Convenience Stores
        • Online Retail
        • Restaurants/Cafes
        • Health Food Stores
      • REST OF EUROPE Bottled Water Products Market by End User Type

        • Residential
        • Commercial
        • Institutional
    • APAC Outlook (USD Billion, 2019-2035)

      • APAC Bottled Water Products Market by Type

        • Spring Water
        • Mineral Water
        • Purified Water
        • Sparkling Water
        • Flavored Water
      • APAC Bottled Water Products Market by Packaging Type

        • PET Bottles
        • Glass Bottles
        • Cartons
        • Kegs
        • Pouches
      • APAC Bottled Water Products Market by Distribution Channel Type

        • Supermarkets/Hypermarkets
        • Convenience Stores
        • Online Retail
        • Restaurants/Cafes
        • Health Food Stores
      • APAC Bottled Water Products Market by End User Type

        • Residential
        • Commercial
        • Institutional
      • APAC Bottled Water Products Market by Regional Type

        • China
        • India
        • Japan
        • South Korea
        • Malaysia
        • Thailand
        • Indonesia
        • Rest of APAC
      • CHINA Outlook (USD Billion, 2019-2035)
      • CHINA Bottled Water Products Market by Type

        • Spring Water
        • Mineral Water
        • Purified Water
        • Sparkling Water
        • Flavored Water
      • CHINA Bottled Water Products Market by Packaging Type

        • PET Bottles
        • Glass Bottles
        • Cartons
        • Kegs
        • Pouches
      • CHINA Bottled Water Products Market by Distribution Channel Type

        • Supermarkets/Hypermarkets
        • Convenience Stores
        • Online Retail
        • Restaurants/Cafes
        • Health Food Stores
      • CHINA Bottled Water Products Market by End User Type

        • Residential
        • Commercial
        • Institutional
      • INDIA Outlook (USD Billion, 2019-2035)
      • INDIA Bottled Water Products Market by Type

        • Spring Water
        • Mineral Water
        • Purified Water
        • Sparkling Water
        • Flavored Water
      • INDIA Bottled Water Products Market by Packaging Type

        • PET Bottles
        • Glass Bottles
        • Cartons
        • Kegs
        • Pouches
      • INDIA Bottled Water Products Market by Distribution Channel Type

        • Supermarkets/Hypermarkets
        • Convenience Stores
        • Online Retail
        • Restaurants/Cafes
        • Health Food Stores
      • INDIA Bottled Water Products Market by End User Type

        • Residential
        • Commercial
        • Institutional
      • JAPAN Outlook (USD Billion, 2019-2035)
      • JAPAN Bottled Water Products Market by Type

        • Spring Water
        • Mineral Water
        • Purified Water
        • Sparkling Water
        • Flavored Water
      • JAPAN Bottled Water Products Market by Packaging Type

        • PET Bottles
        • Glass Bottles
        • Cartons
        • Kegs
        • Pouches
      • JAPAN Bottled Water Products Market by Distribution Channel Type

        • Supermarkets/Hypermarkets
        • Convenience Stores
        • Online Retail
        • Restaurants/Cafes
        • Health Food Stores
      • JAPAN Bottled Water Products Market by End User Type

        • Residential
        • Commercial
        • Institutional
      • SOUTH KOREA Outlook (USD Billion, 2019-2035)
      • SOUTH KOREA Bottled Water Products Market by Type

        • Spring Water
        • Mineral Water
        • Purified Water
        • Sparkling Water
        • Flavored Water
      • SOUTH KOREA Bottled Water Products Market by Packaging Type

        • PET Bottles
        • Glass Bottles
        • Cartons
        • Kegs
        • Pouches
      • SOUTH KOREA Bottled Water Products Market by Distribution Channel Type

        • Supermarkets/Hypermarkets
        • Convenience Stores
        • Online Retail
        • Restaurants/Cafes
        • Health Food Stores
      • SOUTH KOREA Bottled Water Products Market by End User Type

        • Residential
        • Commercial
        • Institutional
      • MALAYSIA Outlook (USD Billion, 2019-2035)
      • MALAYSIA Bottled Water Products Market by Type

        • Spring Water
        • Mineral Water
        • Purified Water
        • Sparkling Water
        • Flavored Water
      • MALAYSIA Bottled Water Products Market by Packaging Type

        • PET Bottles
        • Glass Bottles
        • Cartons
        • Kegs
        • Pouches
      • MALAYSIA Bottled Water Products Market by Distribution Channel Type

        • Supermarkets/Hypermarkets
        • Convenience Stores
        • Online Retail
        • Restaurants/Cafes
        • Health Food Stores
      • MALAYSIA Bottled Water Products Market by End User Type

        • Residential
        • Commercial
        • Institutional
      • THAILAND Outlook (USD Billion, 2019-2035)
      • THAILAND Bottled Water Products Market by Type

        • Spring Water
        • Mineral Water
        • Purified Water
        • Sparkling Water
        • Flavored Water
      • THAILAND Bottled Water Products Market by Packaging Type

        • PET Bottles
        • Glass Bottles
        • Cartons
        • Kegs
        • Pouches
      • THAILAND Bottled Water Products Market by Distribution Channel Type

        • Supermarkets/Hypermarkets
        • Convenience Stores
        • Online Retail
        • Restaurants/Cafes
        • Health Food Stores
      • THAILAND Bottled Water Products Market by End User Type

        • Residential
        • Commercial
        • Institutional
      • INDONESIA Outlook (USD Billion, 2019-2035)
      • INDONESIA Bottled Water Products Market by Type

        • Spring Water
        • Mineral Water
        • Purified Water
        • Sparkling Water
        • Flavored Water
      • INDONESIA Bottled Water Products Market by Packaging Type

        • PET Bottles
        • Glass Bottles
        • Cartons
        • Kegs
        • Pouches
      • INDONESIA Bottled Water Products Market by Distribution Channel Type

        • Supermarkets/Hypermarkets
        • Convenience Stores
        • Online Retail
        • Restaurants/Cafes
        • Health Food Stores
      • INDONESIA Bottled Water Products Market by End User Type

        • Residential
        • Commercial
        • Institutional
      • REST OF APAC Outlook (USD Billion, 2019-2035)
      • REST OF APAC Bottled Water Products Market by Type

        • Spring Water
        • Mineral Water
        • Purified Water
        • Sparkling Water
        • Flavored Water
      • REST OF APAC Bottled Water Products Market by Packaging Type

        • PET Bottles
        • Glass Bottles
        • Cartons
        • Kegs
        • Pouches
      • REST OF APAC Bottled Water Products Market by Distribution Channel Type

        • Supermarkets/Hypermarkets
        • Convenience Stores
        • Online Retail
        • Restaurants/Cafes
        • Health Food Stores
      • REST OF APAC Bottled Water Products Market by End User Type

        • Residential
        • Commercial
        • Institutional
    • South America Outlook (USD Billion, 2019-2035)

      • South America Bottled Water Products Market by Type

        • Spring Water
        • Mineral Water
        • Purified Water
        • Sparkling Water
        • Flavored Water
      • South America Bottled Water Products Market by Packaging Type

        • PET Bottles
        • Glass Bottles
        • Cartons
        • Kegs
        • Pouches
      • South America Bottled Water Products Market by Distribution Channel Type

        • Supermarkets/Hypermarkets
        • Convenience Stores
        • Online Retail
        • Restaurants/Cafes
        • Health Food Stores
      • South America Bottled Water Products Market by End User Type

        • Residential
        • Commercial
        • Institutional
      • South America Bottled Water Products Market by Regional Type

        • Brazil
        • Mexico
        • Argentina
        • Rest of South America
      • BRAZIL Outlook (USD Billion, 2019-2035)
      • BRAZIL Bottled Water Products Market by Type

        • Spring Water
        • Mineral Water
        • Purified Water
        • Sparkling Water
        • Flavored Water
      • BRAZIL Bottled Water Products Market by Packaging Type

        • PET Bottles
        • Glass Bottles
        • Cartons
        • Kegs
        • Pouches
      • BRAZIL Bottled Water Products Market by Distribution Channel Type

        • Supermarkets/Hypermarkets
        • Convenience Stores
        • Online Retail
        • Restaurants/Cafes
        • Health Food Stores
      • BRAZIL Bottled Water Products Market by End User Type

        • Residential
        • Commercial
        • Institutional
      • MEXICO Outlook (USD Billion, 2019-2035)
      • MEXICO Bottled Water Products Market by Type

        • Spring Water
        • Mineral Water
        • Purified Water
        • Sparkling Water
        • Flavored Water
      • MEXICO Bottled Water Products Market by Packaging Type

        • PET Bottles
        • Glass Bottles
        • Cartons
        • Kegs
        • Pouches
      • MEXICO Bottled Water Products Market by Distribution Channel Type

        • Supermarkets/Hypermarkets
        • Convenience Stores
        • Online Retail
        • Restaurants/Cafes
        • Health Food Stores
      • MEXICO Bottled Water Products Market by End User Type

        • Residential
        • Commercial
        • Institutional
      • ARGENTINA Outlook (USD Billion, 2019-2035)
      • ARGENTINA Bottled Water Products Market by Type

        • Spring Water
        • Mineral Water
        • Purified Water
        • Sparkling Water
        • Flavored Water
      • ARGENTINA Bottled Water Products Market by Packaging Type

        • PET Bottles
        • Glass Bottles
        • Cartons
        • Kegs
        • Pouches
      • ARGENTINA Bottled Water Products Market by Distribution Channel Type

        • Supermarkets/Hypermarkets
        • Convenience Stores
        • Online Retail
        • Restaurants/Cafes
        • Health Food Stores
      • ARGENTINA Bottled Water Products Market by End User Type

        • Residential
        • Commercial
        • Institutional
      • REST OF SOUTH AMERICA Outlook (USD Billion, 2019-2035)
      • REST OF SOUTH AMERICA Bottled Water Products Market by Type

        • Spring Water
        • Mineral Water
        • Purified Water
        • Sparkling Water
        • Flavored Water
      • REST OF SOUTH AMERICA Bottled Water Products Market by Packaging Type

        • PET Bottles
        • Glass Bottles
        • Cartons
        • Kegs
        • Pouches
      • REST OF SOUTH AMERICA Bottled Water Products Market by Distribution Channel Type

        • Supermarkets/Hypermarkets
        • Convenience Stores
        • Online Retail
        • Restaurants/Cafes
        • Health Food Stores
      • REST OF SOUTH AMERICA Bottled Water Products Market by End User Type

        • Residential
        • Commercial
        • Institutional
    • MEA Outlook (USD Billion, 2019-2035)

      • MEA Bottled Water Products Market by Type

        • Spring Water
        • Mineral Water
        • Purified Water
        • Sparkling Water
        • Flavored Water
      • MEA Bottled Water Products Market by Packaging Type

        • PET Bottles
        • Glass Bottles
        • Cartons
        • Kegs
        • Pouches
      • MEA Bottled Water Products Market by Distribution Channel Type

        • Supermarkets/Hypermarkets
        • Convenience Stores
        • Online Retail
        • Restaurants/Cafes
        • Health Food Stores
      • MEA Bottled Water Products Market by End User Type

        • Residential
        • Commercial
        • Institutional
      • MEA Bottled Water Products Market by Regional Type

        • GCC Countries
        • South Africa
        • Rest of MEA
      • GCC COUNTRIES Outlook (USD Billion, 2019-2035)
      • GCC COUNTRIES Bottled Water Products Market by Type

        • Spring Water
        • Mineral Water
        • Purified Water
        • Sparkling Water
        • Flavored Water
      • GCC COUNTRIES Bottled Water Products Market by Packaging Type

        • PET Bottles
        • Glass Bottles
        • Cartons
        • Kegs
        • Pouches
      • GCC COUNTRIES Bottled Water Products Market by Distribution Channel Type

        • Supermarkets/Hypermarkets
        • Convenience Stores
        • Online Retail
        • Restaurants/Cafes
        • Health Food Stores
      • GCC COUNTRIES Bottled Water Products Market by End User Type

        • Residential
        • Commercial
        • Institutional
      • SOUTH AFRICA Outlook (USD Billion, 2019-2035)
      • SOUTH AFRICA Bottled Water Products Market by Type

        • Spring Water
        • Mineral Water
        • Purified Water
        • Sparkling Water
        • Flavored Water
      • SOUTH AFRICA Bottled Water Products Market by Packaging Type

        • PET Bottles
        • Glass Bottles
        • Cartons
        • Kegs
        • Pouches
      • SOUTH AFRICA Bottled Water Products Market by Distribution Channel Type

        • Supermarkets/Hypermarkets
        • Convenience Stores
        • Online Retail
        • Restaurants/Cafes
        • Health Food Stores
      • SOUTH AFRICA Bottled Water Products Market by End User Type

        • Residential
        • Commercial
        • Institutional
      • REST OF MEA Outlook (USD Billion, 2019-2035)
      • REST OF MEA Bottled Water Products Market by Type

        • Spring Water
        • Mineral Water
        • Purified Water
        • Sparkling Water
        • Flavored Water
      • REST OF MEA Bottled Water Products Market by Packaging Type

        • PET Bottles
        • Glass Bottles
        • Cartons
        • Kegs
        • Pouches
      • REST OF MEA Bottled Water Products Market by Distribution Channel Type

        • Supermarkets/Hypermarkets
        • Convenience Stores
        • Online Retail
        • Restaurants/Cafes
        • Health Food Stores
      • REST OF MEA Bottled Water Products Market by End User Type

        • Residential
        • Commercial
        • Institutional


    Infographic

    Free Sample Request

    Kindly complete the form below to receive a free sample of this Report

    Get Free Sample

    Customer Strories

    “I am very pleased with how market segments have been defined in a relevant way for my purposes (such as "Portable Freezers & refrigerators" and "last-mile"). In general the report is well structured. Thanks very much for your efforts.”

    Victoria Milne

    Founder
    Case Study
    Chemicals and Materials