• Cat-intel
  • MedIntelliX
  • Resources
  • About Us
  • Hero Background
    English
    Chinese
    French
    Japanese
    Korean
    German
    Spanish

    Commercial Earth Observation CEO Market Size

    ID: MRFR/A&D/12473-HCR
    200 Pages
    Sejal Akre
    October 2025

    Commercial Earth Observation (CEO) Market Research Report By Application (Agriculture, Forestry, Urban Planning, Disaster Management, Environmental Monitoring), By Data Type (Satellite Imagery, Aerial Imagery, LiDAR Data, Ground-Based Data), By End Use (Government, Commercial Enterprises, Research Institutions, Non-Governmental Organizations), By Deployment Model (On-Premises, Cloud-Based, Hybr...

    Share:
    Download PDF ×

    We do not share your information with anyone. However, we may send you emails based on your report interest from time to time. You may contact us at any time to opt-out.

    Commercial Earth Observation CEO Market Infographic
    $ 4,950.0
    $ 5,950.0
    $ 7,250.0

    Commercial Earth Observation Ceo Size

    Commercial Earth Observation CEO Market Growth Projections and Opportunities

    The commercial earth observation market is influenced by several key factors that drive its growth and development. One significant factor is the increasing demand for geospatial data and insights across various industries. With the proliferation of satellite technology and advancements in remote sensing capabilities, there is a growing need for high-resolution imagery, data analytics, and geospatial intelligence to support decision-making in sectors such as agriculture, forestry, urban planning, infrastructure development, and environmental monitoring. Commercial earth observation providers cater to this demand by offering a wide range of satellite-based imaging and analytics solutions that enable businesses, governments, and organizations to gain valuable insights into Earth's surface and make informed decisions. Moreover, technological advancements play a crucial role in shaping the commercial earth observation market. Advances in satellite technology, sensor capabilities, and image processing algorithms have significantly enhanced the resolution, accuracy, and coverage of earth observation data. New satellite constellations, such as those comprising small satellites and cubesats, offer increased revisit rates and more frequent imaging opportunities, enabling rapid response to dynamic environmental changes and events. Additionally, innovations in artificial intelligence (AI) and machine learning algorithms enable automated image analysis, feature extraction, and pattern recognition, further expanding the utility and value of earth observation data for various applications. Furthermore, regulatory reforms and policy initiatives drive market growth and innovation in the commercial earth observation sector. Governments around the world are increasingly recognizing the strategic importance of earth observation data for national security, disaster management, resource management, and economic development. As a result, policymakers are implementing measures to facilitate private sector participation, encourage innovation, and streamline regulatory frameworks for commercial earth observation activities. These reforms create opportunities for commercial earth observation providers to expand their market presence, develop new products and services, and capitalize on emerging market trends and opportunities. Additionally, the increasing frequency and severity of natural disasters and environmental crises contribute to the growth of the commercial earth observation market. Earth observation data plays a critical role in disaster preparedness, response, and recovery efforts by providing real-time information on natural hazards, such as floods, wildfires, hurricanes, earthquakes, and droughts. Commercial earth observation providers offer rapid response services, emergency mapping, and damage assessment solutions that enable governments, relief agencies, and humanitarian organizations to assess the impact of disasters, coordinate response efforts, and allocate resources effectively. The demand for earth observation data and services is expected to grow as the frequency and intensity of natural disasters continue to rise due to climate change and other environmental factors. Moreover, the emergence of new market players and business models drives market innovation and competition in the commercial earth observation sector. With the lowering costs of satellite manufacturing, launch services, and data processing, barriers to entry into the earth observation market have decreased, enabling new entrants to enter the market and disrupt traditional business models. Startups, technology companies, and private equity investors are increasingly investing in earth observation ventures, developing innovative satellite platforms, data analytics tools, and value-added services that cater to niche markets and address specific customer needs. This influx of new players and business models fosters innovation, drives technological advancements, and expands the range of earth observation applications and services available to customers.

    Commercial Earth Observation CEO Market Size Graph

    Market Summary

    The Global Commercial Earth Observation market is projected to grow from 5.29 USD Billion in 2024 to 12.99 USD Billion by 2035, reflecting a robust growth trajectory.

    Key Market Trends & Highlights

    Commercial Earth Observation (CEO) Key Trends and Highlights

    • The market is expected to experience a compound annual growth rate (CAGR) of 6.31 percent from 2025 to 2035.
    • By 2035, the market valuation is anticipated to reach 8 USD Billion, indicating strong demand for earth observation services.
    • in 2024, the market is valued at 5.29 USD Billion, showcasing its current significance in various sectors.
    • Growing adoption of satellite technology due to increasing demand for environmental monitoring is a major market driver.

    Market Size & Forecast

    2024 Market Size 5.29 (USD Billion)
    2035 Market Size 12.99 (USD Billion)
    CAGR (2025-2035) 8.50%
    Largest Regional Market Share in 2024 latin_america)

    Major Players

    BlackSky, DigitalGlobe, MDA, Planet Labs, Northrop Grumman, Maxar Technologies, Red Hen Systems, Boeing, Airbus Defence and Space, GeoIQ

    Market Trends

    The Commercial Earth Observation (CEO) Market is witnessing significant market trends driven by advancements in satellite technology and increasing demand for high-resolution imagery.

    The proliferation of small satellites and advancements in remote sensing technologies enhance the ability to capture detailed Earth data, which is being used across various sectors, including agriculture, urban planning, and disaster management.

    Precision farming techniques are being investigated by agricultural businesses as a result of data analytics derived from satellite imagery. These techniques are designed to enhance crop yield and minimize waste.

    Furthermore, the significance of collaboration between public entities and private enterprises is underscored by the role of government initiatives in promoting the use of Earth observation data for the purpose of monitoring national priorities.

    Given this, the Global Commercial Earth Observation Market is adapting to address environmental and societal challenges by leveraging data-driven insights.

    The increasing reliance on satellite data for environmental monitoring and disaster management underscores the pivotal role of commercial earth observation in enhancing global resilience and sustainability efforts.

    National Oceanic and Atmospheric Administration (NOAA)

    Commercial Earth Observation CEO Market Market Drivers

    Rising Demand for Satellite Imagery

    The Global Commercial Earth Observation (CEO) Market Industry experiences a notable increase in demand for satellite imagery across various sectors, including agriculture, urban planning, and disaster management. This demand is driven by the need for accurate and timely data to support decision-making processes. For instance, agricultural stakeholders utilize satellite imagery to monitor crop health and optimize yields. The market is projected to reach 4.08 USD Billion in 2024, reflecting a growing reliance on satellite data. As industries recognize the value of geospatial information, the Global Commercial Earth Observation (CEO) Market Industry is likely to expand significantly.

    Market Segment Insights

    Commercial Earth Observation (CEO) Market Segment Insights

    Commercial Earth Observation (CEO) Market Segment Insights

    Commercial Earth Observation (CEO) Market Application Insights

    Commercial Earth Observation (CEO) Market Application Insights

    The Commercial Earth Observation (CEO) Market, specifically focusing on the Application segment, showcases a robust growth trajectory with significant contributions from various applications including Agriculture, Forestry, Urban Planning, Disaster Management, and Environmental Monitoring.

    In 2024, the total revenue for this segment is projected to reach approximately 4.08 USD Billion, illustrating the rising demand for earth observation data across diverse sectors.

    Agriculture stands out as a leading application within this market, with a valuation of 1.2 USD Billion in 2024, signaling its critical role in enhancing crop yield and optimizing resource use through precision farming techniques.The Forestry application, valued at 0.8 USD Billion in the same year, highlights the importance of monitoring forestry resources for sustainable logging practices and conservation efforts, thus supporting environmental sustainability goals globally.

    Urban Planning is another significant application in the Commercial Earth Observation (CEO) Market, with a value of 0.96 USD Billion, as cities increasingly rely on satellite imagery and geospatial data to plan infrastructure projects, manage land use, and facilitate smarter urban development.Disaster Management, valued at 0.72 USD Billion, employs earth observation data to enhance preparedness and response strategies, allowing for effective resource allocation and real-time decision-making during emergencies.

    Commercial Earth Observation (CEO) Market Data Type Insights

    Commercial Earth Observation (CEO) Market Data Type Insights

    The Commercial Earth Observation (CEO) Market, valued at 4.08 USD Billion in 2024, presents an expanding opportunity across various Data Type segments, notably Satellite Imagery, Aerial Imagery, LiDAR Data, and Ground-Based Data.

    These segments are crucial in providing comprehensive insights into the evolving needs of industries such as agriculture, urban planning, and disaster management.

    Satellite Imagery holds a significant share, as it offers extensive coverage and timely updates on large geographical areas, enabling better decision-making.Aerial Imagery complements this by providing high-resolution data for specific locations, proving vital for infrastructure projects. LiDAR Data is increasingly gaining traction due to its precise 3D mapping capabilities, enhancing monitoring and analytics across different applications.

    Ground-Based Data, while often overlooked, supports localized assessments, contributing valuable information that aids in more nuanced analysis.

    The collective synergy among these Data Type segments is driving the Commercial Earth Observation (CEO) Market forward, reflecting the industry's growth potential and adaptability to meet emerging challenges and opportunities in a rapidly changing global landscape.

    Commercial Earth Observation (CEO) Market End Use Insights

    Commercial Earth Observation (CEO) Market End Use Insights

    The Commercial Earth Observation (CEO) Market is poised for significant growth across various end-use segments, including Government, Commercial Enterprises, Research Institutions, and Non-Governmental Organizations, with the overall market expected to be valued at 4.08 billion USD by 2024.

    Governments are increasingly relying on Earth observation data for urban planning, disaster management, and environmental monitoring, demonstrating their dominance in the market.

    Similarly, Commercial Enterprises leverage satellite imagery and analytics for sectors like agriculture, real estate, and transportation, as they seek to optimize operations and enhance decision-making.Research Institutions utilize Earth observation data for scientific studies and assessments, driving innovation and sustainable practices.

    Non-Governmental Organizations play a crucial role in utilizing this data for conservation efforts, humanitarian work, and policymaking, thus contributing significantly to the Commercial Earth Observation (CEO) Market statistics.

    Commercial Earth Observation (CEO) Market Deployment Model Insights

    Commercial Earth Observation (CEO) Market Deployment Model Insights

    The Commercial Earth Observation (CEO) Market shows significant growth within the Deployment Model segment, which is crucial for developing tailored solutions that meet various user needs. By 2024, the overall market is set to reach a valuation of 4.08 USD Billion, reflecting the increasing reliance on advanced technologies.

    The market segmentation reveals three primary deployment options: On-Premises, Cloud-Based, and Hybrid models. On-Premises solutions are favored by organizations that prioritize data control and security, while Cloud-Based models offer flexibility and accessibility, enabling real-time data processing and storage.Hybrid deployments combine these strengths, addressing the diverse requirements of users across sectors such as agriculture, disaster management, and resource monitoring.

    Recent government initiatives promoting satellite deployments and improved data infrastructure significantly drive this market growth, ensuring that stakeholders capitalize on Commercial Earth Observation (CEO) Market data.

    The market statistics indicate a steady demand for these deployment options, with each type playing a significant role in enhancing operational efficiency and decision-making across industries.As technologies evolve, opportunities for integration and innovation continue to emerge, making the Deployment Model a pivotal component of the Commercial Earth Observation (CEO) Market industry.

    Get more detailed insights about Commercial Earth Observation (CEO) Market Research Report — Global Forecast till 2035

    Regional Insights

    The Commercial Earth Observation (CEO) Market is showing promising growth and substantial revenue potential, primarily due to factors such as increasing demand for satellite imagery and data analytics applications.

    In the year 2024, the North America region is expected to hold a majority share, valued at 1.44 USD Billion, driven by advancements in technology and strong investments in Research and Development.

    Following closely is Europe, anticipated to reach 1.2 USD Billion, benefiting from significant governmental initiatives for environmental monitoring.

    The Asia Pacific region is projected at 0.96 USD Billion, showcasing an emerging market with heightened interest in urban planning and disaster management.

    South America, with a valuation of 0.32 USD Billion, is gradually recognizing the benefits of earth observation technologies in agriculture and environmental conservation.

    Meanwhile, the Middle East and Africa, valued at 0.16 USD Billion, exhibit a growing interest in climate change monitoring and resource management. Each region reflects unique opportunities and challenges, contributing to the Commercial Earth Observation (CEO) Market's overall performance and industry dynamics.

    The market is likely to see increasing collaborations between public and private sectors as demand for earth observation data continues to rise.

    Commercial Earth Observation (CEO) Market Regional Insights

    Source: Primary Research, Secondary Research, Market Research Future Database and Analyst Review

    Key Players and Competitive Insights

    The Commercial Earth Observation (CEO) Market has witnessed significant growth and innovation as a result of advancements in satellite technology and increasing demand for data-driven insights across various sectors.

    The competitive landscape is marked by a diverse range of players striving to provide high-quality, timely, and precise geospatial information. Companies in this market leverage their technological capabilities and strategic partnerships to enhance service offerings.

    The market is characterized by the presence of both established and emerging entrants, each contributing to the dynamic nature of the industry. Furthermore, the increasing applications of earth observation data in agriculture, environmental monitoring, disaster management, and urban planning present ample opportunities for competitive differentiation and growth.

    BlackSky is a prominent player that stands out in the Global Commercial Earth Observation Market due to its innovative satellite technology and a strong commitment to providing timely and actionable insights.

    Their unique approach focuses on real-time analytics, allowing customers to access critical information that influences decision-making processes. BlackSky has established partnerships with various organizations to enhance its data collection capabilities, further solidifying its market presence.

    With a strong emphasis on cost-efficiency and rapid image acquisition, the company has distinguished itself as an agile competitor, offering tailored solutions to meet the unique needs of its clientele. The ability to rapidly deploy satellites and collect data with high revisit rates is one of BlackSky’s significant strengths, positioning it effectively in the competitive landscape.

    DigitalGlobe operates as a leading figure within the Global Commercial Earth Observation Market, renowned for its high-resolution satellite imagery and analytical services. The company offers an extensive range of products and services aimed at various industries, including defense, intelligence, and commercial sectors.

    DigitalGlobe's advanced satellite constellation and a commitment to continuous innovation enable it to provide superior data quality and service reliability.

    The company's strengths lie in its rich repository of imagery, comprehensive analytics, and a strong customer base spanning across multiple sectors globally. DigitalGlobe has also pursued strategic mergers and acquisitions to expand its technological capabilities and bolster its market position.

    By integrating additional resources and expertise through these initiatives, the company continues to enhance its service offerings and strengthen its foothold in the competitive landscape of the Global Commercial Earth Observation Market.

    Key Companies in the Commercial Earth Observation CEO Market market include

    Industry Developments

    Recent developments in the Commercial Earth Observation (CEO) Market have shown significant advancements and activities. BlackSky and Planet Labs have expanded their satellite fleets to enhance real-time data acquisition capabilities, while Maxar Technologies continues to innovate in high-resolution imaging, generating interest in Earth mapping applications.

    Major happenings include the contract awarded to Airbus Defence and Space in November 2022, reinforcing their strong presence in both military and civilian sectors. Mergers and acquisitions have occurred, such as Northrop Grumman's acquisition of Orbital ATK in June 2018, which positioned Northrop to capitalize on Earth observation technologies.

    The market has seen considerable growth, with valuations increasing notably, driven by rising demand for geospatial data across various sectors.

    The role of companies like Siemens and Hughes Network Systems has been instrumental in developing the necessary infrastructure for satellite communication and data integration.

    As of October 2023, the market remains competitive, with companies focusing on technological advancements in remote sensing and data analytics, reflecting a dynamic and evolving landscape within the Global Commercial Earth Observation sector.

    Future Outlook

    Commercial Earth Observation CEO Market Future Outlook

    The Global Commercial Earth Observation (CEO) Market is projected to grow at a 8.50% CAGR from 2025 to 2035, driven by advancements in satellite technology and increasing demand for geospatial data.

    New opportunities lie in:

    • Develop AI-driven analytics platforms for enhanced data interpretation.
    • Expand partnerships with government agencies for environmental monitoring projects.
    • Invest in satellite miniaturization to reduce costs and increase accessibility.

    By 2035, the market is expected to reach a robust position, reflecting substantial growth and innovation.

    Market Segmentation

    Commercial Earth Observation (CEO) Market End Use Outlook

    • On-Premises
    • Cloud-Based
    • Hybrid

    Commercial Earth Observation (CEO) Market Regional Outlook

    • North America
    • Europe
    • South America
    • Asia Pacific
    • Middle East and Africa

    Commercial Earth Observation (CEO) Market Data Type Outlook

    • Government
    • Commercial Enterprises
    • Research Institutions
    • Non-Governmental Organizations

    Commercial Earth Observation (CEO) Market Application Outlook

    • Satellite Imagery
    • Aerial Imagery
    • LiDAR Data
    • Ground-Based Data

    Commercial Earth Observation (CEO) Market Deployment Model Outlook

    • North America
    • Europe
    • South America
    • Asia Pacific
    • Middle East and Africa

    Report Scope

    Report Attribute/Metric Details
    Market Size 2024 4.08(USD Billion)
    Market Size 2035 12.99 (USD Billion)
    Compound Annual Growth Rate (CAGR) 8.50% (2025 - 2035)
    Report Coverage Revenue Forecast, Competitive Landscape, Growth Factors, and Trends
    Base Year 2024
    Market Forecast Period 2025 - 2035
    Historical Data 2019 - 2024
    Market Forecast Units USD Billion
    Key Companies Profiled BlackSky, DigitalGlobe, MDA, Planet Labs, Northrop Grumman, Maxar Technologies, Red Hen Systems, Boeing, Airbus Defence and Space, GeoIQ
    Segments Covered Application, Data Type, End Use, Deployment Model, Regional
    Key Market Opportunities Increased demand for satellite data, Growth in agricultural monitoring solutions, Expansion of urban planning services, Advancements in data analytics technology, Rising applications in climate change assessment
    Key Market Dynamics Technological advancements, Increasing satellite launches, Growing environmental monitoring, Rising demand for agriculture insights, Expanding government investments
    Countries Covered North America, Europe, APAC, South America, MEA
    Market Size 2025 5.75 (USD Billion)

    Market Highlights

    Author

    Sejal Akre
    Senior Research Analyst

    She holds an experience of about 6+ years in market research and business consulting, working under the spectrum of information communication technology, telecommunications and semiconductor domains. aarti conceptualizes and implements a scalable business strategy and provides strategic leadership to the clients. her expertise lies in market estimation, competitive intelligence, pipeline analysis, customer assessment, etc.

    Leave a Comment

    Latest Comments

    John Doe
    john@example.com

    This is a great article! Really helped me understand the topic better.

    Posted on July 23, 2025, 10:15 AM
    Jane Smith
    jane@domain.com

    Thanks for sharing this. I’ve bookmarked it for later reference.

    Posted on July 22, 2025, 7:45 PM

    FAQs

    What is the expected market size of the Commercial Earth Observation (CEO) Market by 2024?

    The Commercial Earth Observation (CEO) Market is expected to be valued at 4.08 billion USD by 2024.

    What will be the projected market size in 2035 for the Commercial Earth Observation (CEO) Market?

    By 2035, the Commercial Earth Observation (CEO) Market is anticipated to reach a valuation of 8.0 billion USD.

    What is the expected compound annual growth rate (CAGR) for the Commercial Earth Observation (CEO) Market between 2025 and 2035?

    The expected CAGR for the Commercial Earth Observation (CEO) Market from 2025 to 2035 is 6.31 percent.

    Which region is projected to dominate the Commercial Earth Observation (CEO) Market by value in 2024?

    North America is projected to dominate the Commercial Earth Observation (CEO) Market with a value of 1.44 billion USD in 2024.

    What will the market value for Europe be in 2035 within the Commercial Earth Observation (CEO) Market?

    In 2035, the market value for Europe is expected to be 2.4 billion USD within the Commercial Earth Observation (CEO) Market.

    What is the market size for the Agriculture application segment in the Commercial Earth Observation (CEO) Market in 2024?

    The Agriculture application segment is valued at 1.2 billion USD in the Commercial Earth Observation (CEO) Market in 2024.

    Which are the key players in the Commercial Earth Observation (CEO) Market?

    Key players in the Commercial Earth Observation (CEO) Market include BlackSky, DigitalGlobe, EAgile Technologies, and Maxar Technologies.

    What will be the expected market size for Disaster Management application by 2035?

    The expected market size for the Disaster Management application segment will be 1.44 billion USD by 2035.

    What market value is projected for the Environmental Monitoring segment in 2024 within the Commercial Earth Observation (CEO) Market?

    The Environmental Monitoring segment is projected to have a market value of 0.4 billion USD in 2024.

    What is the anticipated market growth rate for the Asia Pacific region from 2024 to 2035?

    The Asia Pacific region is expected to grow from a market value of 0.96 billion USD in 2024 to 1.92 billion USD by 2035.

    1. Table of Contents
    2. Executive Summary
      1. Market Overview
      2. Key Findings
      3. Market Segmentation
      4. Competitive Landscape
      5. Challenges and Opportunities
      6. Future Outlook
    3. Market Introduction
      1. Definition
      2. Scope of the Study
        1. Research Objective
        2. Assumption
        3. Limitations
    4. Research Methodology
      1. Overview
      2. Data Mining
      3. Secondary Research
      4. Primary Research
        1. Primary Interviews and Information Gathering Process
        2. Breakdown of Primary Respondents
      5. Forecasting Model
      6. Market Size Estimation
        1. Bottom-up Approach
        2. Top-Down Approach
      7. Data Triangulation
      8. Validation
    5. MARKET DYNAMICS
      1. Overview
      2. Drivers
      3. Restraints
      4. Opportunities
    6. MARKET FACTOR ANALYSIS
      1. Value chain Analysis
      2. Porter's Five Forces Analysis
        1. Bargaining Power of Suppliers
        2. Bargaining Power of Buyers
        3. Threat of New Entrants
        4. Threat of Substitutes
        5. Intensity of Rivalry
      3. COVID-19 Impact Analysis
        1. Market Impact Analysis
        2. Regional Impact
        3. Opportunity and Threat Analysis
    7. COMMERCIAL EARTH OBSERVATION (CEO) MARKET, BY APPLICATION (USD BILLION)
      1. Agriculture
      2. Forestry
      3. Urban Planning
      4. Disaster Management
      5. Environmental Monitoring
    8. COMMERCIAL EARTH OBSERVATION (CEO) MARKET, BY DATA TYPE (USD BILLION)
      1. Satellite Imagery
      2. Aerial Imagery
      3. LiDAR Data
      4. Ground-Based Data
    9. COMMERCIAL EARTH OBSERVATION (CEO) MARKET, BY END USE (USD BILLION)
      1. Government
      2. Commercial Enterprises
      3. Research Institutions
      4. Non-Governmental Organizations
    10. COMMERCIAL EARTH OBSERVATION (CEO) MARKET, BY DEPLOYMENT MODEL (USD BILLION)
      1. On-Premises
      2. Cloud-Based
      3. Hybrid
    11. COMMERCIAL EARTH OBSERVATION 
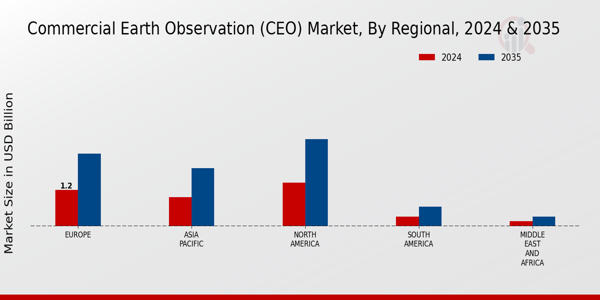
(CEO) MARKET, BY REGIONAL (USD BILLION)
      1. North America
        1. US
        2. Canada
      2. Europe
        1. Germany
        2. UK
        3. France
        4. Russia
        5. Italy
        6. Spain
        7. Rest of Europe
      3. APAC
        1. China
        2. India
        3. Japan
        4. South Korea
        5. Malaysia
        6. Thailand
        7. Indonesia
        8. Rest of APAC
      4. South America
        1. Brazil
        2. Mexico
        3. Argentina
        4. Rest of South America
      5. MEA
        1. GCC Countries
        2. South Africa
        3. Rest of MEA
    12. Competitive Landscape
      1. Overview
      2. Competitive Analysis
      3. Market share Analysis
      4. Major Growth Strategy in the Commercial Earth Observation (CEO) Market
      5. Competitive Benchmarking
      6. Leading Players in Terms of Number of Developments in the Commercial Earth Observation (CEO) Market
      7. Key developments and growth strategies
        1. New Product Launch/Service Deployment
        2. Merger & Acquisitions
        3. Joint Ventures
      8. Major Players Financial Matrix
        1. Sales and Operating Income
        2. Major Players R&D Expenditure. 2023
    13. COMPANY PROFILES
      1. BlackSky
        1. Financial Overview
        2. Products Offered
        3. Key Developments
        4. SWOT Analysis
        5. Key Strategies
      2. DigitalGlobe
        1. Financial Overview
        2. Products Offered
        3. Key Developments
        4. SWOT Analysis
        5. Key Strategies
      3. EAgile Technologies
        1. Financial Overview
        2. Products Offered
        3. Key Developments
        4. SWOT Analysis
        5. Key Strategies
      4. MDA
        1. Financial Overview
        2. Products Offered
        3. Key Developments
        4. SWOT Analysis
        5. Key Strategies
      5. Hughes Network Systems
        1. Financial Overview
        2. Products Offered
        3. Key Developments
        4. SWOT Analysis
        5. Key Strategies
      6. Planet Labs
        1. Financial Overview
        2. Products Offered
        3. Key Developments
        4. SWOT Analysis
        5. Key Strategies
      7. Sierra Nevada Corporation
        1. Financial Overview
        2. Products Offered
        3. Key Developments
        4. SWOT Analysis
        5. Key Strategies
      8. Northrop Grumman
        1. Financial Overview
        2. Products Offered
        3. Key Developments
        4. SWOT Analysis
        5. Key Strategies
      9. Maxar Technologies
        1. Financial Overview
        2. Products Offered
        3. Key Developments
        4. SWOT Analysis
        5. Key Strategies
      10. Siemens
        1. Financial Overview
        2. Products Offered
        3. Key Developments
        4. SWOT Analysis
        5. Key Strategies
      11. Red Hen Systems
        1. Financial Overview
        2. Products Offered
        3. Key Developments
        4. SWOT Analysis
        5. Key Strategies
      12. Boeing
        1. Financial Overview
        2. Products Offered
        3. Key Developments
        4. SWOT Analysis
        5. Key Strategies
      13. Airbus Defence and Space
        1. Financial Overview
        2. Products Offered
        3. Key Developments
        4. SWOT Analysis
        5. Key Strategies
      14. GeoIQ
        1. Financial Overview
        2. Products Offered
        3. Key Developments
        4. SWOT Analysis
        5. Key Strategies
    14. APPENDIX
      1. References
      2. Related Reports
    15. List of Tables and Figures
      1. LIST OF TABLES
      2. TABLE 1. LIST OF ASSUMPTIONS
      3. TABLE 2. NORTH AMERICA COMMERCIAL EARTH OBSERVATION (CEO) MARKET SIZE ESTIMATES & FORECAST, BY APPLICATION, 2019-2035 (USD BILLIONS)
      4. TABLE 3. NORTH AMERICA COMMERCIAL EARTH OBSERVATION (CEO) MARKET SIZE ESTIMATES & FORECAST, BY DATA TYPE, 2019-2035 (USD BILLIONS)
      5. TABLE 4. NORTH AMERICA COMMERCIAL EARTH OBSERVATION (CEO) MARKET SIZE ESTIMATES & FORECAST, BY END USE, 2019-2035 (USD BILLIONS)
      6. TABLE 5. NORTH AMERICA COMMERCIAL EARTH OBSERVATION (CEO) MARKET SIZE ESTIMATES & FORECAST, BY DEPLOYMENT MODEL, 2019-2035 (USD BILLIONS)
      7. TABLE 6. NORTH AMERICA COMMERCIAL EARTH OBSERVATION (CEO) MARKET SIZE ESTIMATES & FORECAST, BY REGIONAL, 2019-2035 (USD BILLIONS)
      8. TABLE 7. US COMMERCIAL EARTH OBSERVATION (CEO) MARKET SIZE ESTIMATES & FORECAST, BY APPLICATION, 2019-2035 (USD BILLIONS)
      9. TABLE 8. US COMMERCIAL EARTH OBSERVATION (CEO) MARKET SIZE ESTIMATES & FORECAST, BY DATA TYPE, 2019-2035 (USD BILLIONS)
      10. TABLE 9. US COMMERCIAL EARTH OBSERVATION (CEO) MARKET SIZE ESTIMATES & FORECAST, BY END USE, 2019-2035 (USD BILLIONS)
      11. TABLE 10. US COMMERCIAL EARTH OBSERVATION (CEO) MARKET SIZE ESTIMATES & FORECAST, BY DEPLOYMENT MODEL, 2019-2035 (USD BILLIONS)
      12. TABLE 11. US COMMERCIAL EARTH OBSERVATION (CEO) MARKET SIZE ESTIMATES & FORECAST, BY REGIONAL, 2019-2035 (USD BILLIONS)
      13. TABLE 12. CANADA COMMERCIAL EARTH OBSERVATION (CEO) MARKET SIZE ESTIMATES & FORECAST, BY APPLICATION, 2019-2035 (USD BILLIONS)
      14. TABLE 13. CANADA COMMERCIAL EARTH OBSERVATION (CEO) MARKET SIZE ESTIMATES & FORECAST, BY DATA TYPE, 2019-2035 (USD BILLIONS)
      15. TABLE 14. CANADA COMMERCIAL EARTH OBSERVATION (CEO) MARKET SIZE ESTIMATES & FORECAST, BY END USE, 2019-2035 (USD BILLIONS)
      16. TABLE 15. CANADA COMMERCIAL EARTH OBSERVATION (CEO) MARKET SIZE ESTIMATES & FORECAST, BY DEPLOYMENT MODEL, 2019-2035 (USD BILLIONS)
      17. TABLE 16. CANADA COMMERCIAL EARTH OBSERVATION (CEO) MARKET SIZE ESTIMATES & FORECAST, BY REGIONAL, 2019-2035 (USD BILLIONS)
      18. TABLE 17. EUROPE COMMERCIAL EARTH OBSERVATION (CEO) MARKET SIZE ESTIMATES & FORECAST, BY APPLICATION, 2019-2035 (USD BILLIONS)
      19. TABLE 18. EUROPE COMMERCIAL EARTH OBSERVATION (CEO) MARKET SIZE ESTIMATES & FORECAST, BY DATA TYPE, 2019-2035 (USD BILLIONS)
      20. TABLE 19. EUROPE COMMERCIAL EARTH OBSERVATION (CEO) MARKET SIZE ESTIMATES & FORECAST, BY END USE, 2019-2035 (USD BILLIONS)
      21. TABLE 20. EUROPE COMMERCIAL EARTH OBSERVATION (CEO) MARKET SIZE ESTIMATES & FORECAST, BY DEPLOYMENT MODEL, 2019-2035 (USD BILLIONS)
      22. TABLE 21. EUROPE COMMERCIAL EARTH OBSERVATION (CEO) MARKET SIZE ESTIMATES & FORECAST, BY REGIONAL, 2019-2035 (USD BILLIONS)
      23. TABLE 22. GERMANY COMMERCIAL EARTH OBSERVATION (CEO) MARKET SIZE ESTIMATES & FORECAST, BY APPLICATION, 2019-2035 (USD BILLIONS)
      24. TABLE 23. GERMANY COMMERCIAL EARTH OBSERVATION (CEO) MARKET SIZE ESTIMATES & FORECAST, BY DATA TYPE, 2019-2035 (USD BILLIONS)
      25. TABLE 24. GERMANY COMMERCIAL EARTH OBSERVATION (CEO) MARKET SIZE ESTIMATES & FORECAST, BY END USE, 2019-2035 (USD BILLIONS)
      26. TABLE 25. GERMANY COMMERCIAL EARTH OBSERVATION (CEO) MARKET SIZE ESTIMATES & FORECAST, BY DEPLOYMENT MODEL, 2019-2035 (USD BILLIONS)
      27. TABLE 26. GERMANY COMMERCIAL EARTH OBSERVATION (CEO) MARKET SIZE ESTIMATES & FORECAST, BY REGIONAL, 2019-2035 (USD BILLIONS)
      28. TABLE 27. UK COMMERCIAL EARTH OBSERVATION (CEO) MARKET SIZE ESTIMATES & FORECAST, BY APPLICATION, 2019-2035 (USD BILLIONS)
      29. TABLE 28. UK COMMERCIAL EARTH OBSERVATION (CEO) MARKET SIZE ESTIMATES & FORECAST, BY DATA TYPE, 2019-2035 (USD BILLIONS)
      30. TABLE 29. UK COMMERCIAL EARTH OBSERVATION (CEO) MARKET SIZE ESTIMATES & FORECAST, BY END USE, 2019-2035 (USD BILLIONS)
      31. TABLE 30. UK COMMERCIAL EARTH OBSERVATION (CEO) MARKET SIZE ESTIMATES & FORECAST, BY DEPLOYMENT MODEL, 2019-2035 (USD BILLIONS)
      32. TABLE 31. UK COMMERCIAL EARTH OBSERVATION (CEO) MARKET SIZE ESTIMATES & FORECAST, BY REGIONAL, 2019-2035 (USD BILLIONS)
      33. TABLE 32. FRANCE COMMERCIAL EARTH OBSERVATION (CEO) MARKET SIZE ESTIMATES & FORECAST, BY APPLICATION, 2019-2035 (USD BILLIONS)
      34. TABLE 33. FRANCE COMMERCIAL EARTH OBSERVATION (CEO) MARKET SIZE ESTIMATES & FORECAST, BY DATA TYPE, 2019-2035 (USD BILLIONS)
      35. TABLE 34. FRANCE COMMERCIAL EARTH OBSERVATION (CEO) MARKET SIZE ESTIMATES & FORECAST, BY END USE, 2019-2035 (USD BILLIONS)
      36. TABLE 35. FRANCE COMMERCIAL EARTH OBSERVATION (CEO) MARKET SIZE ESTIMATES & FORECAST, BY DEPLOYMENT MODEL, 2019-2035 (USD BILLIONS)
      37. TABLE 36. FRANCE COMMERCIAL EARTH OBSERVATION (CEO) MARKET SIZE ESTIMATES & FORECAST, BY REGIONAL, 2019-2035 (USD BILLIONS)
      38. TABLE 37. RUSSIA COMMERCIAL EARTH OBSERVATION (CEO) MARKET SIZE ESTIMATES & FORECAST, BY APPLICATION, 2019-2035 (USD BILLIONS)
      39. TABLE 38. RUSSIA COMMERCIAL EARTH OBSERVATION (CEO) MARKET SIZE ESTIMATES & FORECAST, BY DATA TYPE, 2019-2035 (USD BILLIONS)
      40. TABLE 39. RUSSIA COMMERCIAL EARTH OBSERVATION (CEO) MARKET SIZE ESTIMATES & FORECAST, BY END USE, 2019-2035 (USD BILLIONS)
      41. TABLE 40. RUSSIA COMMERCIAL EARTH OBSERVATION (CEO) MARKET SIZE ESTIMATES & FORECAST, BY DEPLOYMENT MODEL, 2019-2035 (USD BILLIONS)
      42. TABLE 41. RUSSIA COMMERCIAL EARTH OBSERVATION (CEO) MARKET SIZE ESTIMATES & FORECAST, BY REGIONAL, 2019-2035 (USD BILLIONS)
      43. TABLE 42. ITALY COMMERCIAL EARTH OBSERVATION (CEO) MARKET SIZE ESTIMATES & FORECAST, BY APPLICATION, 2019-2035 (USD BILLIONS)
      44. TABLE 43. ITALY COMMERCIAL EARTH OBSERVATION (CEO) MARKET SIZE ESTIMATES & FORECAST, BY DATA TYPE, 2019-2035 (USD BILLIONS)
      45. TABLE 44. ITALY COMMERCIAL EARTH OBSERVATION (CEO) MARKET SIZE ESTIMATES & FORECAST, BY END USE, 2019-2035 (USD BILLIONS)
      46. TABLE 45. ITALY COMMERCIAL EARTH OBSERVATION (CEO) MARKET SIZE ESTIMATES & FORECAST, BY DEPLOYMENT MODEL, 2019-2035 (USD BILLIONS)
      47. TABLE 46. ITALY COMMERCIAL EARTH OBSERVATION (CEO) MARKET SIZE ESTIMATES & FORECAST, BY REGIONAL, 2019-2035 (USD BILLIONS)
      48. TABLE 47. SPAIN COMMERCIAL EARTH OBSERVATION (CEO) MARKET SIZE ESTIMATES & FORECAST, BY APPLICATION, 2019-2035 (USD BILLIONS)
      49. TABLE 48. SPAIN COMMERCIAL EARTH OBSERVATION (CEO) MARKET SIZE ESTIMATES & FORECAST, BY DATA TYPE, 2019-2035 (USD BILLIONS)
      50. TABLE 49. SPAIN COMMERCIAL EARTH OBSERVATION (CEO) MARKET SIZE ESTIMATES & FORECAST, BY END USE, 2019-2035 (USD BILLIONS)
      51. TABLE 50. SPAIN COMMERCIAL EARTH OBSERVATION (CEO) MARKET SIZE ESTIMATES & FORECAST, BY DEPLOYMENT MODEL, 2019-2035 (USD BILLIONS)
      52. TABLE 51. SPAIN COMMERCIAL EARTH OBSERVATION (CEO) MARKET SIZE ESTIMATES & FORECAST, BY REGIONAL, 2019-2035 (USD BILLIONS)
      53. TABLE 52. REST OF EUROPE COMMERCIAL EARTH OBSERVATION (CEO) MARKET SIZE ESTIMATES & FORECAST, BY APPLICATION, 2019-2035 (USD BILLIONS)
      54. TABLE 53. REST OF EUROPE COMMERCIAL EARTH OBSERVATION (CEO) MARKET SIZE ESTIMATES & FORECAST, BY DATA TYPE, 2019-2035 (USD BILLIONS)
      55. TABLE 54. REST OF EUROPE COMMERCIAL EARTH OBSERVATION (CEO) MARKET SIZE ESTIMATES & FORECAST, BY END USE, 2019-2035 (USD BILLIONS)
      56. TABLE 55. REST OF EUROPE COMMERCIAL EARTH OBSERVATION (CEO) MARKET SIZE ESTIMATES & FORECAST, BY DEPLOYMENT MODEL, 2019-2035 (USD BILLIONS)
      57. TABLE 56. REST OF EUROPE COMMERCIAL EARTH OBSERVATION (CEO) MARKET SIZE ESTIMATES & FORECAST, BY REGIONAL, 2019-2035 (USD BILLIONS)
      58. TABLE 57. APAC COMMERCIAL EARTH OBSERVATION (CEO) MARKET SIZE ESTIMATES & FORECAST, BY APPLICATION, 2019-2035 (USD BILLIONS)
      59. TABLE 58. APAC COMMERCIAL EARTH OBSERVATION (CEO) MARKET SIZE ESTIMATES & FORECAST, BY DATA TYPE, 2019-2035 (USD BILLIONS)
      60. TABLE 59. APAC COMMERCIAL EARTH OBSERVATION (CEO) MARKET SIZE ESTIMATES & FORECAST, BY END USE, 2019-2035 (USD BILLIONS)
      61. TABLE 60. APAC COMMERCIAL EARTH OBSERVATION (CEO) MARKET SIZE ESTIMATES & FORECAST, BY DEPLOYMENT MODEL, 2019-2035 (USD BILLIONS)
      62. TABLE 61. APAC COMMERCIAL EARTH OBSERVATION (CEO) MARKET SIZE ESTIMATES & FORECAST, BY REGIONAL, 2019-2035 (USD BILLIONS)
      63. TABLE 62. CHINA COMMERCIAL EARTH OBSERVATION (CEO) MARKET SIZE ESTIMATES & FORECAST, BY APPLICATION, 2019-2035 (USD BILLIONS)
      64. TABLE 63. CHINA COMMERCIAL EARTH OBSERVATION (CEO) MARKET SIZE ESTIMATES & FORECAST, BY DATA TYPE, 2019-2035 (USD BILLIONS)
      65. TABLE 64. CHINA COMMERCIAL EARTH OBSERVATION (CEO) MARKET SIZE ESTIMATES & FORECAST, BY END USE, 2019-2035 (USD BILLIONS)
      66. TABLE 65. CHINA COMMERCIAL EARTH OBSERVATION (CEO) MARKET SIZE ESTIMATES & FORECAST, BY DEPLOYMENT MODEL, 2019-2035 (USD BILLIONS)
      67. TABLE 66. CHINA COMMERCIAL EARTH OBSERVATION (CEO) MARKET SIZE ESTIMATES & FORECAST, BY REGIONAL, 2019-2035 (USD BILLIONS)
      68. TABLE 67. INDIA COMMERCIAL EARTH OBSERVATION (CEO) MARKET SIZE ESTIMATES & FORECAST, BY APPLICATION, 2019-2035 (USD BILLIONS)
      69. TABLE 68. INDIA COMMERCIAL EARTH OBSERVATION (CEO) MARKET SIZE ESTIMATES & FORECAST, BY DATA TYPE, 2019-2035 (USD BILLIONS)
      70. TABLE 69. INDIA COMMERCIAL EARTH OBSERVATION (CEO) MARKET SIZE ESTIMATES & FORECAST, BY END USE, 2019-2035 (USD BILLIONS)
      71. TABLE 70. INDIA COMMERCIAL EARTH OBSERVATION (CEO) MARKET SIZE ESTIMATES & FORECAST, BY DEPLOYMENT MODEL, 2019-2035 (USD BILLIONS)
      72. TABLE 71. INDIA COMMERCIAL EARTH OBSERVATION (CEO) MARKET SIZE ESTIMATES & FORECAST, BY REGIONAL, 2019-2035 (USD BILLIONS)
      73. TABLE 72. JAPAN COMMERCIAL EARTH OBSERVATION (CEO) MARKET SIZE ESTIMATES & FORECAST, BY APPLICATION, 2019-2035 (USD BILLIONS)
      74. TABLE 73. JAPAN COMMERCIAL EARTH OBSERVATION (CEO) MARKET SIZE ESTIMATES & FORECAST, BY DATA TYPE, 2019-2035 (USD BILLIONS)
      75. TABLE 74. JAPAN COMMERCIAL EARTH OBSERVATION (CEO) MARKET SIZE ESTIMATES & FORECAST, BY END USE, 2019-2035 (USD BILLIONS)
      76. TABLE 75. JAPAN COMMERCIAL EARTH OBSERVATION (CEO) MARKET SIZE ESTIMATES & FORECAST, BY DEPLOYMENT MODEL, 2019-2035 (USD BILLIONS)
      77. TABLE 76. JAPAN COMMERCIAL EARTH OBSERVATION (CEO) MARKET SIZE ESTIMATES & FORECAST, BY REGIONAL, 2019-2035 (USD BILLIONS)
      78. TABLE 77. SOUTH KOREA COMMERCIAL EARTH OBSERVATION (CEO) MARKET SIZE ESTIMATES & FORECAST, BY APPLICATION, 2019-2035 (USD BILLIONS)
      79. TABLE 78. SOUTH KOREA COMMERCIAL EARTH OBSERVATION (CEO) MARKET SIZE ESTIMATES & FORECAST, BY DATA TYPE, 2019-2035 (USD BILLIONS)
      80. TABLE 79. SOUTH KOREA COMMERCIAL EARTH OBSERVATION (CEO) MARKET SIZE ESTIMATES & FORECAST, BY END USE, 2019-2035 (USD BILLIONS)
      81. TABLE 80. SOUTH KOREA COMMERCIAL EARTH OBSERVATION (CEO) MARKET SIZE ESTIMATES & FORECAST, BY DEPLOYMENT MODEL, 2019-2035 (USD BILLIONS)
      82. TABLE 81. SOUTH KOREA COMMERCIAL EARTH OBSERVATION (CEO) MARKET SIZE ESTIMATES & FORECAST, BY REGIONAL, 2019-2035 (USD BILLIONS)
      83. TABLE 82. MALAYSIA COMMERCIAL EARTH OBSERVATION (CEO) MARKET SIZE ESTIMATES & FORECAST, BY APPLICATION, 2019-2035 (USD BILLIONS)
      84. TABLE 83. MALAYSIA COMMERCIAL EARTH OBSERVATION (CEO) MARKET SIZE ESTIMATES & FORECAST, BY DATA TYPE, 2019-2035 (USD BILLIONS)
      85. TABLE 84. MALAYSIA COMMERCIAL EARTH OBSERVATION (CEO) MARKET SIZE ESTIMATES & FORECAST, BY END USE, 2019-2035 (USD BILLIONS)
      86. TABLE 85. MALAYSIA COMMERCIAL EARTH OBSERVATION (CEO) MARKET SIZE ESTIMATES & FORECAST, BY DEPLOYMENT MODEL, 2019-2035 (USD BILLIONS)
      87. TABLE 86. MALAYSIA COMMERCIAL EARTH OBSERVATION (CEO) MARKET SIZE ESTIMATES & FORECAST, BY REGIONAL, 2019-2035 (USD BILLIONS)
      88. TABLE 87. THAILAND COMMERCIAL EARTH OBSERVATION (CEO) MARKET SIZE ESTIMATES & FORECAST, BY APPLICATION, 2019-2035 (USD BILLIONS)
      89. TABLE 88. THAILAND COMMERCIAL EARTH OBSERVATION (CEO) MARKET SIZE ESTIMATES & FORECAST, BY DATA TYPE, 2019-2035 (USD BILLIONS)
      90. TABLE 89. THAILAND COMMERCIAL EARTH OBSERVATION (CEO) MARKET SIZE ESTIMATES & FORECAST, BY END USE, 2019-2035 (USD BILLIONS)
      91. TABLE 90. THAILAND COMMERCIAL EARTH OBSERVATION (CEO) MARKET SIZE ESTIMATES & FORECAST, BY DEPLOYMENT MODEL, 2019-2035 (USD BILLIONS)
      92. TABLE 91. THAILAND COMMERCIAL EARTH OBSERVATION (CEO) MARKET SIZE ESTIMATES & FORECAST, BY REGIONAL, 2019-2035 (USD BILLIONS)
      93. TABLE 92. INDONESIA COMMERCIAL EARTH OBSERVATION (CEO) MARKET SIZE ESTIMATES & FORECAST, BY APPLICATION, 2019-2035 (USD BILLIONS)
      94. TABLE 93. INDONESIA COMMERCIAL EARTH OBSERVATION (CEO) MARKET SIZE ESTIMATES & FORECAST, BY DATA TYPE, 2019-2035 (USD BILLIONS)
      95. TABLE 94. INDONESIA COMMERCIAL EARTH OBSERVATION (CEO) MARKET SIZE ESTIMATES & FORECAST, BY END USE, 2019-2035 (USD BILLIONS)
      96. TABLE 95. INDONESIA COMMERCIAL EARTH OBSERVATION (CEO) MARKET SIZE ESTIMATES & FORECAST, BY DEPLOYMENT MODEL, 2019-2035 (USD BILLIONS)
      97. TABLE 96. INDONESIA COMMERCIAL EARTH OBSERVATION (CEO) MARKET SIZE ESTIMATES & FORECAST, BY REGIONAL, 2019-2035 (USD BILLIONS)
      98. TABLE 97. REST OF APAC COMMERCIAL EARTH OBSERVATION (CEO) MARKET SIZE ESTIMATES & FORECAST, BY APPLICATION, 2019-2035 (USD BILLIONS)
      99. TABLE 98. REST OF APAC COMMERCIAL EARTH OBSERVATION (CEO) MARKET SIZE ESTIMATES & FORECAST, BY DATA TYPE, 2019-2035 (USD BILLIONS)
      100. TABLE 99. REST OF APAC COMMERCIAL EARTH OBSERVATION (CEO) MARKET SIZE ESTIMATES & FORECAST, BY END USE, 2019-2035 (USD BILLIONS)
      101. TABLE 100. REST OF APAC COMMERCIAL EARTH OBSERVATION (CEO) MARKET SIZE ESTIMATES & FORECAST, BY DEPLOYMENT MODEL, 2019-2035 (USD BILLIONS)
      102. TABLE 101. REST OF APAC COMMERCIAL EARTH OBSERVATION (CEO) MARKET SIZE ESTIMATES & FORECAST, BY REGIONAL, 2019-2035 (USD BILLIONS)
      103. TABLE 102. SOUTH AMERICA COMMERCIAL EARTH OBSERVATION (CEO) MARKET SIZE ESTIMATES & FORECAST, BY APPLICATION, 2019-2035 (USD BILLIONS)
      104. TABLE 103. SOUTH AMERICA COMMERCIAL EARTH OBSERVATION (CEO) MARKET SIZE ESTIMATES & FORECAST, BY DATA TYPE, 2019-2035 (USD BILLIONS)
      105. TABLE 104. SOUTH AMERICA COMMERCIAL EARTH OBSERVATION (CEO) MARKET SIZE ESTIMATES & FORECAST, BY END USE, 2019-2035 (USD BILLIONS)
      106. TABLE 105. SOUTH AMERICA COMMERCIAL EARTH OBSERVATION (CEO) MARKET SIZE ESTIMATES & FORECAST, BY DEPLOYMENT MODEL, 2019-2035 (USD BILLIONS)
      107. TABLE 106. SOUTH AMERICA COMMERCIAL EARTH OBSERVATION (CEO) MARKET SIZE ESTIMATES & FORECAST, BY REGIONAL, 2019-2035 (USD BILLIONS)
      108. TABLE 107. BRAZIL COMMERCIAL EARTH OBSERVATION (CEO) MARKET SIZE ESTIMATES & FORECAST, BY APPLICATION, 2019-2035 (USD BILLIONS)
      109. TABLE 108. BRAZIL COMMERCIAL EARTH OBSERVATION (CEO) MARKET SIZE ESTIMATES & FORECAST, BY DATA TYPE, 2019-2035 (USD BILLIONS)
      110. TABLE 109. BRAZIL COMMERCIAL EARTH OBSERVATION (CEO) MARKET SIZE ESTIMATES & FORECAST, BY END USE, 2019-2035 (USD BILLIONS)
      111. TABLE 110. BRAZIL COMMERCIAL EARTH OBSERVATION (CEO) MARKET SIZE ESTIMATES & FORECAST, BY DEPLOYMENT MODEL, 2019-2035 (USD BILLIONS)
      112. TABLE 111. BRAZIL COMMERCIAL EARTH OBSERVATION (CEO) MARKET SIZE ESTIMATES & FORECAST, BY REGIONAL, 2019-2035 (USD BILLIONS)
      113. TABLE 112. MEXICO COMMERCIAL EARTH OBSERVATION (CEO) MARKET SIZE ESTIMATES & FORECAST, BY APPLICATION, 2019-2035 (USD BILLIONS)
      114. TABLE 113. MEXICO COMMERCIAL EARTH OBSERVATION (CEO) MARKET SIZE ESTIMATES & FORECAST, BY DATA TYPE, 2019-2035 (USD BILLIONS)
      115. TABLE 114. MEXICO COMMERCIAL EARTH OBSERVATION (CEO) MARKET SIZE ESTIMATES & FORECAST, BY END USE, 2019-2035 (USD BILLIONS)
      116. TABLE 115. MEXICO COMMERCIAL EARTH OBSERVATION (CEO) MARKET SIZE ESTIMATES & FORECAST, BY DEPLOYMENT MODEL, 2019-2035 (USD BILLIONS)
      117. TABLE 116. MEXICO COMMERCIAL EARTH OBSERVATION (CEO) MARKET SIZE ESTIMATES & FORECAST, BY REGIONAL, 2019-2035 (USD BILLIONS)
      118. TABLE 117. ARGENTINA COMMERCIAL EARTH OBSERVATION (CEO) MARKET SIZE ESTIMATES & FORECAST, BY APPLICATION, 2019-2035 (USD BILLIONS)
      119. TABLE 118. ARGENTINA COMMERCIAL EARTH OBSERVATION (CEO) MARKET SIZE ESTIMATES & FORECAST, BY DATA TYPE, 2019-2035 (USD BILLIONS)
      120. TABLE 119. ARGENTINA COMMERCIAL EARTH OBSERVATION (CEO) MARKET SIZE ESTIMATES & FORECAST, BY END USE, 2019-2035 (USD BILLIONS)
      121. TABLE 120. ARGENTINA COMMERCIAL EARTH OBSERVATION (CEO) MARKET SIZE ESTIMATES & FORECAST, BY DEPLOYMENT MODEL, 2019-2035 (USD BILLIONS)
      122. TABLE 121. ARGENTINA COMMERCIAL EARTH OBSERVATION (CEO) MARKET SIZE ESTIMATES & FORECAST, BY REGIONAL, 2019-2035 (USD BILLIONS)
      123. TABLE 122. REST OF SOUTH AMERICA COMMERCIAL EARTH OBSERVATION (CEO) MARKET SIZE ESTIMATES & FORECAST, BY APPLICATION, 2019-2035 (USD BILLIONS)
      124. TABLE 123. REST OF SOUTH AMERICA COMMERCIAL EARTH OBSERVATION (CEO) MARKET SIZE ESTIMATES & FORECAST, BY DATA TYPE, 2019-2035 (USD BILLIONS)
      125. TABLE 124. REST OF SOUTH AMERICA COMMERCIAL EARTH OBSERVATION (CEO) MARKET SIZE ESTIMATES & FORECAST, BY END USE, 2019-2035 (USD BILLIONS)
      126. TABLE 125. REST OF SOUTH AMERICA COMMERCIAL EARTH OBSERVATION (CEO) MARKET SIZE ESTIMATES & FORECAST, BY DEPLOYMENT MODEL, 2019-2035 (USD BILLIONS)
      127. TABLE 126. REST OF SOUTH AMERICA COMMERCIAL EARTH OBSERVATION (CEO) MARKET SIZE ESTIMATES & FORECAST, BY REGIONAL, 2019-2035 (USD BILLIONS)
      128. TABLE 127. MEA COMMERCIAL EARTH OBSERVATION (CEO) MARKET SIZE ESTIMATES & FORECAST, BY APPLICATION, 2019-2035 (USD BILLIONS)
      129. TABLE 128. MEA COMMERCIAL EARTH OBSERVATION (CEO) MARKET SIZE ESTIMATES & FORECAST, BY DATA TYPE, 2019-2035 (USD BILLIONS)
      130. TABLE 129. MEA COMMERCIAL EARTH OBSERVATION (CEO) MARKET SIZE ESTIMATES & FORECAST, BY END USE, 2019-2035 (USD BILLIONS)
      131. TABLE 130. MEA COMMERCIAL EARTH OBSERVATION (CEO) MARKET SIZE ESTIMATES & FORECAST, BY DEPLOYMENT MODEL, 2019-2035 (USD BILLIONS)
      132. TABLE 131. MEA COMMERCIAL EARTH OBSERVATION (CEO) MARKET SIZE ESTIMATES & FORECAST, BY REGIONAL, 2019-2035 (USD BILLIONS)
      133. TABLE 132. GCC COUNTRIES COMMERCIAL EARTH OBSERVATION (CEO) MARKET SIZE ESTIMATES & FORECAST, BY APPLICATION, 2019-2035 (USD BILLIONS)
      134. TABLE 133. GCC COUNTRIES COMMERCIAL EARTH OBSERVATION (CEO) MARKET SIZE ESTIMATES & FORECAST, BY DATA TYPE, 2019-2035 (USD BILLIONS)
      135. TABLE 134. GCC COUNTRIES COMMERCIAL EARTH OBSERVATION (CEO) MARKET SIZE ESTIMATES & FORECAST, BY END USE, 2019-2035 (USD BILLIONS)
      136. TABLE 135. GCC COUNTRIES COMMERCIAL EARTH OBSERVATION (CEO) MARKET SIZE ESTIMATES & FORECAST, BY DEPLOYMENT MODEL, 2019-2035 (USD BILLIONS)
      137. TABLE 136. GCC COUNTRIES COMMERCIAL EARTH OBSERVATION (CEO) MARKET SIZE ESTIMATES & FORECAST, BY REGIONAL, 2019-2035 (USD BILLIONS)
      138. TABLE 137. SOUTH AFRICA COMMERCIAL EARTH OBSERVATION (CEO) MARKET SIZE ESTIMATES & FORECAST, BY APPLICATION, 2019-2035 (USD BILLIONS)
      139. TABLE 138. SOUTH AFRICA COMMERCIAL EARTH OBSERVATION (CEO) MARKET SIZE ESTIMATES & FORECAST, BY DATA TYPE, 2019-2035 (USD BILLIONS)
      140. TABLE 139. SOUTH AFRICA COMMERCIAL EARTH OBSERVATION (CEO) MARKET SIZE ESTIMATES & FORECAST, BY END USE, 2019-2035 (USD BILLIONS)
      141. TABLE 140. SOUTH AFRICA COMMERCIAL EARTH OBSERVATION (CEO) MARKET SIZE ESTIMATES & FORECAST, BY DEPLOYMENT MODEL, 2019-2035 (USD BILLIONS)
      142. TABLE 141. SOUTH AFRICA COMMERCIAL EARTH OBSERVATION (CEO) MARKET SIZE ESTIMATES & FORECAST, BY REGIONAL, 2019-2035 (USD BILLIONS)
      143. TABLE 142. REST OF MEA COMMERCIAL EARTH OBSERVATION (CEO) MARKET SIZE ESTIMATES & FORECAST, BY APPLICATION, 2019-2035 (USD BILLIONS)
      144. TABLE 143. REST OF MEA COMMERCIAL EARTH OBSERVATION (CEO) MARKET SIZE ESTIMATES & FORECAST, BY DATA TYPE, 2019-2035 (USD BILLIONS)
      145. TABLE 144. REST OF MEA COMMERCIAL EARTH OBSERVATION (CEO) MARKET SIZE ESTIMATES & FORECAST, BY END USE, 2019-2035 (USD BILLIONS)
      146. TABLE 145. REST OF MEA COMMERCIAL EARTH OBSERVATION (CEO) MARKET SIZE ESTIMATES & FORECAST, BY DEPLOYMENT MODEL, 2019-2035 (USD BILLIONS)
      147. TABLE 146. REST OF MEA COMMERCIAL EARTH OBSERVATION (CEO) MARKET SIZE ESTIMATES & FORECAST, BY REGIONAL, 2019-2035 (USD BILLIONS)
      148. TABLE 147. PRODUCT LAUNCH/PRODUCT DEVELOPMENT/APPROVAL
      149. TABLE 148. ACQUISITION/PARTNERSHIP   LIST OF FIGURES
      150. FIGURE 1. MARKET SYNOPSIS
      151. FIGURE 2. NORTH AMERICA COMMERCIAL EARTH OBSERVATION (CEO) MARKET ANALYSIS
      152. FIGURE 3. US COMMERCIAL EARTH OBSERVATION (CEO) MARKET ANALYSIS BY APPLICATION
      153. FIGURE 4. US COMMERCIAL EARTH OBSERVATION (CEO) MARKET ANALYSIS BY DATA TYPE
      154. FIGURE 5. US COMMERCIAL EARTH OBSERVATION (CEO) MARKET ANALYSIS BY END USE
      155. FIGURE 6. US COMMERCIAL EARTH OBSERVATION (CEO) MARKET ANALYSIS BY DEPLOYMENT MODEL
      156. FIGURE 7. US COMMERCIAL EARTH OBSERVATION (CEO) MARKET ANALYSIS BY REGIONAL
      157. FIGURE 8. CANADA COMMERCIAL EARTH OBSERVATION (CEO) MARKET ANALYSIS BY APPLICATION
      158. FIGURE 9. CANADA COMMERCIAL EARTH OBSERVATION (CEO) MARKET ANALYSIS BY DATA TYPE
      159. FIGURE 10. CANADA COMMERCIAL EARTH OBSERVATION (CEO) MARKET ANALYSIS BY END USE
      160. FIGURE 11. CANADA COMMERCIAL EARTH OBSERVATION (CEO) MARKET ANALYSIS BY DEPLOYMENT MODEL
      161. FIGURE 12. CANADA COMMERCIAL EARTH OBSERVATION (CEO) MARKET ANALYSIS BY REGIONAL
      162. FIGURE 13. EUROPE COMMERCIAL EARTH OBSERVATION (CEO) MARKET ANALYSIS
      163. FIGURE 14. GERMANY COMMERCIAL EARTH OBSERVATION (CEO) MARKET ANALYSIS BY APPLICATION
      164. FIGURE 15. GERMANY COMMERCIAL EARTH OBSERVATION (CEO) MARKET ANALYSIS BY DATA TYPE
      165. FIGURE 16. GERMANY COMMERCIAL EARTH OBSERVATION (CEO) MARKET ANALYSIS BY END USE
      166. FIGURE 17. GERMANY COMMERCIAL EARTH OBSERVATION (CEO) MARKET ANALYSIS BY DEPLOYMENT MODEL
      167. FIGURE 18. GERMANY COMMERCIAL EARTH OBSERVATION (CEO) MARKET ANALYSIS BY REGIONAL
      168. FIGURE 19. UK COMMERCIAL EARTH OBSERVATION (CEO) MARKET ANALYSIS BY APPLICATION
      169. FIGURE 20. UK COMMERCIAL EARTH OBSERVATION (CEO) MARKET ANALYSIS BY DATA TYPE
      170. FIGURE 21. UK COMMERCIAL EARTH OBSERVATION (CEO) MARKET ANALYSIS BY END USE
      171. FIGURE 22. UK COMMERCIAL EARTH OBSERVATION (CEO) MARKET ANALYSIS BY DEPLOYMENT MODEL
      172. FIGURE 23. UK COMMERCIAL EARTH OBSERVATION (CEO) MARKET ANALYSIS BY REGIONAL
      173. FIGURE 24. FRANCE COMMERCIAL EARTH OBSERVATION (CEO) MARKET ANALYSIS BY APPLICATION
      174. FIGURE 25. FRANCE COMMERCIAL EARTH OBSERVATION (CEO) MARKET ANALYSIS BY DATA TYPE
      175. FIGURE 26. FRANCE COMMERCIAL EARTH OBSERVATION (CEO) MARKET ANALYSIS BY END USE
      176. FIGURE 27. FRANCE COMMERCIAL EARTH OBSERVATION (CEO) MARKET ANALYSIS BY DEPLOYMENT MODEL
      177. FIGURE 28. FRANCE COMMERCIAL EARTH OBSERVATION (CEO) MARKET ANALYSIS BY REGIONAL
      178. FIGURE 29. RUSSIA COMMERCIAL EARTH OBSERVATION (CEO) MARKET ANALYSIS BY APPLICATION
      179. FIGURE 30. RUSSIA COMMERCIAL EARTH OBSERVATION (CEO) MARKET ANALYSIS BY DATA TYPE
      180. FIGURE 31. RUSSIA COMMERCIAL EARTH OBSERVATION (CEO) MARKET ANALYSIS BY END USE
      181. FIGURE 32. RUSSIA COMMERCIAL EARTH OBSERVATION (CEO) MARKET ANALYSIS BY DEPLOYMENT MODEL
      182. FIGURE 33. RUSSIA COMMERCIAL EARTH OBSERVATION (CEO) MARKET ANALYSIS BY REGIONAL
      183. FIGURE 34. ITALY COMMERCIAL EARTH OBSERVATION (CEO) MARKET ANALYSIS BY APPLICATION
      184. FIGURE 35. ITALY COMMERCIAL EARTH OBSERVATION (CEO) MARKET ANALYSIS BY DATA TYPE
      185. FIGURE 36. ITALY COMMERCIAL EARTH OBSERVATION (CEO) MARKET ANALYSIS BY END USE
      186. FIGURE 37. ITALY COMMERCIAL EARTH OBSERVATION (CEO) MARKET ANALYSIS BY DEPLOYMENT MODEL
      187. FIGURE 38. ITALY COMMERCIAL EARTH OBSERVATION (CEO) MARKET ANALYSIS BY REGIONAL
      188. FIGURE 39. SPAIN COMMERCIAL EARTH OBSERVATION (CEO) MARKET ANALYSIS BY APPLICATION
      189. FIGURE 40. SPAIN COMMERCIAL EARTH OBSERVATION (CEO) MARKET ANALYSIS BY DATA TYPE
      190. FIGURE 41. SPAIN COMMERCIAL EARTH OBSERVATION (CEO) MARKET ANALYSIS BY END USE
      191. FIGURE 42. SPAIN COMMERCIAL EARTH OBSERVATION (CEO) MARKET ANALYSIS BY DEPLOYMENT MODEL
      192. FIGURE 43. SPAIN COMMERCIAL EARTH OBSERVATION (CEO) MARKET ANALYSIS BY REGIONAL
      193. FIGURE 44. REST OF EUROPE COMMERCIAL EARTH OBSERVATION (CEO) MARKET ANALYSIS BY APPLICATION
      194. FIGURE 45. REST OF EUROPE COMMERCIAL EARTH OBSERVATION (CEO) MARKET ANALYSIS BY DATA TYPE
      195. FIGURE 46. REST OF EUROPE COMMERCIAL EARTH OBSERVATION (CEO) MARKET ANALYSIS BY END USE
      196. FIGURE 47. REST OF EUROPE COMMERCIAL EARTH OBSERVATION (CEO) MARKET ANALYSIS BY DEPLOYMENT MODEL
      197. FIGURE 48. REST OF EUROPE COMMERCIAL EARTH OBSERVATION (CEO) MARKET ANALYSIS BY REGIONAL
      198. FIGURE 49. APAC COMMERCIAL EARTH OBSERVATION (CEO) MARKET ANALYSIS
      199. FIGURE 50. CHINA COMMERCIAL EARTH OBSERVATION (CEO) MARKET ANALYSIS BY APPLICATION
      200. FIGURE 51. CHINA COMMERCIAL EARTH OBSERVATION (CEO) MARKET ANALYSIS BY DATA TYPE
      201. FIGURE 52. CHINA COMMERCIAL EARTH OBSERVATION (CEO) MARKET ANALYSIS BY END USE
      202. FIGURE 53. CHINA COMMERCIAL EARTH OBSERVATION (CEO) MARKET ANALYSIS BY DEPLOYMENT MODEL
      203. FIGURE 54. CHINA COMMERCIAL EARTH OBSERVATION (CEO) MARKET ANALYSIS BY REGIONAL
      204. FIGURE 55. INDIA COMMERCIAL EARTH OBSERVATION (CEO) MARKET ANALYSIS BY APPLICATION
      205. FIGURE 56. INDIA COMMERCIAL EARTH OBSERVATION (CEO) MARKET ANALYSIS BY DATA TYPE
      206. FIGURE 57. INDIA COMMERCIAL EARTH OBSERVATION (CEO) MARKET ANALYSIS BY END USE
      207. FIGURE 58. INDIA COMMERCIAL EARTH OBSERVATION (CEO) MARKET ANALYSIS BY DEPLOYMENT MODEL
      208. FIGURE 59. INDIA COMMERCIAL EARTH OBSERVATION (CEO) MARKET ANALYSIS BY REGIONAL
      209. FIGURE 60. JAPAN COMMERCIAL EARTH OBSERVATION (CEO) MARKET ANALYSIS BY APPLICATION
      210. FIGURE 61. JAPAN COMMERCIAL EARTH OBSERVATION (CEO) MARKET ANALYSIS BY DATA TYPE
      211. FIGURE 62. JAPAN COMMERCIAL EARTH OBSERVATION (CEO) MARKET ANALYSIS BY END USE
      212. FIGURE 63. JAPAN COMMERCIAL EARTH OBSERVATION (CEO) MARKET ANALYSIS BY DEPLOYMENT MODEL
      213. FIGURE 64. JAPAN COMMERCIAL EARTH OBSERVATION (CEO) MARKET ANALYSIS BY REGIONAL
      214. FIGURE 65. SOUTH KOREA COMMERCIAL EARTH OBSERVATION (CEO) MARKET ANALYSIS BY APPLICATION
      215. FIGURE 66. SOUTH KOREA COMMERCIAL EARTH OBSERVATION (CEO) MARKET ANALYSIS BY DATA TYPE
      216. FIGURE 67. SOUTH KOREA COMMERCIAL EARTH OBSERVATION (CEO) MARKET ANALYSIS BY END USE
      217. FIGURE 68. SOUTH KOREA COMMERCIAL EARTH OBSERVATION (CEO) MARKET ANALYSIS BY DEPLOYMENT MODEL
      218. FIGURE 69. SOUTH KOREA COMMERCIAL EARTH OBSERVATION (CEO) MARKET ANALYSIS BY REGIONAL
      219. FIGURE 70. MALAYSIA COMMERCIAL EARTH OBSERVATION (CEO) MARKET ANALYSIS BY APPLICATION
      220. FIGURE 71. MALAYSIA COMMERCIAL EARTH OBSERVATION (CEO) MARKET ANALYSIS BY DATA TYPE
      221. FIGURE 72. MALAYSIA COMMERCIAL EARTH OBSERVATION (CEO) MARKET ANALYSIS BY END USE
      222. FIGURE 73. MALAYSIA COMMERCIAL EARTH OBSERVATION (CEO) MARKET ANALYSIS BY DEPLOYMENT MODEL
      223. FIGURE 74. MALAYSIA COMMERCIAL EARTH OBSERVATION (CEO) MARKET ANALYSIS BY REGIONAL
      224. FIGURE 75. THAILAND COMMERCIAL EARTH OBSERVATION (CEO) MARKET ANALYSIS BY APPLICATION
      225. FIGURE 76. THAILAND COMMERCIAL EARTH OBSERVATION (CEO) MARKET ANALYSIS BY DATA TYPE
      226. FIGURE 77. THAILAND COMMERCIAL EARTH OBSERVATION (CEO) MARKET ANALYSIS BY END USE
      227. FIGURE 78. THAILAND COMMERCIAL EARTH OBSERVATION (CEO) MARKET ANALYSIS BY DEPLOYMENT MODEL
      228. FIGURE 79. THAILAND COMMERCIAL EARTH OBSERVATION (CEO) MARKET ANALYSIS BY REGIONAL
      229. FIGURE 80. INDONESIA COMMERCIAL EARTH OBSERVATION (CEO) MARKET ANALYSIS BY APPLICATION
      230. FIGURE 81. INDONESIA COMMERCIAL EARTH OBSERVATION (CEO) MARKET ANALYSIS BY DATA TYPE
      231. FIGURE 82. INDONESIA COMMERCIAL EARTH OBSERVATION (CEO) MARKET ANALYSIS BY END USE
      232. FIGURE 83. INDONESIA COMMERCIAL EARTH OBSERVATION (CEO) MARKET ANALYSIS BY DEPLOYMENT MODEL
      233. FIGURE 84. INDONESIA COMMERCIAL EARTH OBSERVATION (CEO) MARKET ANALYSIS BY REGIONAL
      234. FIGURE 85. REST OF APAC COMMERCIAL EARTH OBSERVATION (CEO) MARKET ANALYSIS BY APPLICATION
      235. FIGURE 86. REST OF APAC COMMERCIAL EARTH OBSERVATION (CEO) MARKET ANALYSIS BY DATA TYPE
      236. FIGURE 87. REST OF APAC COMMERCIAL EARTH OBSERVATION (CEO) MARKET ANALYSIS BY END USE
      237. FIGURE 88. REST OF APAC COMMERCIAL EARTH OBSERVATION (CEO) MARKET ANALYSIS BY DEPLOYMENT MODEL
      238. FIGURE 89. REST OF APAC COMMERCIAL EARTH OBSERVATION (CEO) MARKET ANALYSIS BY REGIONAL
      239. FIGURE 90. SOUTH AMERICA COMMERCIAL EARTH OBSERVATION (CEO) MARKET ANALYSIS
      240. FIGURE 91. BRAZIL COMMERCIAL EARTH OBSERVATION (CEO) MARKET ANALYSIS BY APPLICATION
      241. FIGURE 92. BRAZIL COMMERCIAL EARTH OBSERVATION (CEO) MARKET ANALYSIS BY DATA TYPE
      242. FIGURE 93. BRAZIL COMMERCIAL EARTH OBSERVATION (CEO) MARKET ANALYSIS BY END USE
      243. FIGURE 94. BRAZIL COMMERCIAL EARTH OBSERVATION (CEO) MARKET ANALYSIS BY DEPLOYMENT MODEL
      244. FIGURE 95. BRAZIL COMMERCIAL EARTH OBSERVATION (CEO) MARKET ANALYSIS BY REGIONAL
      245. FIGURE 96. MEXICO COMMERCIAL EARTH OBSERVATION (CEO) MARKET ANALYSIS BY APPLICATION
      246. FIGURE 97. MEXICO COMMERCIAL EARTH OBSERVATION (CEO) MARKET ANALYSIS BY DATA TYPE
      247. FIGURE 98. MEXICO COMMERCIAL EARTH OBSERVATION (CEO) MARKET ANALYSIS BY END USE
      248. FIGURE 99. MEXICO COMMERCIAL EARTH OBSERVATION (CEO) MARKET ANALYSIS BY DEPLOYMENT MODEL
      249. FIGURE 100. MEXICO COMMERCIAL EARTH OBSERVATION (CEO) MARKET ANALYSIS BY REGIONAL
      250. FIGURE 101. ARGENTINA COMMERCIAL EARTH OBSERVATION (CEO) MARKET ANALYSIS BY APPLICATION
      251. FIGURE 102. ARGENTINA COMMERCIAL EARTH OBSERVATION (CEO) MARKET ANALYSIS BY DATA TYPE
      252. FIGURE 103. ARGENTINA COMMERCIAL EARTH OBSERVATION (CEO) MARKET ANALYSIS BY END USE
      253. FIGURE 104. ARGENTINA COMMERCIAL EARTH OBSERVATION (CEO) MARKET ANALYSIS BY DEPLOYMENT MODEL
      254. FIGURE 105. ARGENTINA COMMERCIAL EARTH OBSERVATION (CEO) MARKET ANALYSIS BY REGIONAL
      255. FIGURE 106. REST OF SOUTH AMERICA COMMERCIAL EARTH OBSERVATION (CEO) MARKET ANALYSIS BY APPLICATION
      256. FIGURE 107. REST OF SOUTH AMERICA COMMERCIAL EARTH OBSERVATION (CEO) MARKET ANALYSIS BY DATA TYPE
      257. FIGURE 108. REST OF SOUTH AMERICA COMMERCIAL EARTH OBSERVATION (CEO) MARKET ANALYSIS BY END USE
      258. FIGURE 109. REST OF SOUTH AMERICA COMMERCIAL EARTH OBSERVATION (CEO) MARKET ANALYSIS BY DEPLOYMENT MODEL
      259. FIGURE 110. REST OF SOUTH AMERICA COMMERCIAL EARTH OBSERVATION (CEO) MARKET ANALYSIS BY REGIONAL
      260. FIGURE 111. MEA COMMERCIAL EARTH OBSERVATION (CEO) MARKET ANALYSIS
      261. FIGURE 112. GCC COUNTRIES COMMERCIAL EARTH OBSERVATION (CEO) MARKET ANALYSIS BY APPLICATION
      262. FIGURE 113. GCC COUNTRIES COMMERCIAL EARTH OBSERVATION (CEO) MARKET ANALYSIS BY DATA TYPE
      263. FIGURE 114. GCC COUNTRIES COMMERCIAL EARTH OBSERVATION (CEO) MARKET ANALYSIS BY END USE
      264. FIGURE 115. GCC COUNTRIES COMMERCIAL EARTH OBSERVATION (CEO) MARKET ANALYSIS BY DEPLOYMENT MODEL
      265. FIGURE 116. GCC COUNTRIES COMMERCIAL EARTH OBSERVATION (CEO) MARKET ANALYSIS BY REGIONAL
      266. FIGURE 117. SOUTH AFRICA COMMERCIAL EARTH OBSERVATION (CEO) MARKET ANALYSIS BY APPLICATION
      267. FIGURE 118. SOUTH AFRICA COMMERCIAL EARTH OBSERVATION (CEO) MARKET ANALYSIS BY DATA TYPE
      268. FIGURE 119. SOUTH AFRICA COMMERCIAL EARTH OBSERVATION (CEO) MARKET ANALYSIS BY END USE
      269. FIGURE 120. SOUTH AFRICA COMMERCIAL EARTH OBSERVATION (CEO) MARKET ANALYSIS BY DEPLOYMENT MODEL
      270. FIGURE 121. SOUTH AFRICA COMMERCIAL EARTH OBSERVATION (CEO) MARKET ANALYSIS BY REGIONAL
      271. FIGURE 122. REST OF MEA COMMERCIAL EARTH OBSERVATION (CEO) MARKET ANALYSIS BY APPLICATION
      272. FIGURE 123. REST OF MEA COMMERCIAL EARTH OBSERVATION (CEO) MARKET ANALYSIS BY DATA TYPE
      273. FIGURE 124. REST OF MEA COMMERCIAL EARTH OBSERVATION (CEO) MARKET ANALYSIS BY END USE
      274. FIGURE 125. REST OF MEA COMMERCIAL EARTH OBSERVATION (CEO) MARKET ANALYSIS BY DEPLOYMENT MODEL
      275. FIGURE 126. REST OF MEA COMMERCIAL EARTH OBSERVATION (CEO) MARKET ANALYSIS BY REGIONAL
      276. FIGURE 127. KEY BUYING CRITERIA OF COMMERCIAL EARTH OBSERVATION (CEO) MARKET
      277. FIGURE 128. RESEARCH PROCESS OF MRFR
      278. FIGURE 129. DRO ANALYSIS OF COMMERCIAL EARTH OBSERVATION (CEO) MARKET
      279. FIGURE 130. DRIVERS IMPACT ANALYSIS: COMMERCIAL EARTH OBSERVATION (CEO) MARKET
      280. FIGURE 131. RESTRAINTS IMPACT ANALYSIS: COMMERCIAL EARTH OBSERVATION (CEO) MARKET
      281. FIGURE 132. SUPPLY / VALUE CHAIN: COMMERCIAL EARTH OBSERVATION (CEO) MARKET
      282. FIGURE 133. COMMERCIAL EARTH OBSERVATION (CEO) MARKET, BY APPLICATION, 2025 (% SHARE)
      283. FIGURE 134. COMMERCIAL EARTH OBSERVATION (CEO) MARKET, BY APPLICATION, 2019 TO 2035 (USD Billions)
      284. FIGURE 135. COMMERCIAL EARTH OBSERVATION (CEO) MARKET, BY DATA TYPE, 2025 (% SHARE)
      285. FIGURE 136. COMMERCIAL EARTH OBSERVATION (CEO) MARKET, BY DATA TYPE, 2019 TO 2035 (USD Billions)
      286. FIGURE 137. COMMERCIAL EARTH OBSERVATION (CEO) MARKET, BY END USE, 2025 (% SHARE)
      287. FIGURE 138. COMMERCIAL EARTH OBSERVATION (CEO) MARKET, BY END USE, 2019 TO 2035 (USD Billions)
      288. FIGURE 139. COMMERCIAL EARTH OBSERVATION (CEO) MARKET, BY DEPLOYMENT MODEL, 2025 (% SHARE)
      289. FIGURE 140. COMMERCIAL EARTH OBSERVATION (CEO) MARKET, BY DEPLOYMENT MODEL, 2019 TO 2035 (USD Billions)
      290. FIGURE 141. COMMERCIAL EARTH OBSERVATION (CEO) MARKET, BY REGIONAL, 2025 (% SHARE)
      291. FIGURE 142. COMMERCIAL EARTH OBSERVATION (CEO) MARKET, BY REGIONAL, 2019 TO 2035 (USD Billions)
      292. FIGURE 143. BENCHMARKING OF MAJOR COMPETITORS

    Commercial Earth Observation (CEO) Market Segmentation

    • Commercial Earth Observation (CEO) Market By Application (USD Billion, 2019-2035)

      • Agriculture

      • Forestry

      • Urban Planning

      • Disaster Management

      • Environmental Monitoring

    • Commercial Earth Observation (CEO) Market By Data Type (USD Billion, 2019-2035)

      • Satellite Imagery

      • Aerial Imagery

      • LiDAR Data

      • Ground-Based Data

    • Commercial Earth Observation (CEO) Market By End Use (USD Billion, 2019-2035)

      • Government

      • Commercial Enterprises

      • Research Institutions

      • Non-Governmental Organizations

    • Commercial Earth Observation (CEO) Market By Deployment Model (USD Billion, 2019-2035)

      • On-Premises

      • Cloud-Based

      • Hybrid

    • Commercial Earth Observation (CEO) Market By Regional (USD Billion, 2019-2035)

      • North America

      • Europe

      • South America

      • Asia Pacific

      • Middle East and Africa

    Commercial Earth Observation (CEO) Market Regional Outlook (USD Billion, 2019-2035)

    • North America Outlook (USD Billion, 2019-2035)

      • North America Commercial Earth Observation (CEO) Market by Application Type

        • Agriculture

        • Forestry

        • Urban Planning

        • Disaster Management

        • Environmental Monitoring

      • North America Commercial Earth Observation (CEO) Market by Data Type

        • Satellite Imagery

        • Aerial Imagery

        • LiDAR Data

        • Ground-Based Data

      • North America Commercial Earth Observation (CEO) Market by End Use Type

        • Government

        • Commercial Enterprises

        • Research Institutions

        • Non-Governmental Organizations

      • North America Commercial Earth Observation (CEO) Market by Deployment Model Type

        • On-Premises

        • Cloud-Based

        • Hybrid

      • North America Commercial Earth Observation (CEO) Market by Regional Type

        • US

        • Canada

      • US Outlook (USD Billion, 2019-2035)

      • US Commercial Earth Observation (CEO) Market by Application Type

        • Agriculture

        • Forestry

        • Urban Planning

        • Disaster Management

        • Environmental Monitoring

      • US Commercial Earth Observation (CEO) Market by Data Type

        • Satellite Imagery

        • Aerial Imagery

        • LiDAR Data

        • Ground-Based Data

      • US Commercial Earth Observation (CEO) Market by End Use Type

        • Government

        • Commercial Enterprises

        • Research Institutions

        • Non-Governmental Organizations

      • US Commercial Earth Observation (CEO) Market by Deployment Model Type

        • On-Premises

        • Cloud-Based

        • Hybrid

      • CANADA Outlook (USD Billion, 2019-2035)

      • CANADA Commercial Earth Observation (CEO) Market by Application Type

        • Agriculture

        • Forestry

        • Urban Planning

        • Disaster Management

        • Environmental Monitoring

      • CANADA Commercial Earth Observation (CEO) Market by Data Type

        • Satellite Imagery

        • Aerial Imagery

        • LiDAR Data

        • Ground-Based Data

      • CANADA Commercial Earth Observation (CEO) Market by End Use Type

        • Government

        • Commercial Enterprises

        • Research Institutions

        • Non-Governmental Organizations

      • CANADA Commercial Earth Observation (CEO) Market by Deployment Model Type

        • On-Premises

        • Cloud-Based

        • Hybrid

    • Europe Outlook (USD Billion, 2019-2035)

      • Europe Commercial Earth Observation (CEO) Market by Application Type

        • Agriculture

        • Forestry

        • Urban Planning

        • Disaster Management

        • Environmental Monitoring

      • Europe Commercial Earth Observation (CEO) Market by Data Type

        • Satellite Imagery

        • Aerial Imagery

        • LiDAR Data

        • Ground-Based Data

      • Europe Commercial Earth Observation (CEO) Market by End Use Type

        • Government

        • Commercial Enterprises

        • Research Institutions

        • Non-Governmental Organizations

      • Europe Commercial Earth Observation (CEO) Market by Deployment Model Type

        • On-Premises

        • Cloud-Based

        • Hybrid

      • Europe Commercial Earth Observation (CEO) Market by Regional Type

        • Germany

        • UK

        • France

        • Russia

        • Italy

        • Spain

        • Rest of Europe

      • GERMANY Outlook (USD Billion, 2019-2035)

      • GERMANY Commercial Earth Observation (CEO) Market by Application Type

        • Agriculture

        • Forestry

        • Urban Planning

        • Disaster Management

        • Environmental Monitoring

      • GERMANY Commercial Earth Observation (CEO) Market by Data Type

        • Satellite Imagery

        • Aerial Imagery

        • LiDAR Data

        • Ground-Based Data

      • GERMANY Commercial Earth Observation (CEO) Market by End Use Type

        • Government

        • Commercial Enterprises

        • Research Institutions

        • Non-Governmental Organizations

      • GERMANY Commercial Earth Observation (CEO) Market by Deployment Model Type

        • On-Premises

        • Cloud-Based

        • Hybrid

      • UK Outlook (USD Billion, 2019-2035)

      • UK Commercial Earth Observation (CEO) Market by Application Type

        • Agriculture

        • Forestry

        • Urban Planning

        • Disaster Management

        • Environmental Monitoring

      • UK Commercial Earth Observation (CEO) Market by Data Type

        • Satellite Imagery

        • Aerial Imagery

        • LiDAR Data

        • Ground-Based Data

      • UK Commercial Earth Observation (CEO) Market by End Use Type

        • Government

        • Commercial Enterprises

        • Research Institutions

        • Non-Governmental Organizations

      • UK Commercial Earth Observation (CEO) Market by Deployment Model Type

        • On-Premises

        • Cloud-Based

        • Hybrid

      • FRANCE Outlook (USD Billion, 2019-2035)

      • FRANCE Commercial Earth Observation (CEO) Market by Application Type

        • Agriculture

        • Forestry

        • Urban Planning

        • Disaster Management

        • Environmental Monitoring

      • FRANCE Commercial Earth Observation (CEO) Market by Data Type

        • Satellite Imagery

        • Aerial Imagery

        • LiDAR Data

        • Ground-Based Data

      • FRANCE Commercial Earth Observation (CEO) Market by End Use Type

        • Government

        • Commercial Enterprises

        • Research Institutions

        • Non-Governmental Organizations

      • FRANCE Commercial Earth Observation (CEO) Market by Deployment Model Type

        • On-Premises

        • Cloud-Based

        • Hybrid

      • RUSSIA Outlook (USD Billion, 2019-2035)

      • RUSSIA Commercial Earth Observation (CEO) Market by Application Type

        • Agriculture

        • Forestry

        • Urban Planning

        • Disaster Management

        • Environmental Monitoring

      • RUSSIA Commercial Earth Observation (CEO) Market by Data Type

        • Satellite Imagery

        • Aerial Imagery

        • LiDAR Data

        • Ground-Based Data

      • RUSSIA Commercial Earth Observation (CEO) Market by End Use Type

        • Government

        • Commercial Enterprises

        • Research Institutions

        • Non-Governmental Organizations

      • RUSSIA Commercial Earth Observation (CEO) Market by Deployment Model Type

        • On-Premises

        • Cloud-Based

        • Hybrid

      • ITALY Outlook (USD Billion, 2019-2035)

      • ITALY Commercial Earth Observation (CEO) Market by Application Type

        • Agriculture

        • Forestry

        • Urban Planning

        • Disaster Management

        • Environmental Monitoring

      • ITALY Commercial Earth Observation (CEO) Market by Data Type

        • Satellite Imagery

        • Aerial Imagery

        • LiDAR Data

        • Ground-Based Data

      • ITALY Commercial Earth Observation (CEO) Market by End Use Type

        • Government

        • Commercial Enterprises

        • Research Institutions

        • Non-Governmental Organizations

      • ITALY Commercial Earth Observation (CEO) Market by Deployment Model Type

        • On-Premises

        • Cloud-Based

        • Hybrid

      • SPAIN Outlook (USD Billion, 2019-2035)

      • SPAIN Commercial Earth Observation (CEO) Market by Application Type

        • Agriculture

        • Forestry

        • Urban Planning

        • Disaster Management

        • Environmental Monitoring

      • SPAIN Commercial Earth Observation (CEO) Market by Data Type

        • Satellite Imagery

        • Aerial Imagery

        • LiDAR Data

        • Ground-Based Data

      • SPAIN Commercial Earth Observation (CEO) Market by End Use Type

        • Government

        • Commercial Enterprises

        • Research Institutions

        • Non-Governmental Organizations

      • SPAIN Commercial Earth Observation (CEO) Market by Deployment Model Type

        • On-Premises

        • Cloud-Based

        • Hybrid

      • REST OF EUROPE Outlook (USD Billion, 2019-2035)

      • REST OF EUROPE Commercial Earth Observation (CEO) Market by Application Type

        • Agriculture

        • Forestry

        • Urban Planning

        • Disaster Management

        • Environmental Monitoring

      • REST OF EUROPE Commercial Earth Observation (CEO) Market by Data Type

        • Satellite Imagery

        • Aerial Imagery

        • LiDAR Data

        • Ground-Based Data

      • REST OF EUROPE Commercial Earth Observation (CEO) Market by End Use Type

        • Government

        • Commercial Enterprises

        • Research Institutions

        • Non-Governmental Organizations

      • REST OF EUROPE Commercial Earth Observation (CEO) Market by Deployment Model Type

        • On-Premises

        • Cloud-Based

        • Hybrid

    • APAC Outlook (USD Billion, 2019-2035)

      • APAC Commercial Earth Observation (CEO) Market by Application Type

        • Agriculture

        • Forestry

        • Urban Planning

        • Disaster Management

        • Environmental Monitoring

      • APAC Commercial Earth Observation (CEO) Market by Data Type

        • Satellite Imagery

        • Aerial Imagery

        • LiDAR Data

        • Ground-Based Data

      • APAC Commercial Earth Observation (CEO) Market by End Use Type

        • Government

        • Commercial Enterprises

        • Research Institutions

        • Non-Governmental Organizations

      • APAC Commercial Earth Observation (CEO) Market by Deployment Model Type

        • On-Premises

        • Cloud-Based

        • Hybrid

      • APAC Commercial Earth Observation (CEO) Market by Regional Type

        • China

        • India

        • Japan

        • South Korea

        • Malaysia

        • Thailand

        • Indonesia

        • Rest of APAC

      • CHINA Outlook (USD Billion, 2019-2035)

      • CHINA Commercial Earth Observation (CEO) Market by Application Type

        • Agriculture

        • Forestry

        • Urban Planning

        • Disaster Management

        • Environmental Monitoring

      • CHINA Commercial Earth Observation (CEO) Market by Data Type

        • Satellite Imagery

        • Aerial Imagery

        • LiDAR Data

        • Ground-Based Data

      • CHINA Commercial Earth Observation (CEO) Market by End Use Type

        • Government

        • Commercial Enterprises

        • Research Institutions

        • Non-Governmental Organizations

      • CHINA Commercial Earth Observation (CEO) Market by Deployment Model Type

        • On-Premises

        • Cloud-Based

        • Hybrid

      • INDIA Outlook (USD Billion, 2019-2035)

      • INDIA Commercial Earth Observation (CEO) Market by Application Type

        • Agriculture

        • Forestry

        • Urban Planning

        • Disaster Management

        • Environmental Monitoring

      • INDIA Commercial Earth Observation (CEO) Market by Data Type

        • Satellite Imagery

        • Aerial Imagery

        • LiDAR Data

        • Ground-Based Data

      • INDIA Commercial Earth Observation (CEO) Market by End Use Type

        • Government

        • Commercial Enterprises

        • Research Institutions

        • Non-Governmental Organizations

      • INDIA Commercial Earth Observation (CEO) Market by Deployment Model Type

        • On-Premises

        • Cloud-Based

        • Hybrid

      • JAPAN Outlook (USD Billion, 2019-2035)

      • JAPAN Commercial Earth Observation (CEO) Market by Application Type

        • Agriculture

        • Forestry

        • Urban Planning

        • Disaster Management

        • Environmental Monitoring

      • JAPAN Commercial Earth Observation (CEO) Market by Data Type

        • Satellite Imagery

        • Aerial Imagery

        • LiDAR Data

        • Ground-Based Data

      • JAPAN Commercial Earth Observation (CEO) Market by End Use Type

        • Government

        • Commercial Enterprises

        • Research Institutions

        • Non-Governmental Organizations

      • JAPAN Commercial Earth Observation (CEO) Market by Deployment Model Type

        • On-Premises

        • Cloud-Based

        • Hybrid

      • SOUTH KOREA Outlook (USD Billion, 2019-2035)

      • SOUTH KOREA Commercial Earth Observation (CEO) Market by Application Type

        • Agriculture

        • Forestry

        • Urban Planning

        • Disaster Management

        • Environmental Monitoring

      • SOUTH KOREA Commercial Earth Observation (CEO) Market by Data Type

        • Satellite Imagery

        • Aerial Imagery

        • LiDAR Data

        • Ground-Based Data

      • SOUTH KOREA Commercial Earth Observation (CEO) Market by End Use Type

        • Government

        • Commercial Enterprises

        • Research Institutions

        • Non-Governmental Organizations

      • SOUTH KOREA Commercial Earth Observation (CEO) Market by Deployment Model Type

        • On-Premises

        • Cloud-Based

        • Hybrid

      • MALAYSIA Outlook (USD Billion, 2019-2035)

      • MALAYSIA Commercial Earth Observation (CEO) Market by Application Type

        • Agriculture

        • Forestry

        • Urban Planning

        • Disaster Management

        • Environmental Monitoring

      • MALAYSIA Commercial Earth Observation (CEO) Market by Data Type

        • Satellite Imagery

        • Aerial Imagery

        • LiDAR Data

        • Ground-Based Data

      • MALAYSIA Commercial Earth Observation (CEO) Market by End Use Type

        • Government

        • Commercial Enterprises

        • Research Institutions

        • Non-Governmental Organizations

      • MALAYSIA Commercial Earth Observation (CEO) Market by Deployment Model Type

        • On-Premises

        • Cloud-Based

        • Hybrid

      • THAILAND Outlook (USD Billion, 2019-2035)

      • THAILAND Commercial Earth Observation (CEO) Market by Application Type

        • Agriculture

        • Forestry

        • Urban Planning

        • Disaster Management

        • Environmental Monitoring

      • THAILAND Commercial Earth Observation (CEO) Market by Data Type

        • Satellite Imagery

        • Aerial Imagery

        • LiDAR Data

        • Ground-Based Data

      • THAILAND Commercial Earth Observation (CEO) Market by End Use Type

        • Government

        • Commercial Enterprises

        • Research Institutions

        • Non-Governmental Organizations

      • THAILAND Commercial Earth Observation (CEO) Market by Deployment Model Type

        • On-Premises

        • Cloud-Based

        • Hybrid

      • INDONESIA Outlook (USD Billion, 2019-2035)

      • INDONESIA Commercial Earth Observation (CEO) Market by Application Type

        • Agriculture

        • Forestry

        • Urban Planning

        • Disaster Management

        • Environmental Monitoring

      • INDONESIA Commercial Earth Observation (CEO) Market by Data Type

        • Satellite Imagery

        • Aerial Imagery

        • LiDAR Data

        • Ground-Based Data

      • INDONESIA Commercial Earth Observation (CEO) Market by End Use Type

        • Government

        • Commercial Enterprises

        • Research Institutions

        • Non-Governmental Organizations

      • INDONESIA Commercial Earth Observation (CEO) Market by Deployment Model Type

        • On-Premises

        • Cloud-Based

        • Hybrid

      • REST OF APAC Outlook (USD Billion, 2019-2035)

      • REST OF APAC Commercial Earth Observation (CEO) Market by Application Type

        • Agriculture

        • Forestry

        • Urban Planning

        • Disaster Management

        • Environmental Monitoring

      • REST OF APAC Commercial Earth Observation (CEO) Market by Data Type

        • Satellite Imagery

        • Aerial Imagery

        • LiDAR Data

        • Ground-Based Data

      • REST OF APAC Commercial Earth Observation (CEO) Market by End Use Type

        • Government

        • Commercial Enterprises

        • Research Institutions

        • Non-Governmental Organizations

      • REST OF APAC Commercial Earth Observation (CEO) Market by Deployment Model Type

        • On-Premises

        • Cloud-Based

        • Hybrid

    • South America Outlook (USD Billion, 2019-2035)

      • South America Commercial Earth Observation (CEO) Market by Application Type

        • Agriculture

        • Forestry

        • Urban Planning

        • Disaster Management

        • Environmental Monitoring

      • South America Commercial Earth Observation (CEO) Market by Data Type

        • Satellite Imagery

        • Aerial Imagery

        • LiDAR Data

        • Ground-Based Data

      • South America Commercial Earth Observation (CEO) Market by End Use Type

        • Government

        • Commercial Enterprises

        • Research Institutions

        • Non-Governmental Organizations

      • South America Commercial Earth Observation (CEO) Market by Deployment Model Type

        • On-Premises

        • Cloud-Based

        • Hybrid

      • South America Commercial Earth Observation (CEO) Market by Regional Type

        • Brazil

        • Mexico

        • Argentina

        • Rest of South America

      • BRAZIL Outlook (USD Billion, 2019-2035)

      • BRAZIL Commercial Earth Observation (CEO) Market by Application Type

        • Agriculture

        • Forestry

        • Urban Planning

        • Disaster Management

        • Environmental Monitoring

      • BRAZIL Commercial Earth Observation (CEO) Market by Data Type

        • Satellite Imagery

        • Aerial Imagery

        • LiDAR Data

        • Ground-Based Data

      • BRAZIL Commercial Earth Observation (CEO) Market by End Use Type

        • Government

        • Commercial Enterprises

        • Research Institutions

        • Non-Governmental Organizations

      • BRAZIL Commercial Earth Observation (CEO) Market by Deployment Model Type

        • On-Premises

        • Cloud-Based

        • Hybrid

      • MEXICO Outlook (USD Billion, 2019-2035)

      • MEXICO Commercial Earth Observation (CEO) Market by Application Type

        • Agriculture

        • Forestry

        • Urban Planning

        • Disaster Management

        • Environmental Monitoring

      • MEXICO Commercial Earth Observation (CEO) Market by Data Type

        • Satellite Imagery

        • Aerial Imagery

        • LiDAR Data

        • Ground-Based Data

      • MEXICO Commercial Earth Observation (CEO) Market by End Use Type

        • Government

        • Commercial Enterprises

        • Research Institutions

        • Non-Governmental Organizations

      • MEXICO Commercial Earth Observation (CEO) Market by Deployment Model Type

        • On-Premises

        • Cloud-Based

        • Hybrid

      • ARGENTINA Outlook (USD Billion, 2019-2035)

      • ARGENTINA Commercial Earth Observation (CEO) Market by Application Type

        • Agriculture

        • Forestry

        • Urban Planning

        • Disaster Management

        • Environmental Monitoring

      • ARGENTINA Commercial Earth Observation (CEO) Market by Data Type

        • Satellite Imagery

        • Aerial Imagery

        • LiDAR Data

        • Ground-Based Data

      • ARGENTINA Commercial Earth Observation (CEO) Market by End Use Type

        • Government

        • Commercial Enterprises

        • Research Institutions

        • Non-Governmental Organizations

      • ARGENTINA Commercial Earth Observation (CEO) Market by Deployment Model Type

        • On-Premises

        • Cloud-Based

        • Hybrid

      • REST OF SOUTH AMERICA Outlook (USD Billion, 2019-2035)

      • REST OF SOUTH AMERICA Commercial Earth Observation (CEO) Market by Application Type

        • Agriculture

        • Forestry

        • Urban Planning

        • Disaster Management

        • Environmental Monitoring

      • REST OF SOUTH AMERICA Commercial Earth Observation (CEO) Market by Data Type

        • Satellite Imagery

        • Aerial Imagery

        • LiDAR Data

        • Ground-Based Data

      • REST OF SOUTH AMERICA Commercial Earth Observation (CEO) Market by End Use Type

        • Government

        • Commercial Enterprises

        • Research Institutions

        • Non-Governmental Organizations

      • REST OF SOUTH AMERICA Commercial Earth Observation (CEO) Market by Deployment Model Type

        • On-Premises

        • Cloud-Based

        • Hybrid

    • MEA Outlook (USD Billion, 2019-2035)

      • MEA Commercial Earth Observation (CEO) Market by Application Type

        • Agriculture

        • Forestry

        • Urban Planning

        • Disaster Management

        • Environmental Monitoring

      • MEA Commercial Earth Observation (CEO) Market by Data Type

        • Satellite Imagery

        • Aerial Imagery

        • LiDAR Data

        • Ground-Based Data

      • MEA Commercial Earth Observation (CEO) Market by End Use Type

        • Government

        • Commercial Enterprises

        • Research Institutions

        • Non-Governmental Organizations

      • MEA Commercial Earth Observation (CEO) Market by Deployment Model Type

        • On-Premises

        • Cloud-Based

        • Hybrid

      • MEA Commercial Earth Observation (CEO) Market by Regional Type

        • GCC Countries

        • South Africa

        • Rest of MEA

      • GCC COUNTRIES Outlook (USD Billion, 2019-2035)

      • GCC COUNTRIES Commercial Earth Observation (CEO) Market by Application Type

        • Agriculture

        • Forestry

        • Urban Planning

        • Disaster Management

        • Environmental Monitoring

      • GCC COUNTRIES Commercial Earth Observation (CEO) Market by Data Type

        • Satellite Imagery

        • Aerial Imagery

        • LiDAR Data

        • Ground-Based Data

      • GCC COUNTRIES Commercial Earth Observation (CEO) Market by End Use Type

        • Government

        • Commercial Enterprises

        • Research Institutions

        • Non-Governmental Organizations

      • GCC COUNTRIES Commercial Earth Observation (CEO) Market by Deployment Model Type

        • On-Premises

        • Cloud-Based

        • Hybrid

      • SOUTH AFRICA Outlook (USD Billion, 2019-2035)

      • SOUTH AFRICA Commercial Earth Observation (CEO) Market by Application Type

        • Agriculture

        • Forestry

        • Urban Planning

        • Disaster Management

        • Environmental Monitoring

      • SOUTH AFRICA Commercial Earth Observation (CEO) Market by Data Type

        • Satellite Imagery

        • Aerial Imagery

        • LiDAR Data

        • Ground-Based Data

      • SOUTH AFRICA Commercial Earth Observation (CEO) Market by End Use Type

        • Government

        • Commercial Enterprises

        • Research Institutions

        • Non-Governmental Organizations

      • SOUTH AFRICA Commercial Earth Observation (CEO) Market by Deployment Model Type

        • On-Premises

        • Cloud-Based

        • Hybrid

      • REST OF MEA Outlook (USD Billion, 2019-2035)

      • REST OF MEA Commercial Earth Observation (CEO) Market by Application Type

        • Agriculture

        • Forestry

        • Urban Planning

        • Disaster Management

        • Environmental Monitoring

      • REST OF MEA Commercial Earth Observation (CEO) Market by Data Type

        • Satellite Imagery

        • Aerial Imagery

        • LiDAR Data

        • Ground-Based Data

      • REST OF MEA Commercial Earth Observation (CEO) Market by End Use Type

        • Government

        • Commercial Enterprises

        • Research Institutions

        • Non-Governmental Organizations

      • REST OF MEA Commercial Earth Observation (CEO) Market by Deployment Model Type

        • On-Premises

        • Cloud-Based

        • Hybrid

    Infographic

    Free Sample Request

    Kindly complete the form below to receive a free sample of this Report

    Get Free Sample

    Customer Strories

    “I am very pleased with how market segments have been defined in a relevant way for my purposes (such as "Portable Freezers & refrigerators" and "last-mile"). In general the report is well structured. Thanks very much for your efforts.”

    Victoria Milne

    Founder
    Case Study
    Chemicals and Materials