• Cat-intel
  • MedIntelliX
  • Resources
  • About Us
  • Hero Background
    English
    Chinese
    French
    Japanese
    Korean
    German
    Spanish

    Dynamic Glazing Market Analysis

    ID: MRFR/CnM/2705-HCR
    145 Pages
    Chitranshi Jaiswal
    October 2025

    Dynamic Glazing Market Research Report Information by Technology (Polymer Dispersed Liquid Crystals (PDLC), Suspended Particle Device, Photochromic, Thermochromic, Electrochromic), By Application (Day Lighting Performance, Glare Control, Energy Savings, Heat Gain), By End-Use (Residential, Commercial, Transportation and Others) and By Region – Forecast To 2035

    Share:
    Download PDF ×

    We do not share your information with anyone. However, we may send you emails based on your report interest from time to time. You may contact us at any time to opt-out.

    Dynamic Glazing Market Infographic
    $ 4,950.0
    $ 5,950.0
    $ 7,250.0

    Market Analysis

    In-depth Analysis of Dynamic Glazing Market Industry Landscape

    The dynamic glazing market operates within a dynamic framework influenced by various factors that shape supply, demand, and pricing dynamics. Dynamic glazing, also known as smart or switchable glass, is a technologically advanced glass product that can change its properties in response to external stimuli such as light, heat, or electricity. One of the primary drivers of market dynamics is the increasing demand for energy-efficient and sustainable building solutions. Dynamic glazing offers benefits such as solar heat control, glare reduction, and daylight harvesting, making it a popular choice for green building projects and energy-efficient building designs. Factors such as energy regulations, environmental concerns, and the need for improved indoor comfort drive demand for dynamic glazing in the construction industry. The products used in construction activities that can change the properties of performance automatically is known as dynamic glazing product. The windows and doors, which are dynamically glazed, change their performance automatically to respond to environmental signals or control. Dynamic glazing is used to darken the interior piece of glass electrochromic technology. Supply dynamics in the dynamic glazing market are influenced by factors such as manufacturing capabilities, technological advancements, and raw material availability. Dynamic glazing products are manufactured using specialized glass coatings, lamination techniques, and electrochromic or photochromic materials that enable them to change their properties in response to external stimuli. Manufacturing capabilities, including production capacity, process efficiency, and quality control measures, play a crucial role in shaping supply dynamics by determining the ability of manufacturers to meet market demand. Moreover, advancements in glass coating technologies, smart materials, and manufacturing processes contribute to product innovation and expanding the range of available dynamic glazing solutions. Market dynamics are further influenced by factors such as regulatory standards, building design trends, and technological innovations. Regulatory standards related to energy efficiency, building codes, and environmental sustainability influence market dynamics by setting requirements for building materials and construction practices. Building design trends, such as the increasing adoption of green building principles, daylighting strategies, and passive solar design, drive demand for dynamic glazing solutions that can enhance energy performance and occupant comfort. Additionally, technological innovations in smart glass technologies, such as electrochromic, photochromic, or thermochromic glazing systems, contribute to product advancements and market growth. Pricing dynamics in the dynamic glazing market are influenced by a combination of factors including manufacturing costs, technological advancements, competitive pressures, and market demand-supply dynamics. Manufacturing costs for dynamic glazing products, including materials, processing, and assembly expenses, directly impact pricing decisions for manufacturers. Technological advancements in smart glass technologies and manufacturing processes contribute to cost reduction and efficiency improvements, influencing pricing strategies adopted by market players. Competitive pressures within the industry, driven by factors such as market concentration, brand reputation, and product differentiation, also influence pricing dynamics. Moreover, demand-supply imbalances, fluctuations in raw material prices, and changes in construction activity levels can exert short-term pressures on prices. Environmental considerations and sustainability trends are increasingly shaping market dynamics in the dynamic glazing industry. With growing awareness of environmental issues and sustainability goals, stakeholders across the value chain are prioritizing the use of energy-efficient and environmentally friendly building materials. Dynamic glazing products contribute to energy savings, indoor comfort improvements, and daylight utilization, aligning with sustainability objectives in the construction industry. Additionally, certification programs promoting green building materials and government incentives for energy-efficient building solutions further influence market dynamics by shaping consumer preferences and industry standards.

    Market Summary

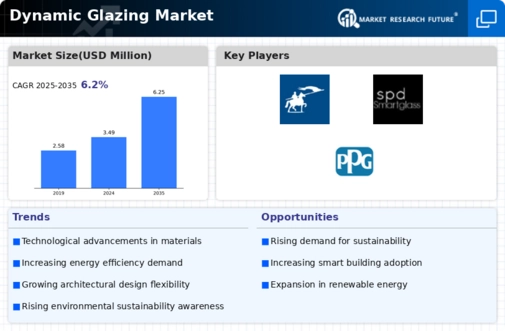
    The Global Dynamic Glazing Market is projected to grow from 3.49 USD Billion in 2024 to 6.25 USD Billion by 2035, reflecting a robust growth trajectory.

    Key Market Trends & Highlights

    Dynamic Glazing Key Trends and Highlights

    • The market is expected to experience a compound annual growth rate (CAGR) of 5.45% from 2025 to 2035.
    • By 2035, the market valuation is anticipated to reach 6.25 USD Billion, indicating substantial growth opportunities.
    • In 2024, the market is valued at 3.49 USD Billion, showcasing the current demand for dynamic glazing solutions.
    • Growing adoption of energy-efficient technologies due to increasing environmental regulations is a major market driver.

    Market Size & Forecast

    2024 Market Size 3.49 (USD Million)
    2035 Market Size 6.25 (USD Million)
    CAGR (2025-2035) 5.45%
    Largest Regional Market Share in 2024 latin_america)

    Major Players

    Guardian Industries(U.S.), Beautex Industries Pvt. Ltd (India), Corning Inc. (U.S.), Saint-Gobain S.A (France), Research Frontiers, Inc.(U.S.), Pleotint LLC (U.S.), PPG Industries, Inc. (U.S.), GPD Group (U.S.), Nippon Sheet Glass Co., Ltd. (Japan), GlasNovations, Ltd. (U.K.), Kinestral Technologies, Inc.

    Market Trends

    The ongoing advancements in energy-efficient technologies and increasing demand for sustainable building solutions are driving the evolution of the dynamic glazing market, suggesting a transformative shift in architectural design and energy management.

    U.S. Department of Energy

    Dynamic Glazing Market Market Drivers

    Market Growth Projections

    Technological Advancements

    Technological innovations play a pivotal role in the expansion of the Global Dynamic Glazing Market Industry. Recent advancements in materials and manufacturing processes have led to the development of more efficient and responsive dynamic glazing products. For instance, the integration of smart technologies allows for real-time adjustments to light and heat, enhancing user comfort and energy savings. As these technologies evolve, they are likely to attract more investments and applications across various sectors. The anticipated growth from 2024 to 2035, with a projected market size of 6.25 USD Billion, indicates that ongoing research and development will continue to drive market dynamics.

    Growing Demand for Energy Efficiency

    The Global Dynamic Glazing Market Industry experiences a notable surge in demand driven by the increasing emphasis on energy efficiency in buildings. As energy costs rise, both residential and commercial sectors are seeking solutions that reduce energy consumption. Dynamic glazing technologies, which adjust their tint based on sunlight exposure, offer a promising solution. In 2024, the market is projected to reach 3.49 USD Billion, reflecting a growing trend towards sustainable building practices. This shift is further supported by government incentives aimed at promoting energy-efficient technologies, suggesting a robust future for dynamic glazing as a key component in energy-efficient architecture.

    Diverse Applications Across Various Sectors

    The versatility of dynamic glazing technologies contributes to their expanding presence in the Global Dynamic Glazing Market Industry. These products find applications in a wide range of sectors, including residential, commercial, and automotive industries. For example, dynamic glazing is increasingly utilized in skyscrapers to enhance energy efficiency and aesthetic appeal. Additionally, the automotive sector is adopting these technologies to improve passenger comfort and vehicle efficiency. This diverse applicability not only broadens the market scope but also encourages innovation and competition among manufacturers, indicating a dynamic future for the industry.

    Rising Awareness of Indoor Environmental Quality

    There is a growing recognition of the importance of indoor environmental quality (IEQ) in the Global Dynamic Glazing Market Industry. Enhanced IEQ is linked to occupant health, productivity, and overall well-being, prompting architects and builders to integrate dynamic glazing solutions into their designs. These technologies help regulate natural light and temperature, thereby improving comfort levels within buildings. As awareness of IEQ continues to rise, the demand for dynamic glazing is expected to increase, further propelling market growth. This trend aligns with the broader movement towards healthier living and working environments, suggesting a promising outlook for the dynamic glazing sector.

    Regulatory Support for Sustainable Building Practices

    The Global Dynamic Glazing Market Industry benefits significantly from regulatory frameworks that promote sustainable building practices. Governments worldwide are increasingly implementing stringent building codes and standards aimed at reducing carbon footprints. These regulations often encourage the adoption of dynamic glazing technologies, which contribute to energy savings and improved indoor environments. As a result, the market is likely to see accelerated growth, with a compound annual growth rate of 5.45% projected from 2025 to 2035. This regulatory support not only enhances market viability but also aligns with global sustainability goals, fostering a conducive environment for dynamic glazing adoption.

    Market Segment Insights

    Regional Insights

    Key Companies in the Dynamic Glazing Market market include

    Industry Developments

    In the year 2021, dynamic Glass has broadcasted the achievement of Colorado Window Systems, Inc., a leading glazing and glass service provider, in a deal that will cover Dynamic Glass' facility capabilities across Colorado. CWS was recognized in 2003 and has developed an intense reputation for providing unusual quality and service to Colorado's premier general contractors for low-rise and mid-commercial projects. The company provides new resident and construction development services mostly across the retail, office, healthcare, flying, government, and education sectors.

    Report Overview 

    Future Outlook

    Dynamic Glazing Market Future Outlook

    The Global Dynamic Glazing Market is projected to grow at a 5.45% CAGR from 2024 to 2035, driven by advancements in energy efficiency, architectural innovation, and increasing demand for smart buildings.

    New opportunities lie in:

    • Develop integrated smart glazing solutions for residential applications.
    • Expand into emerging markets with tailored energy-efficient products.
    • Leverage partnerships with tech firms to enhance product functionalities.

    By 2035, the Dynamic Glazing Market is expected to achieve substantial growth, reflecting evolving consumer preferences and technological advancements.

    Market Segmentation

    Market Segmentation 

    By Region
    • North America 
    • Europe 
    • the Asia Pacific 
    • Middle East & Africa 
    • South America
    By Technology
    • Polymer Dispersed Liquid Crystals  
    • Suspended Particle Device 
    • Photochromic 
    •  
    • Electrochromic 
    By Application
    • Day Lighting Performance 
    • Glare Control 
    • Energy Savings 
    • Heat Gain 

    Report Scope

    Attribute/Metric Details
      Market Size   USD 4630 Million
      CAGR   6.2% (2024 - 2032)
      Base Year   2023
      Forecast Period 2024 - 2032
      Historical Data   2019 
      Forecast Units   Value (USD Million)
      Report Coverage   Revenue Forecast, Competitive Landscape, Growth Factors, and Trends
      Segments Covered   By Technology, Application, End-Use Industry and Region
      Geographies Covered   North America, Europe, Asia-Pacific, and Rest of the World (RoW)
      Key Vendors   Guardian Industries (U.S.), Beautex Industries Pvt. Ltd (India), Corning Inc. (U.S.), Saint-Gobain S.A (France), Research Frontiers, Inc. (U.S.), Pleotint LLC (U.S.), PPG Industries, Inc. (U.S.), GPD Group (U.S.), Nippon Sheet Glass Co., Ltd.(Japan), GlasNovations, Ltd. (U.K.) and others.
      Key Market Opportunities   Reduction in the cost of energy due to controlled day lighting.
      Key Market Drivers   The commercial segment is expected to grow the highest with its increasing applications in marine, aviation, etc

    Market Highlights

    Author

    Chitranshi Jaiswal
    Research Analyst Level I

    She holds an experience of about 6+ years in market research and business consulting, working under the spectrum of information communication technology, telecommunications and semiconductor domains. aarti conceptualizes and implements a scalable business strategy and provides strategic leadership to the clients. her expertise lies in market estimation, competitive intelligence, pipeline analysis, customer assessment, etc.

    Leave a Comment

    Latest Comments

    John Doe
    john@example.com

    This is a great article! Really helped me understand the topic better.

    Posted on July 23, 2025, 10:15 AM
    Jane Smith
    jane@domain.com

    Thanks for sharing this. I’ve bookmarked it for later reference.

    Posted on July 22, 2025, 7:45 PM

    FAQs

    What is dynamic glazing and in which all applications it is used in (industrial applications)?

    Dynamic glazing products possess the ability to change performance properties. These products are used in construction activities; for instance, the dynamic glazed windows and doors can automatically respond or control environmental signals.

    At what CAGR is the dynamic glazing market projected to grow in the forecast period (2024-2032)?

    Dynamic Glazing Market is projected to be worth USD 4630 Million by 2032, registering a CAGR of 6.2% during the forecast period (2024 - 2032).

    What is the leading segment in the dynamic glazing market?

    All segments of the dynamic glazing market are showing impressive rise; however, on the basis of technology, the sub-segment - thermochromic is expected to grow significantly during the forecast period. Among end-users, the sub-segment commercial is expected to grow exponentially.

    What are the key driving forces behind the growth of the global dynamic glazing market?

    Benefits that dynamic glazing materials can offer, such as the reduction in consumption and hence the cost of energy and promoting a sustainable design for the building infrastructure.

    Who are the top players in the global dynamic glazing market?

    Beautex Industries Pvt. Ltd (India), Guardian Industries (US), Corning Inc. (US), Research Frontiers, Inc. (US), Saint-Gobain SA (France), Pleotint LLC (US), GPD Group (US), PPG Industries, Inc. (US), Nippon Sheet Glass Co., Ltd.(Japan), and GlasNovations, Ltd. (UK) are some of the players leading the global dynamic glazing market.

    1. Table of Contents 1    Executive Summary 2       Research Methodology
    2.     2.1   Scope of the Study
    3.     2.1.1     Definition
    4.     2.1.2     Research Objective
    5.     2.1.3     Assumptions
    6.     2.1.4     Limitations
    7.     2.2   Research Process
    8.     2.2.1     Primary Research
    9.     2.2.2     Secondary Research
    10.     2.3   Market size Estimation
    11.     2.4   Forecast Model 3    Market Dynamics
    12.     3.1   Market Drivers
    13.     3.2   Market Inhibitors
    14.     3.3   Supply/Value Chain Analysis 
    15.     3.4   Porter’s Five Forces Analysis 4    Global Dynamic Glazing Market, By Technology
    16.     4.1   Polymer Dispersed Liquid Crystals (PDLC)
    17.     4.2   Suspended Particle Device
    18.     4.1   Photochromic
    19.     4.2   Thermochromic
    20.     4.1   Electrochromic 5    Global Dynamic Glazing Market, By Application
    21.     5.1   Day lighting performance
    22.     5.2   Glare Control
    23.     5.3   Energy Savings
    24.     5.4   Heat Gain 6    Global Dynamic Glazing Market, By End-user
    25.     6.1   Residential
    26.     6.2   Commercial
    27.     6.3   Transportation
    28.     6.4  Others 7      Regional Market Analysis
    29.     7.1           Introduction
    30.     7.2    North America
    31.     7.2.1    U.S.
    32.     7.2.2    Canada
    33.     7.3    Europe
    34.     7.3.1    U.K
    35.     7.3.2    France
    36.     7.3.3    Germany
    37.     7.3.4    Spain
    38.     7.3.5    Rest of Europe
    39.     7.4    Asia-Pacific
    40.     7.4.1    China
    41.     7.4.2    Japan
    42.     7.4.3    India
    43.     7.4.4    Rest of Asia-Pacific
    44.     7.5    Rest of the World   8             Competitive Analysis
    45.     8.1    Introduction
    46.     8.2    Competitive Scenario
    47.     8.2.1    Market Share Analysis
    48.     8.2.2    Market Development Analysis
    49.     8.2.3    Product/Service Benchmarking 
    50.     8.3    Guardian Industries (U.S)
    51.     8.3.1    Overview
    52.     8.3.2    Product /Service Offering
    53.     8.3.3    Strategy
    54.     8.4     Beautex Industries Pvt. Ltd (India)
    55.     8.4.1    Overview
    56.     8.4.2    Product /Service Offering
    57.     8.4.3    Strategy
    58.     8.5    Corning Inc. (U.S.)
    59.     8.5.1    Overview
    60.     8.5.2    Product /Service Offering
    61.     8.5.3    Strategy
    62.     8.6    Saint-Gobain S.A(France)
    63.     8.6.1    Overview
    64.     8.6.2    Product /Service Offering
    65.     8.6.3    Strategy
    66.     8.7    Research Frontiers, Inc.(U.S)
    67.     8.7.1    Overview
    68.     8.7.2    Product /Service Offering
    69.     8.7.3    Strategy
    70.     8.8    Research Frontiers, Inc.(U.S)
    71.     8.8.1    Overview
    72.     8.8.2    Product /Service Offering
    73.     8.8.3    Strategy
    74.     8.9    PPG Industries, Inc.(U.S)
    75.     8.9.1    Overview
    76.     8.9.2    Product /Service Offering
    77.     8.9.3    Strategy
    78.     8.10   GPD Group (U.S.)
    79.     8.10.1    Overview
    80.     8.10.2    Product /Service Offering
    81.     8.10.3    Strategy
    82.     8.11    Nippon Sheet Glass Co., Ltd.(Japan)
    83.     8.11.1    Overview
    84.     8.11.2    Product /Service Offering
    85.     8.11.3    Strategy
    86.     8.12   GlasNovations, Ltd. (U.K)
    87.     8.12.1    Overview
    88.     8.12.2    Product /Service Offering
    89.     8.12.3    Strategy
    90. List of Tables and Figures
      1. LIST OF TABLES
      2. TABLE 1    GLOBAL DYNAMIC GLAZING MARKET, BY TECHNOLOGY
      3. TABLE 2    GLOBAL DYNAMIC GLAZING MARKET, BY APPLICATION
      4. TABLE 3    GLOBAL DYNAMIC GLAZING MARKET, BY END-USER 
      5. TABLE 4     GLOBAL DYNAMIC GLAZING MARKET, BY REGIONS
      6. TABLE 5     NORTH AMERICA DYNAMIC GLAZING MARKET, BY TECHNOLOGY
      7. TABLE 6    NORTH AMERICA DYNAMIC GLAZING MARKET, BY APPLICATION
      8. TABLE 7    NORTH AMERICA DYNAMIC GLAZING MARKET, BY END-USER 
      9. TABLE 8    U.S. DYNAMIC GLAZING MARKET, BY TECHNOLOGY
      10. TABLE 9    U.S. DYNAMIC GLAZING MARKET, BY APPLICATION
      11. TABLE 10    U.S. DYNAMIC GLAZING MARKET, BY END-USER 
      12. TABLE 11    CANADA DYNAMIC GLAZING MARKET, BY TECHNOLOGY
      13. TABLE 12    CANADA DYNAMIC GLAZING MARKET, BY APPLICATION
      14. TABLE 13    CANADA DYNAMIC GLAZING MARKET, BY END-USER 
      15. TABLE 14    EUROPE DYNAMIC GLAZING MARKET, BY TECHNOLOGY
      16. TABLE 15    EUROPE DYNAMIC GLAZING MARKET, BY APPLICATION
      17. TABLE 16    EUROPE DYNAMIC GLAZING MARKET, BY END-USER 
      18. TABLE 17    GERMANY DYNAMIC GLAZING MARKET, BY TECHNOLOGY
      19. TABLE 18    GERMANY DYNAMIC GLAZING MARKET, BY APPLICATION
      20. TABLE 19    GERMANY DYNAMIC GLAZING MARKET, BY END-USER 
      21. TABLE 20    FRANCE DYNAMIC GLAZING MARKET, BY TECHNOLOGY
      22. TABLE 21    FRANCE DYNAMIC GLAZING MARKET, BY APPLICATION
      23. TABLE 22    FRANCE DYNAMIC GLAZING MARKET, BY END-USER 
      24. TABLE 23    U.K. DYNAMIC GLAZING MARKET, BY TECHNOLOGY
      25. TABLE 24    U.K. DYNAMIC GLAZING MARKET, BY APPLICATION
      26. TABLE 25    U.K. DYNAMIC GLAZING MARKET, BY END-USER 
      27. TABLE 26    REST OF EUROPE DYNAMIC GLAZING MARKET, BY TECHNOLOGY
      28. TABLE 27    REST OF EUROPE DYNAMIC GLAZING MARKET, BY APPLICATION
      29. TABLE 28    REST OF EUROPE DYNAMIC GLAZING MARKET, BY END-USER 
      30. TABLE 29    ASIA-PACIFIC DYNAMIC GLAZING MARKET, BY TECHNOLOGY
      31. TABLE 30    ASIA-PACIFIC DYNAMIC GLAZING MARKET, BY APPLICATION
      32. TABLE 31    ASIA-PACIFIC DYNAMIC GLAZING MARKET, BY END-USER 
      33. TABLE 32    ROW DYNAMIC GLAZING MARKET, BY TECHNOLOGY
      34. TABLE 33    ROW DYNAMIC GLAZING MARKET, BY APPLICATION
      35. TABLE 34    ROW DYNAMIC GLAZING MARKET, BY END-USER   LIST OF FIGURES
      36. FIGURE 1    Research Methodology
      37. FIGURE 2    GLOBAL DYNAMIC GLAZING MARKET: BY TECHNOLOGY (%)
      38. FIGURE 3    GLOBAL DYNAMIC GLAZING MARKET: BY APPLICATION (%)
      39. FIGURE 4    GLOBAL DYNAMIC GLAZING MARKET: BY END-USER (%)
      40. FIGURE 5    GLOBAL DYNAMIC GLAZING MARKET: BY REGION 
      41. FIGURE 6    NORTH AMERICA DYNAMIC GLAZING MARKET, BY TECHNOLOGY (%)
      42. FIGURE 7    NORTH AMERICA DYNAMIC GLAZING MARKET, BY APPLICATION (%)
      43. FIGURE 8    NORTH AMERICA DYNAMIC GLAZING MARKET, BY END-USER (%)
      44. FIGURE 9    EUROPE DYNAMIC GLAZING MARKET, BY TECHNOLOGY (%)
      45. FIGURE 10    EUROPE DYNAMIC GLAZING MARKET, BY APPLICATION (%)
      46. FIGURE 11    EUROPE DYNAMIC GLAZING MARKET, BY END-USER (%)
      47. FIGURE 12    ASIA-PACIFIC DYNAMIC GLAZING MARKET, BY TECHNOLOGY (%)
      48. FIGURE 13    ASIA-PACIFIC DYNAMIC GLAZING MARKET, BY APPLICATION (%)
      49. FIGURE 14    ASIA-PACIFIC DYNAMIC GLAZING MARKET, BY END-USER (%)
      50. FIGURE 15    ROW DYNAMIC GLAZING MARKET, BY TECHNOLOGY (%)
      51. FIGURE 16    ROW DYNAMIC GLAZING MARKET, BY APPLICATION (%)
      52. FIGURE 17    ROW DYNAMIC GLAZING MARKET, BY END-USER (%)  

    Dynamic Glazing Market Segmentation

    Market Segmentation Overview

    • Detailed segmentation data will be available in the full report
    • Comprehensive analysis by multiple parameters
    • Regional and country-level breakdowns
    • Market size forecasts by segment
    Infographic

    Free Sample Request

    Kindly complete the form below to receive a free sample of this Report

    Get Free Sample

    Customer Strories

    “I am very pleased with how market segments have been defined in a relevant way for my purposes (such as "Portable Freezers & refrigerators" and "last-mile"). In general the report is well structured. Thanks very much for your efforts.”

    Victoria Milne

    Founder
    Case Study
    Chemicals and Materials