-
EXECUTIVE SUMMARY
-
Market Overview
-
Key Findings
-
Market Segmentation
-
Competitive Landscape
-
Challenges and Opportunities
-
Future Outlook
-
MARKET INTRODUCTION
-
Definition
-
Scope of the study
- Research Objective
- Assumption
- Limitations
-
RESEARCH METHODOLOGY
-
Overview
-
Data Mining
-
Secondary Research
-
Primary Research
- Primary Interviews and Information Gathering Process
- Breakdown of Primary Respondents
-
Forecasting Model
-
Market Size Estimation
- Bottom-Up Approach
- Top-Down Approach
-
Data Triangulation
-
Validation
-
MARKET DYNAMICS
-
Overview
-
Drivers
-
Restraints
-
Opportunities
-
MARKET FACTOR ANALYSIS
-
Value chain Analysis
-
Porter''s Five Forces Analysis
- Bargaining Power of Suppliers
- Bargaining Power of Buyers
- Threat of New Entrants
- Threat of Substitutes
- Intensity of Rivalry
-
COVID-19 Impact Analysis
- Market Impact Analysis
- Regional Impact
- Opportunity and Threat Analysis
-
END USER EXPERIENCE MONITORING MARKET, BY DEPLOYMENT TYPE (USD BILLION)
-
On-Premises
-
Cloud-Based
-
Hybrid
-
END USER EXPERIENCE MONITORING MARKET, BY END USER (USD BILLION)
-
IT Enterprises
-
BFSI
-
Healthcare
-
Retail
-
Telecommunications
-
END USER EXPERIENCE MONITORING MARKET, BY COMPONENT (USD BILLION)
-
Software
-
Services
-
Support
-
END USER EXPERIENCE MONITORING MARKET, BY METHODOLOGY (USD BILLION)
-
Synthetic Monitoring
-
Real User Monitoring
-
Digital Experience Monitoring
-
END USER EXPERIENCE MONITORING MARKET, BY REGIONAL (USD BILLION)
-
North America
- US
- Canada
-
Europe
- Germany
- UK
- France
- Russia
- Italy
- Spain
- Rest of Europe
-
APAC
- China
- India
- Japan
- South Korea
- Malaysia
- Thailand
- Indonesia
- Rest of APAC
-
South America
- Brazil
- Mexico
- Argentina
- Rest of South America
-
MEA
- GCC Countries
- South Africa
- Rest of MEA
-
COMPETITIVE LANDSCAPE
-
Overview
-
Competitive Analysis
-
Market share Analysis
-
Major Growth Strategy in the End User Experience Monitoring Market
-
Competitive Benchmarking
-
Leading Players in Terms of Number of Developments in the End User Experience Monitoring Market
-
Key developments and growth strategies
- New Product Launch/Service Deployment
- Merger & Acquisitions
- Joint Ventures
-
Major Players Financial Matrix
- Sales and Operating Income
- Major Players R&D Expenditure. 2023
-
COMPANY PROFILES
-
Datadog
- Financial Overview
- Products Offered
- Key Developments
- SWOT Analysis
- Key Strategies
-
AppDynamics
- Financial Overview
- Products Offered
- Key Developments
- SWOT Analysis
- Key Strategies
-
Sentry
- Financial Overview
- Products Offered
- Key Developments
- SWOT Analysis
- Key Strategies
-
New Relic
- Financial Overview
- Products Offered
- Key Developments
- SWOT Analysis
- Key Strategies
-
Fortinet
- Financial Overview
- Products Offered
- Key Developments
- SWOT Analysis
- Key Strategies
-
Aternity
- Financial Overview
- Products Offered
- Key Developments
- SWOT Analysis
- Key Strategies
-
Zscaler
- Financial Overview
- Products Offered
- Key Developments
- SWOT Analysis
- Key Strategies
-
Riverbed Technology
- Financial Overview
- Products Offered
- Key Developments
- SWOT Analysis
- Key Strategies
-
ObserveIT
- Financial Overview
- Products Offered
- Key Developments
- SWOT Analysis
- Key Strategies
-
Dynatrace
- Financial Overview
- Products Offered
- Key Developments
- SWOT Analysis
- Key Strategies
-
Catchpoint
- Financial Overview
- Products Offered
- Key Developments
- SWOT Analysis
- Key Strategies
-
Splunk
- Financial Overview
- Products Offered
- Key Developments
- SWOT Analysis
- Key Strategies
-
MonitorScout
- Financial Overview
- Products Offered
- Key Developments
- SWOT Analysis
- Key Strategies
-
SolarWinds
- Financial Overview
- Products Offered
- Key Developments
- SWOT Analysis
- Key Strategies
-
Keynote
- Financial Overview
- Products Offered
- Key Developments
- SWOT Analysis
- Key Strategies
-
APPENDIX
-
References
-
Related Reports
-
LIST OF TABLES
-
LIST OF ASSUMPTIONS
-
NORTH AMERICA END USER EXPERIENCE MONITORING MARKET SIZE ESTIMATES & FORECAST, BY DEPLOYMENT TYPE, 2019-2032 (USD BILLIONS)
-
NORTH AMERICA END USER EXPERIENCE MONITORING MARKET SIZE ESTIMATES & FORECAST, BY END USER, 2019-2032 (USD BILLIONS)
-
NORTH AMERICA END USER EXPERIENCE MONITORING MARKET SIZE ESTIMATES & FORECAST, BY COMPONENT, 2019-2032 (USD BILLIONS)
-
NORTH AMERICA END USER EXPERIENCE MONITORING MARKET SIZE ESTIMATES & FORECAST, BY METHODOLOGY, 2019-2032 (USD BILLIONS)
-
NORTH AMERICA END USER EXPERIENCE MONITORING MARKET SIZE ESTIMATES & FORECAST, BY REGIONAL, 2019-2032 (USD BILLIONS)
-
US END USER EXPERIENCE MONITORING MARKET SIZE ESTIMATES & FORECAST, BY DEPLOYMENT TYPE, 2019-2032 (USD BILLIONS)
-
US END USER EXPERIENCE MONITORING MARKET SIZE ESTIMATES & FORECAST, BY END USER, 2019-2032 (USD BILLIONS)
-
US END USER EXPERIENCE MONITORING MARKET SIZE ESTIMATES & FORECAST, BY COMPONENT, 2019-2032 (USD BILLIONS)
-
US END USER EXPERIENCE MONITORING MARKET SIZE ESTIMATES & FORECAST, BY METHODOLOGY, 2019-2032 (USD BILLIONS)
-
US END USER EXPERIENCE MONITORING MARKET SIZE ESTIMATES & FORECAST, BY REGIONAL, 2019-2032 (USD BILLIONS)
-
CANADA END USER EXPERIENCE MONITORING MARKET SIZE ESTIMATES & FORECAST, BY DEPLOYMENT TYPE, 2019-2032 (USD BILLIONS)
-
CANADA END USER EXPERIENCE MONITORING MARKET SIZE ESTIMATES & FORECAST, BY END USER, 2019-2032 (USD BILLIONS)
-
CANADA END USER EXPERIENCE MONITORING MARKET SIZE ESTIMATES & FORECAST, BY COMPONENT, 2019-2032 (USD BILLIONS)
-
CANADA END USER EXPERIENCE MONITORING MARKET SIZE ESTIMATES & FORECAST, BY METHODOLOGY, 2019-2032 (USD BILLIONS)
-
CANADA END USER EXPERIENCE MONITORING MARKET SIZE ESTIMATES & FORECAST, BY REGIONAL, 2019-2032 (USD BILLIONS)
-
EUROPE END USER EXPERIENCE MONITORING MARKET SIZE ESTIMATES & FORECAST, BY DEPLOYMENT TYPE, 2019-2032 (USD BILLIONS)
-
EUROPE END USER EXPERIENCE MONITORING MARKET SIZE ESTIMATES & FORECAST, BY END USER, 2019-2032 (USD BILLIONS)
-
EUROPE END USER EXPERIENCE MONITORING MARKET SIZE ESTIMATES & FORECAST, BY COMPONENT, 2019-2032 (USD BILLIONS)
-
EUROPE END USER EXPERIENCE MONITORING MARKET SIZE ESTIMATES & FORECAST, BY METHODOLOGY, 2019-2032 (USD BILLIONS)
-
EUROPE END USER EXPERIENCE MONITORING MARKET SIZE ESTIMATES & FORECAST, BY REGIONAL, 2019-2032 (USD BILLIONS)
-
GERMANY END USER EXPERIENCE MONITORING MARKET SIZE ESTIMATES & FORECAST, BY DEPLOYMENT TYPE, 2019-2032 (USD BILLIONS)
-
GERMANY END USER EXPERIENCE MONITORING MARKET SIZE ESTIMATES & FORECAST, BY END USER, 2019-2032 (USD BILLIONS)
-
GERMANY END USER EXPERIENCE MONITORING MARKET SIZE ESTIMATES & FORECAST, BY COMPONENT, 2019-2032 (USD BILLIONS)
-
GERMANY END USER EXPERIENCE MONITORING MARKET SIZE ESTIMATES & FORECAST, BY METHODOLOGY, 2019-2032 (USD BILLIONS)
-
GERMANY END USER EXPERIENCE MONITORING MARKET SIZE ESTIMATES & FORECAST, BY REGIONAL, 2019-2032 (USD BILLIONS)
-
UK END USER EXPERIENCE MONITORING MARKET SIZE ESTIMATES & FORECAST, BY DEPLOYMENT TYPE, 2019-2032 (USD BILLIONS)
-
UK END USER EXPERIENCE MONITORING MARKET SIZE ESTIMATES & FORECAST, BY END USER, 2019-2032 (USD BILLIONS)
-
UK END USER EXPERIENCE MONITORING MARKET SIZE ESTIMATES & FORECAST, BY COMPONENT, 2019-2032 (USD BILLIONS)
-
UK END USER EXPERIENCE MONITORING MARKET SIZE ESTIMATES & FORECAST, BY METHODOLOGY, 2019-2032 (USD BILLIONS)
-
UK END USER EXPERIENCE MONITORING MARKET SIZE ESTIMATES & FORECAST, BY REGIONAL, 2019-2032 (USD BILLIONS)
-
FRANCE END USER EXPERIENCE MONITORING MARKET SIZE ESTIMATES & FORECAST, BY DEPLOYMENT TYPE, 2019-2032 (USD BILLIONS)
-
FRANCE END USER EXPERIENCE MONITORING MARKET SIZE ESTIMATES & FORECAST, BY END USER, 2019-2032 (USD BILLIONS)
-
FRANCE END USER EXPERIENCE MONITORING MARKET SIZE ESTIMATES & FORECAST, BY COMPONENT, 2019-2032 (USD BILLIONS)
-
FRANCE END USER EXPERIENCE MONITORING MARKET SIZE ESTIMATES & FORECAST, BY METHODOLOGY, 2019-2032 (USD BILLIONS)
-
FRANCE END USER EXPERIENCE MONITORING MARKET SIZE ESTIMATES & FORECAST, BY REGIONAL, 2019-2032 (USD BILLIONS)
-
RUSSIA END USER EXPERIENCE MONITORING MARKET SIZE ESTIMATES & FORECAST, BY DEPLOYMENT TYPE, 2019-2032 (USD BILLIONS)
-
RUSSIA END USER EXPERIENCE MONITORING MARKET SIZE ESTIMATES & FORECAST, BY END USER, 2019-2032 (USD BILLIONS)
-
RUSSIA END USER EXPERIENCE MONITORING MARKET SIZE ESTIMATES & FORECAST, BY COMPONENT, 2019-2032 (USD BILLIONS)
-
RUSSIA END USER EXPERIENCE MONITORING MARKET SIZE ESTIMATES & FORECAST, BY METHODOLOGY, 2019-2032 (USD BILLIONS)
-
RUSSIA END USER EXPERIENCE MONITORING MARKET SIZE ESTIMATES & FORECAST, BY REGIONAL, 2019-2032 (USD BILLIONS)
-
ITALY END USER EXPERIENCE MONITORING MARKET SIZE ESTIMATES & FORECAST, BY DEPLOYMENT TYPE, 2019-2032 (USD BILLIONS)
-
ITALY END USER EXPERIENCE MONITORING MARKET SIZE ESTIMATES & FORECAST, BY END USER, 2019-2032 (USD BILLIONS)
-
ITALY END USER EXPERIENCE MONITORING MARKET SIZE ESTIMATES & FORECAST, BY COMPONENT, 2019-2032 (USD BILLIONS)
-
ITALY END USER EXPERIENCE MONITORING MARKET SIZE ESTIMATES & FORECAST, BY METHODOLOGY, 2019-2032 (USD BILLIONS)
-
ITALY END USER EXPERIENCE MONITORING MARKET SIZE ESTIMATES & FORECAST, BY REGIONAL, 2019-2032 (USD BILLIONS)
-
SPAIN END USER EXPERIENCE MONITORING MARKET SIZE ESTIMATES & FORECAST, BY DEPLOYMENT TYPE, 2019-2032 (USD BILLIONS)
-
SPAIN END USER EXPERIENCE MONITORING MARKET SIZE ESTIMATES & FORECAST, BY END USER, 2019-2032 (USD BILLIONS)
-
SPAIN END USER EXPERIENCE MONITORING MARKET SIZE ESTIMATES & FORECAST, BY COMPONENT, 2019-2032 (USD BILLIONS)
-
SPAIN END USER EXPERIENCE MONITORING MARKET SIZE ESTIMATES & FORECAST, BY METHODOLOGY, 2019-2032 (USD BILLIONS)
-
SPAIN END USER EXPERIENCE MONITORING MARKET SIZE ESTIMATES & FORECAST, BY REGIONAL, 2019-2032 (USD BILLIONS)
-
REST OF EUROPE END USER EXPERIENCE MONITORING MARKET SIZE ESTIMATES & FORECAST, BY DEPLOYMENT TYPE, 2019-2032 (USD BILLIONS)
-
REST OF EUROPE END USER EXPERIENCE MONITORING MARKET SIZE ESTIMATES & FORECAST, BY END USER, 2019-2032 (USD BILLIONS)
-
REST OF EUROPE END USER EXPERIENCE MONITORING MARKET SIZE ESTIMATES & FORECAST, BY COMPONENT, 2019-2032 (USD BILLIONS)
-
REST OF EUROPE END USER EXPERIENCE MONITORING MARKET SIZE ESTIMATES & FORECAST, BY METHODOLOGY, 2019-2032 (USD BILLIONS)
-
REST OF EUROPE END USER EXPERIENCE MONITORING MARKET SIZE ESTIMATES & FORECAST, BY REGIONAL, 2019-2032 (USD BILLIONS)
-
APAC END USER EXPERIENCE MONITORING MARKET SIZE ESTIMATES & FORECAST, BY DEPLOYMENT TYPE, 2019-2032 (USD BILLIONS)
-
APAC END USER EXPERIENCE MONITORING MARKET SIZE ESTIMATES & FORECAST, BY END USER, 2019-2032 (USD BILLIONS)
-
APAC END USER EXPERIENCE MONITORING MARKET SIZE ESTIMATES & FORECAST, BY COMPONENT, 2019-2032 (USD BILLIONS)
-
APAC END USER EXPERIENCE MONITORING MARKET SIZE ESTIMATES & FORECAST, BY METHODOLOGY, 2019-2032 (USD BILLIONS)
-
APAC END USER EXPERIENCE MONITORING MARKET SIZE ESTIMATES & FORECAST, BY REGIONAL, 2019-2032 (USD BILLIONS)
-
CHINA END USER EXPERIENCE MONITORING MARKET SIZE ESTIMATES & FORECAST, BY DEPLOYMENT TYPE, 2019-2032 (USD BILLIONS)
-
CHINA END USER EXPERIENCE MONITORING MARKET SIZE ESTIMATES & FORECAST, BY END USER, 2019-2032 (USD BILLIONS)
-
CHINA END USER EXPERIENCE MONITORING MARKET SIZE ESTIMATES & FORECAST, BY COMPONENT, 2019-2032 (USD BILLIONS)
-
CHINA END USER EXPERIENCE MONITORING MARKET SIZE ESTIMATES & FORECAST, BY METHODOLOGY, 2019-2032 (USD BILLIONS)
-
CHINA END USER EXPERIENCE MONITORING MARKET SIZE ESTIMATES & FORECAST, BY REGIONAL, 2019-2032 (USD BILLIONS)
-
INDIA END USER EXPERIENCE MONITORING MARKET SIZE ESTIMATES & FORECAST, BY DEPLOYMENT TYPE, 2019-2032 (USD BILLIONS)
-
INDIA END USER EXPERIENCE MONITORING MARKET SIZE ESTIMATES & FORECAST, BY END USER, 2019-2032 (USD BILLIONS)
-
INDIA END USER EXPERIENCE MONITORING MARKET SIZE ESTIMATES & FORECAST, BY COMPONENT, 2019-2032 (USD BILLIONS)
-
INDIA END USER EXPERIENCE MONITORING MARKET SIZE ESTIMATES & FORECAST, BY METHODOLOGY, 2019-2032 (USD BILLIONS)
-
INDIA END USER EXPERIENCE MONITORING MARKET SIZE ESTIMATES & FORECAST, BY REGIONAL, 2019-2032 (USD BILLIONS)
-
JAPAN END USER EXPERIENCE MONITORING MARKET SIZE ESTIMATES & FORECAST, BY DEPLOYMENT TYPE, 2019-2032 (USD BILLIONS)
-
JAPAN END USER EXPERIENCE MONITORING MARKET SIZE ESTIMATES & FORECAST, BY END USER, 2019-2032 (USD BILLIONS)
-
JAPAN END USER EXPERIENCE MONITORING MARKET SIZE ESTIMATES & FORECAST, BY COMPONENT, 2019-2032 (USD BILLIONS)
-
JAPAN END USER EXPERIENCE MONITORING MARKET SIZE ESTIMATES & FORECAST, BY METHODOLOGY, 2019-2032 (USD BILLIONS)
-
JAPAN END USER EXPERIENCE MONITORING MARKET SIZE ESTIMATES & FORECAST, BY REGIONAL, 2019-2032 (USD BILLIONS)
-
SOUTH KOREA END USER EXPERIENCE MONITORING MARKET SIZE ESTIMATES & FORECAST, BY DEPLOYMENT TYPE, 2019-2032 (USD BILLIONS)
-
SOUTH KOREA END USER EXPERIENCE MONITORING MARKET SIZE ESTIMATES & FORECAST, BY END USER, 2019-2032 (USD BILLIONS)
-
SOUTH KOREA END USER EXPERIENCE MONITORING MARKET SIZE ESTIMATES & FORECAST, BY COMPONENT, 2019-2032 (USD BILLIONS)
-
SOUTH KOREA END USER EXPERIENCE MONITORING MARKET SIZE ESTIMATES & FORECAST, BY METHODOLOGY, 2019-2032 (USD BILLIONS)
-
SOUTH KOREA END USER EXPERIENCE MONITORING MARKET SIZE ESTIMATES & FORECAST, BY REGIONAL, 2019-2032 (USD BILLIONS)
-
MALAYSIA END USER EXPERIENCE MONITORING MARKET SIZE ESTIMATES & FORECAST, BY DEPLOYMENT TYPE, 2019-2032 (USD BILLIONS)
-
MALAYSIA END USER EXPERIENCE MONITORING MARKET SIZE ESTIMATES & FORECAST, BY END USER, 2019-2032 (USD BILLIONS)
-
MALAYSIA END USER EXPERIENCE MONITORING MARKET SIZE ESTIMATES & FORECAST, BY COMPONENT, 2019-2032 (USD BILLIONS)
-
MALAYSIA END USER EXPERIENCE MONITORING MARKET SIZE ESTIMATES & FORECAST, BY METHODOLOGY, 2019-2032 (USD BILLIONS)
-
MALAYSIA END USER EXPERIENCE MONITORING MARKET SIZE ESTIMATES & FORECAST, BY REGIONAL, 2019-2032 (USD BILLIONS)
-
THAILAND END USER EXPERIENCE MONITORING MARKET SIZE ESTIMATES & FORECAST, BY DEPLOYMENT TYPE, 2019-2032 (USD BILLIONS)
-
THAILAND END USER EXPERIENCE MONITORING MARKET SIZE ESTIMATES & FORECAST, BY END USER, 2019-2032 (USD BILLIONS)
-
THAILAND END USER EXPERIENCE MONITORING MARKET SIZE ESTIMATES & FORECAST, BY COMPONENT, 2019-2032 (USD BILLIONS)
-
THAILAND END USER EXPERIENCE MONITORING MARKET SIZE ESTIMATES & FORECAST, BY METHODOLOGY, 2019-2032 (USD BILLIONS)
-
THAILAND END USER EXPERIENCE MONITORING MARKET SIZE ESTIMATES & FORECAST, BY REGIONAL, 2019-2032 (USD BILLIONS)
-
INDONESIA END USER EXPERIENCE MONITORING MARKET SIZE ESTIMATES & FORECAST, BY DEPLOYMENT TYPE, 2019-2032 (USD BILLIONS)
-
INDONESIA END USER EXPERIENCE MONITORING MARKET SIZE ESTIMATES & FORECAST, BY END USER, 2019-2032 (USD BILLIONS)
-
INDONESIA END USER EXPERIENCE MONITORING MARKET SIZE ESTIMATES & FORECAST, BY COMPONENT, 2019-2032 (USD BILLIONS)
-
INDONESIA END USER EXPERIENCE MONITORING MARKET SIZE ESTIMATES & FORECAST, BY METHODOLOGY, 2019-2032 (USD BILLIONS)
-
INDONESIA END USER EXPERIENCE MONITORING MARKET SIZE ESTIMATES & FORECAST, BY REGIONAL, 2019-2032 (USD BILLIONS)
-
REST OF APAC END USER EXPERIENCE MONITORING MARKET SIZE ESTIMATES & FORECAST, BY DEPLOYMENT TYPE, 2019-2032 (USD BILLIONS)
-
REST OF APAC END USER EXPERIENCE MONITORING MARKET SIZE ESTIMATES & FORECAST, BY END USER, 2019-2032 (USD BILLIONS)
-
REST OF APAC END USER EXPERIENCE MONITORING MARKET SIZE ESTIMATES & FORECAST, BY COMPONENT, 2019-2032 (USD BILLIONS)
-
REST OF APAC END USER EXPERIENCE MONITORING MARKET SIZE ESTIMATES & FORECAST, BY METHODOLOGY, 2019-2032 (USD BILLIONS)
-
REST OF APAC END USER EXPERIENCE MONITORING MARKET SIZE ESTIMATES & FORECAST, BY REGIONAL, 2019-2032 (USD BILLIONS)
-
SOUTH AMERICA END USER EXPERIENCE MONITORING MARKET SIZE ESTIMATES & FORECAST, BY DEPLOYMENT TYPE, 2019-2032 (USD BILLIONS)
-
SOUTH AMERICA END USER EXPERIENCE MONITORING MARKET SIZE ESTIMATES & FORECAST, BY END USER, 2019-2032 (USD BILLIONS)
-
SOUTH AMERICA END USER EXPERIENCE MONITORING MARKET SIZE ESTIMATES & FORECAST, BY COMPONENT, 2019-2032 (USD BILLIONS)
-
SOUTH AMERICA END USER EXPERIENCE MONITORING MARKET SIZE ESTIMATES & FORECAST, BY METHODOLOGY, 2019-2032 (USD BILLIONS)
-
SOUTH AMERICA END USER EXPERIENCE MONITORING MARKET SIZE ESTIMATES & FORECAST, BY REGIONAL, 2019-2032 (USD BILLIONS)
-
BRAZIL END USER EXPERIENCE MONITORING MARKET SIZE ESTIMATES & FORECAST, BY DEPLOYMENT TYPE, 2019-2032 (USD BILLIONS)
-
BRAZIL END USER EXPERIENCE MONITORING MARKET SIZE ESTIMATES & FORECAST, BY END USER, 2019-2032 (USD BILLIONS)
-
BRAZIL END USER EXPERIENCE MONITORING MARKET SIZE ESTIMATES & FORECAST, BY COMPONENT, 2019-2032 (USD BILLIONS)
-
BRAZIL END USER EXPERIENCE MONITORING MARKET SIZE ESTIMATES & FORECAST, BY METHODOLOGY, 2019-2032 (USD BILLIONS)
-
BRAZIL END USER EXPERIENCE MONITORING MARKET SIZE ESTIMATES & FORECAST, BY REGIONAL, 2019-2032 (USD BILLIONS)
-
MEXICO END USER EXPERIENCE MONITORING MARKET SIZE ESTIMATES & FORECAST, BY DEPLOYMENT TYPE, 2019-2032 (USD BILLIONS)
-
MEXICO END USER EXPERIENCE MONITORING MARKET SIZE ESTIMATES & FORECAST, BY END USER, 2019-2032 (USD BILLIONS)
-
MEXICO END USER EXPERIENCE MONITORING MARKET SIZE ESTIMATES & FORECAST, BY COMPONENT, 2019-2032 (USD BILLIONS)
-
MEXICO END USER EXPERIENCE MONITORING MARKET SIZE ESTIMATES & FORECAST, BY METHODOLOGY, 2019-2032 (USD BILLIONS)
-
MEXICO END USER EXPERIENCE MONITORING MARKET SIZE ESTIMATES & FORECAST, BY REGIONAL, 2019-2032 (USD BILLIONS)
-
ARGENTINA END USER EXPERIENCE MONITORING MARKET SIZE ESTIMATES & FORECAST, BY DEPLOYMENT TYPE, 2019-2032 (USD BILLIONS)
-
ARGENTINA END USER EXPERIENCE MONITORING MARKET SIZE ESTIMATES & FORECAST, BY END USER, 2019-2032 (USD BILLIONS)
-
ARGENTINA END USER EXPERIENCE MONITORING MARKET SIZE ESTIMATES & FORECAST, BY COMPONENT, 2019-2032 (USD BILLIONS)
-
ARGENTINA END USER EXPERIENCE MONITORING MARKET SIZE ESTIMATES & FORECAST, BY METHODOLOGY, 2019-2032 (USD BILLIONS)
-
ARGENTINA END USER EXPERIENCE MONITORING MARKET SIZE ESTIMATES & FORECAST, BY REGIONAL, 2019-2032 (USD BILLIONS)
-
REST OF SOUTH AMERICA END USER EXPERIENCE MONITORING MARKET SIZE ESTIMATES & FORECAST, BY DEPLOYMENT TYPE, 2019-2032 (USD BILLIONS)
-
REST OF SOUTH AMERICA END USER EXPERIENCE MONITORING MARKET SIZE ESTIMATES & FORECAST, BY END USER, 2019-2032 (USD BILLIONS)
-
REST OF SOUTH AMERICA END USER EXPERIENCE MONITORING MARKET SIZE ESTIMATES & FORECAST, BY COMPONENT, 2019-2032 (USD BILLIONS)
-
REST OF SOUTH AMERICA END USER EXPERIENCE MONITORING MARKET SIZE ESTIMATES & FORECAST, BY METHODOLOGY, 2019-2032 (USD BILLIONS)
-
REST OF SOUTH AMERICA END USER EXPERIENCE MONITORING MARKET SIZE ESTIMATES & FORECAST, BY REGIONAL, 2019-2032 (USD BILLIONS)
-
MEA END USER EXPERIENCE MONITORING MARKET SIZE ESTIMATES & FORECAST, BY DEPLOYMENT TYPE, 2019-2032 (USD BILLIONS)
-
MEA END USER EXPERIENCE MONITORING MARKET SIZE ESTIMATES & FORECAST, BY END USER, 2019-2032 (USD BILLIONS)
-
MEA END USER EXPERIENCE MONITORING MARKET SIZE ESTIMATES & FORECAST, BY COMPONENT, 2019-2032 (USD BILLIONS)
-
MEA END USER EXPERIENCE MONITORING MARKET SIZE ESTIMATES & FORECAST, BY METHODOLOGY, 2019-2032 (USD BILLIONS)
-
MEA END USER EXPERIENCE MONITORING MARKET SIZE ESTIMATES & FORECAST, BY REGIONAL, 2019-2032 (USD BILLIONS)
-
GCC COUNTRIES END USER EXPERIENCE MONITORING MARKET SIZE ESTIMATES & FORECAST, BY DEPLOYMENT TYPE, 2019-2032 (USD BILLIONS)
-
GCC COUNTRIES END USER EXPERIENCE MONITORING MARKET SIZE ESTIMATES & FORECAST, BY END USER, 2019-2032 (USD BILLIONS)
-
GCC COUNTRIES END USER EXPERIENCE MONITORING MARKET SIZE ESTIMATES & FORECAST, BY COMPONENT, 2019-2032 (USD BILLIONS)
-
GCC COUNTRIES END USER EXPERIENCE MONITORING MARKET SIZE ESTIMATES & FORECAST, BY METHODOLOGY, 2019-2032 (USD BILLIONS)
-
GCC COUNTRIES END USER EXPERIENCE MONITORING MARKET SIZE ESTIMATES & FORECAST, BY REGIONAL, 2019-2032 (USD BILLIONS)
-
SOUTH AFRICA END USER EXPERIENCE MONITORING MARKET SIZE ESTIMATES & FORECAST, BY DEPLOYMENT TYPE, 2019-2032 (USD BILLIONS)
-
SOUTH AFRICA END USER EXPERIENCE MONITORING MARKET SIZE ESTIMATES & FORECAST, BY END USER, 2019-2032 (USD BILLIONS)
-
SOUTH AFRICA END USER EXPERIENCE MONITORING MARKET SIZE ESTIMATES & FORECAST, BY COMPONENT, 2019-2032 (USD BILLIONS)
-
SOUTH AFRICA END USER EXPERIENCE MONITORING MARKET SIZE ESTIMATES & FORECAST, BY METHODOLOGY, 2019-2032 (USD BILLIONS)
-
SOUTH AFRICA END USER EXPERIENCE MONITORING MARKET SIZE ESTIMATES & FORECAST, BY REGIONAL, 2019-2032 (USD BILLIONS)
-
REST OF MEA END USER EXPERIENCE MONITORING MARKET SIZE ESTIMATES & FORECAST, BY DEPLOYMENT TYPE, 2019-2032 (USD BILLIONS)
-
REST OF MEA END USER EXPERIENCE MONITORING MARKET SIZE ESTIMATES & FORECAST, BY END USER, 2019-2032 (USD BILLIONS)
-
REST OF MEA END USER EXPERIENCE MONITORING MARKET SIZE ESTIMATES & FORECAST, BY COMPONENT, 2019-2032 (USD BILLIONS)
-
REST OF MEA END USER EXPERIENCE MONITORING MARKET SIZE ESTIMATES & FORECAST, BY METHODOLOGY, 2019-2032 (USD BILLIONS)
-
REST OF MEA END USER EXPERIENCE MONITORING MARKET SIZE ESTIMATES & FORECAST, BY REGIONAL, 2019-2032 (USD BILLIONS)
-
PRODUCT LAUNCH/PRODUCT DEVELOPMENT/APPROVAL
-
ACQUISITION/PARTNERSHIP
-
LIST OF FIGURES
-
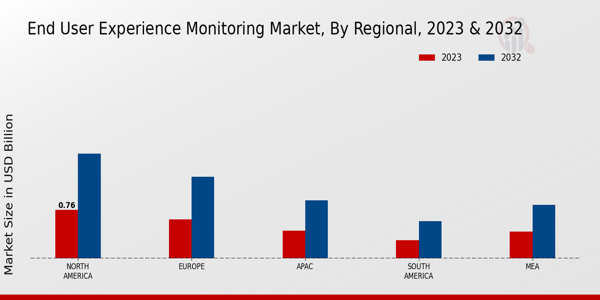
MARKET SYNOPSIS
-
NORTH AMERICA END USER EXPERIENCE MONITORING MARKET ANALYSIS
-
US END USER EXPERIENCE MONITORING MARKET ANALYSIS BY DEPLOYMENT TYPE
-
US END USER EXPERIENCE MONITORING MARKET ANALYSIS BY END USER
-
US END USER EXPERIENCE MONITORING MARKET ANALYSIS BY COMPONENT
-
US END USER EXPERIENCE MONITORING MARKET ANALYSIS BY METHODOLOGY
-
US END USER EXPERIENCE MONITORING MARKET ANALYSIS BY REGIONAL
-
CANADA END USER EXPERIENCE MONITORING MARKET ANALYSIS BY DEPLOYMENT TYPE
-
CANADA END USER EXPERIENCE MONITORING MARKET ANALYSIS BY END USER
-
CANADA END USER EXPERIENCE MONITORING MARKET ANALYSIS BY COMPONENT
-
CANADA END USER EXPERIENCE MONITORING MARKET ANALYSIS BY METHODOLOGY
-
CANADA END USER EXPERIENCE MONITORING MARKET ANALYSIS BY REGIONAL
-
EUROPE END USER EXPERIENCE MONITORING MARKET ANALYSIS
-
GERMANY END USER EXPERIENCE MONITORING MARKET ANALYSIS BY DEPLOYMENT TYPE
-
GERMANY END USER EXPERIENCE MONITORING MARKET ANALYSIS BY END USER
-
GERMANY END USER EXPERIENCE MONITORING MARKET ANALYSIS BY COMPONENT
-
GERMANY END USER EXPERIENCE MONITORING MARKET ANALYSIS BY METHODOLOGY
-
GERMANY END USER EXPERIENCE MONITORING MARKET ANALYSIS BY REGIONAL
-
UK END USER EXPERIENCE MONITORING MARKET ANALYSIS BY DEPLOYMENT TYPE
-
UK END USER EXPERIENCE MONITORING MARKET ANALYSIS BY END USER
-
UK END USER EXPERIENCE MONITORING MARKET ANALYSIS BY COMPONENT
-
UK END USER EXPERIENCE MONITORING MARKET ANALYSIS BY METHODOLOGY
-
UK END USER EXPERIENCE MONITORING MARKET ANALYSIS BY REGIONAL
-
FRANCE END USER EXPERIENCE MONITORING MARKET ANALYSIS BY DEPLOYMENT TYPE
-
FRANCE END USER EXPERIENCE MONITORING MARKET ANALYSIS BY END USER
-
FRANCE END USER EXPERIENCE MONITORING MARKET ANALYSIS BY COMPONENT
-
FRANCE END USER EXPERIENCE MONITORING MARKET ANALYSIS BY METHODOLOGY
-
FRANCE END USER EXPERIENCE MONITORING MARKET ANALYSIS BY REGIONAL
-
RUSSIA END USER EXPERIENCE MONITORING MARKET ANALYSIS BY DEPLOYMENT TYPE
-
RUSSIA END USER EXPERIENCE MONITORING MARKET ANALYSIS BY END USER
-
RUSSIA END USER EXPERIENCE MONITORING MARKET ANALYSIS BY COMPONENT
-
RUSSIA END USER EXPERIENCE MONITORING MARKET ANALYSIS BY METHODOLOGY
-
RUSSIA END USER EXPERIENCE MONITORING MARKET ANALYSIS BY REGIONAL
-
ITALY END USER EXPERIENCE MONITORING MARKET ANALYSIS BY DEPLOYMENT TYPE
-
ITALY END USER EXPERIENCE MONITORING MARKET ANALYSIS BY END USER
-
ITALY END USER EXPERIENCE MONITORING MARKET ANALYSIS BY COMPONENT
-
ITALY END USER EXPERIENCE MONITORING MARKET ANALYSIS BY METHODOLOGY
-
ITALY END USER EXPERIENCE MONITORING MARKET ANALYSIS BY REGIONAL
-
SPAIN END USER EXPERIENCE MONITORING MARKET ANALYSIS BY DEPLOYMENT TYPE
-
SPAIN END USER EXPERIENCE MONITORING MARKET ANALYSIS BY END USER
-
SPAIN END USER EXPERIENCE MONITORING MARKET ANALYSIS BY COMPONENT
-
SPAIN END USER EXPERIENCE MONITORING MARKET ANALYSIS BY METHODOLOGY
-
SPAIN END USER EXPERIENCE MONITORING MARKET ANALYSIS BY REGIONAL
-
REST OF EUROPE END USER EXPERIENCE MONITORING MARKET ANALYSIS BY DEPLOYMENT TYPE
-
REST OF EUROPE END USER EXPERIENCE MONITORING MARKET ANALYSIS BY END USER
-
REST OF EUROPE END USER EXPERIENCE MONITORING MARKET ANALYSIS BY COMPONENT
-
REST OF EUROPE END USER EXPERIENCE MONITORING MARKET ANALYSIS BY METHODOLOGY
-
REST OF EUROPE END USER EXPERIENCE MONITORING MARKET ANALYSIS BY REGIONAL
-
APAC END USER EXPERIENCE MONITORING MARKET ANALYSIS
-
CHINA END USER EXPERIENCE MONITORING MARKET ANALYSIS BY DEPLOYMENT TYPE
-
CHINA END USER EXPERIENCE MONITORING MARKET ANALYSIS BY END USER
-
CHINA END USER EXPERIENCE MONITORING MARKET ANALYSIS BY COMPONENT
-
CHINA END USER EXPERIENCE MONITORING MARKET ANALYSIS BY METHODOLOGY
-
CHINA END USER EXPERIENCE MONITORING MARKET ANALYSIS BY REGIONAL
-
INDIA END USER EXPERIENCE MONITORING MARKET ANALYSIS BY DEPLOYMENT TYPE
-
INDIA END USER EXPERIENCE MONITORING MARKET ANALYSIS BY END USER
-
INDIA END USER EXPERIENCE MONITORING MARKET ANALYSIS BY COMPONENT
-
INDIA END USER EXPERIENCE MONITORING MARKET ANALYSIS BY METHODOLOGY
-
INDIA END USER EXPERIENCE MONITORING MARKET ANALYSIS BY REGIONAL
-
JAPAN END USER EXPERIENCE MONITORING MARKET ANALYSIS BY DEPLOYMENT TYPE
-
JAPAN END USER EXPERIENCE MONITORING MARKET ANALYSIS BY END USER
-
JAPAN END USER EXPERIENCE MONITORING MARKET ANALYSIS BY COMPONENT
-
JAPAN END USER EXPERIENCE MONITORING MARKET ANALYSIS BY METHODOLOGY
-
JAPAN END USER EXPERIENCE MONITORING MARKET ANALYSIS BY REGIONAL
-
SOUTH KOREA END USER EXPERIENCE MONITORING MARKET ANALYSIS BY DEPLOYMENT TYPE
-
SOUTH KOREA END USER EXPERIENCE MONITORING MARKET ANALYSIS BY END USER
-
SOUTH KOREA END USER EXPERIENCE MONITORING MARKET ANALYSIS BY COMPONENT
-
SOUTH KOREA END USER EXPERIENCE MONITORING MARKET ANALYSIS BY METHODOLOGY
-
SOUTH KOREA END USER EXPERIENCE MONITORING MARKET ANALYSIS BY REGIONAL
-
MALAYSIA END USER EXPERIENCE MONITORING MARKET ANALYSIS BY DEPLOYMENT TYPE
-
MALAYSIA END USER EXPERIENCE MONITORING MARKET ANALYSIS BY END USER
-
MALAYSIA END USER EXPERIENCE MONITORING MARKET ANALYSIS BY COMPONENT
-
MALAYSIA END USER EXPERIENCE MONITORING MARKET ANALYSIS BY METHODOLOGY
-
MALAYSIA END USER EXPERIENCE MONITORING MARKET ANALYSIS BY REGIONAL
-
THAILAND END USER EXPERIENCE MONITORING MARKET ANALYSIS BY DEPLOYMENT TYPE
-
THAILAND END USER EXPERIENCE MONITORING MARKET ANALYSIS BY END USER
-
THAILAND END USER EXPERIENCE MONITORING MARKET ANALYSIS BY COMPONENT
-
THAILAND END USER EXPERIENCE MONITORING MARKET ANALYSIS BY METHODOLOGY
-
THAILAND END USER EXPERIENCE MONITORING MARKET ANALYSIS BY REGIONAL
-
INDONESIA END USER EXPERIENCE MONITORING MARKET ANALYSIS BY DEPLOYMENT TYPE
-
INDONESIA END USER EXPERIENCE MONITORING MARKET ANALYSIS BY END USER
-
INDONESIA END USER EXPERIENCE MONITORING MARKET ANALYSIS BY COMPONENT
-
INDONESIA END USER EXPERIENCE MONITORING MARKET ANALYSIS BY METHODOLOGY
-
INDONESIA END USER EXPERIENCE MONITORING MARKET ANALYSIS BY REGIONAL
-
REST OF APAC END USER EXPERIENCE MONITORING MARKET ANALYSIS BY DEPLOYMENT TYPE
-
REST OF APAC END USER EXPERIENCE MONITORING MARKET ANALYSIS BY END USER
-
REST OF APAC END USER EXPERIENCE MONITORING MARKET ANALYSIS BY COMPONENT
-
REST OF APAC END USER EXPERIENCE MONITORING MARKET ANALYSIS BY METHODOLOGY
-
REST OF APAC END USER EXPERIENCE MONITORING MARKET ANALYSIS BY REGIONAL
-
SOUTH AMERICA END USER EXPERIENCE MONITORING MARKET ANALYSIS
-
BRAZIL END USER EXPERIENCE MONITORING MARKET ANALYSIS BY DEPLOYMENT TYPE
-
BRAZIL END USER EXPERIENCE MONITORING MARKET ANALYSIS BY END USER
-
BRAZIL END USER EXPERIENCE MONITORING MARKET ANALYSIS BY COMPONENT
-
BRAZIL END USER EXPERIENCE MONITORING MARKET ANALYSIS BY METHODOLOGY
-
BRAZIL END USER EXPERIENCE MONITORING MARKET ANALYSIS BY REGIONAL
-
MEXICO END USER EXPERIENCE MONITORING MARKET ANALYSIS BY DEPLOYMENT TYPE
-
MEXICO END USER EXPERIENCE MONITORING MARKET ANALYSIS BY END USER
-
MEXICO END USER EXPERIENCE MONITORING MARKET ANALYSIS BY COMPONENT
-
MEXICO END USER EXPERIENCE MONITORING MARKET ANALYSIS BY METHODOLOGY
-
MEXICO END USER EXPERIENCE MONITORING MARKET ANALYSIS BY REGIONAL
-
ARGENTINA END USER EXPERIENCE MONITORING MARKET ANALYSIS BY DEPLOYMENT TYPE
-
ARGENTINA END USER EXPERIENCE MONITORING MARKET ANALYSIS BY END USER
-
ARGENTINA END USER EXPERIENCE MONITORING MARKET ANALYSIS BY COMPONENT
-
ARGENTINA END USER EXPERIENCE MONITORING MARKET ANALYSIS BY METHODOLOGY
-
ARGENTINA END USER EXPERIENCE MONITORING MARKET ANALYSIS BY REGIONAL
-
REST OF SOUTH AMERICA END USER EXPERIENCE MONITORING MARKET ANALYSIS BY DEPLOYMENT TYPE
-
REST OF SOUTH AMERICA END USER EXPERIENCE MONITORING MARKET ANALYSIS BY END USER
-
REST OF SOUTH AMERICA END USER EXPERIENCE MONITORING MARKET ANALYSIS BY COMPONENT
-
REST OF SOUTH AMERICA END USER EXPERIENCE MONITORING MARKET ANALYSIS BY METHODOLOGY
-
REST OF SOUTH AMERICA END USER EXPERIENCE MONITORING MARKET ANALYSIS BY REGIONAL
-
MEA END USER EXPERIENCE MONITORING MARKET ANALYSIS
-
GCC COUNTRIES END USER EXPERIENCE MONITORING MARKET ANALYSIS BY DEPLOYMENT TYPE
-
GCC COUNTRIES END USER EXPERIENCE MONITORING MARKET ANALYSIS BY END USER
-
GCC COUNTRIES END USER EXPERIENCE MONITORING MARKET ANALYSIS BY COMPONENT
-
GCC COUNTRIES END USER EXPERIENCE MONITORING MARKET ANALYSIS BY METHODOLOGY
-
GCC COUNTRIES END USER EXPERIENCE MONITORING MARKET ANALYSIS BY REGIONAL
-
SOUTH AFRICA END USER EXPERIENCE MONITORING MARKET ANALYSIS BY DEPLOYMENT TYPE
-
SOUTH AFRICA END USER EXPERIENCE MONITORING MARKET ANALYSIS BY END USER
-
SOUTH AFRICA END USER EXPERIENCE MONITORING MARKET ANALYSIS BY COMPONENT
-
SOUTH AFRICA END USER EXPERIENCE MONITORING MARKET ANALYSIS BY METHODOLOGY
-
SOUTH AFRICA END USER EXPERIENCE MONITORING MARKET ANALYSIS BY REGIONAL
-
REST OF MEA END USER EXPERIENCE MONITORING MARKET ANALYSIS BY DEPLOYMENT TYPE
-
REST OF MEA END USER EXPERIENCE MONITORING MARKET ANALYSIS BY END USER
-
REST OF MEA END USER EXPERIENCE MONITORING MARKET ANALYSIS BY COMPONENT
-
REST OF MEA END USER EXPERIENCE MONITORING MARKET ANALYSIS BY METHODOLOGY
-
REST OF MEA END USER EXPERIENCE MONITORING MARKET ANALYSIS BY REGIONAL
-
KEY BUYING CRITERIA OF END USER EXPERIENCE MONITORING MARKET
-
RESEARCH PROCESS OF MRFR
-
DRO ANALYSIS OF END USER EXPERIENCE MONITORING MARKET
-
DRIVERS IMPACT ANALYSIS: END USER EXPERIENCE MONITORING MARKET
-
RESTRAINTS IMPACT ANALYSIS: END USER EXPERIENCE MONITORING MARKET
-
SUPPLY / VALUE CHAIN: END USER EXPERIENCE MONITORING MARKET
-
END USER EXPERIENCE MONITORING MARKET, BY DEPLOYMENT TYPE, 2024 (% SHARE)
-
END USER EXPERIENCE MONITORING MARKET, BY DEPLOYMENT TYPE, 2019 TO 2032 (USD Billions)
-
END USER EXPERIENCE MONITORING MARKET, BY END USER, 2024 (% SHARE)
-
END USER EXPERIENCE MONITORING MARKET, BY END USER, 2019 TO 2032 (USD Billions)
-
END USER EXPERIENCE MONITORING MARKET, BY COMPONENT, 2024 (% SHARE)
-
END USER EXPERIENCE MONITORING MARKET, BY COMPONENT, 2019 TO 2032 (USD Billions)
-
END USER EXPERIENCE MONITORING MARKET, BY METHODOLOGY, 2024 (% SHARE)
-
END USER EXPERIENCE MONITORING MARKET, BY METHODOLOGY, 2019 TO 2032 (USD Billions)
-
END USER EXPERIENCE MONITORING MARKET, BY REGIONAL, 2024 (% SHARE)
-
END USER EXPERIENCE MONITORING MARKET, BY REGIONAL, 2019 TO 2032 (USD Billions)
-
BENCHMARKING OF MAJOR COMPETITORS


Leave a Comment