• Cat-intel
  • MedIntelliX
  • Resources
  • About Us
  • Hero Background
    English
    Chinese
    French
    Japanese
    Korean
    German
    Spanish

    Feed Palatability Enhancers Market Analysis

    ID: MRFR/AGR/3874-HCR
    90 Pages
    Varsha More
    October 2025

    Feed Palatability Enhancers Market Research Report Information by Type (Feed Flavors & Sweeteners, Feed Texturants and others), Source (Natural and Synthetic), Livestock (Swine, Poultry, Ruminants, Aquaculture, Pet Food and others) and Region (North America, Europe, Asia-Pacific and Rest of the World) - Forecast till 2035

    Share:
    Download PDF ×

    We do not share your information with anyone. However, we may send you emails based on your report interest from time to time. You may contact us at any time to opt-out.

    Feed Palatability Enhancers Market Infographic
    $ 4,950.0
    $ 5,950.0
    $ 7,250.0

    Market Analysis

    In-depth Analysis of Feed Palatability Enhancers Market Industry Landscape

    The feed palatability enhancer market owes its dynamism to several factors that shape it collectively. To start with, these enhancements are demanded mainly by those engaged in rearing livestock or fish. Consumers' taste and awareness of how nutrition can influence the health status of animals greatly contribute to feeder attractiveness enhancement product range size. Regulatory frameworks play an important role in shaping feed palatability enhancers as market regulations are in place to ensure the safety and efficacy of feed additives used in animal production. A change in regulation, such as the introduction of new ingredients or banning some additives, can greatly affect the markets. For feed palatability enhancers businesses, these rules need to be adhered to for them to sell their products. Research and development (R&D) activities are crucial for feed palatability enhancers, which causes a change in market dynamics. Ongoing efforts that aim to identify new ingredients and formulations desirable for increasing the palatability of feeds while meeting nutritional requirements are essential for this growth. Global economic factors also play a significant role in shaping the feed palatability enhancers market. Fluctuations in feed prices, income levels, and consumer spending habits determine whether farmers will purchase stockfeed enhancers. Market competition and the presence of major players equally influence the size of the feed palatability enhancer industry. The highly regarded former firms with wide ranging product lines become dominant, thus making it hard for new entrants to venture into this field. By 2022, the Feed palatability enhancer Market Size had grown to USD 7.6 billion. By 2030, it is predicted to rise to USD 9.74807 billion from USD 7.87512 billion in the year 2023, as per forecasts indicating market expansion. This represents a compound annual growth rate (CAGR) of 3.62% during the forecast period between 2023 and 2030. Environmental sustainability and ethical concerns are some of the emerging forces that have influenced the feed palatability enhancers market. The need for sustainable and ethically produced animal products is growing due to increased consciousness regarding environmental effects on livestock and aquaculture industries. A sector that is dynamic as well as competitive is the feed palatability enhancers market, where firms employ different tactics to establish or even enhance their position in this specific industry. Consequently, they are essential when it comes to improving the palatability and consumption of animal feeds, which characterizes the pet food industries as well as those concerned with raising animals. The significance of marketing and branding can never be underestimated when it comes to influencing market share.

    Author
    Varsha More
    Research Analyst

    Experienced business professional with a demonstrated history of working in the CFnB industry. Skilled in market research, and market estimation. Strong professional with a Masters focused in marketing management.

    Leave a Comment

    FAQs

    How much is the Feed Palatability Enhancer market?

    The Feed Palatability Enhancer Market size was valued at USD 7.6 Billion in 2023.

    What is the growth rate of the Feed Palatability Enhancer market?

    The Global market is projected to grow at a CAGR of 3.62% during the forecast period, 2024-2032.

    Which region held the largest market share in the Feed Palatability Enhancer market?

    Asia Pacific had the largest share of the Global market

    Who are the key players in the Feed Palatability Enhancer market?

    The key players in the market are Eli Lilly and Company (US), Kerry Group (Ireland), and Associated British Foods Plc. (UK), Diana Foods (France).

    Which type led the Feed Palatability Enhancer market?

    The Feed Flavors & Sweeteners category dominated the market in 2022.

    Which Source had the largest market share in the Feed Palatability Enhancer market?

    The Natural segment had the largest share of the Global market.

    Market Summary

    As per Market Research Future Analysis, the Global Feed Palatability Enhancer Market was valued at USD 7.88 billion in 2024 and is projected to reach USD 11.65 billion by 2035, growing at a CAGR of 3.62% from 2025 to 2035. The market growth is driven by increasing meat consumption and rising income levels, particularly in developing nations. The demand for feed palatability enhancers is further fueled by health-conscious consumer preferences for premium meat products and the rising costs of meat due to disease outbreaks. The market is segmented by type, source, and livestock, with the Feed Flavors & Sweeteners segment holding the majority share in 2022. The Asia-Pacific region accounted for USD 7.88 billion in 2024, indicating significant growth potential.

    Key Market Trends & Highlights

    Key trends driving the Feed Palatability Enhancer Market include:

    • Growing meat consumption worldwide is boosting market demand.
    • Natural feed additives are projected to be the fastest-growing segment during 2022-2030.
    • Poultry segment dominated the market in 2022 and is expected to grow rapidly.
    • Rising pet ownership and healthcare spending in developing nations are driving revenue.

    Market Size & Forecast

    2024 Market Size USD 7.88 Billion
    2035 Market Size USD 11.65 Billion
    CAGR (2024-2035) 3.62%
    Largest Regional Market Share in 2022 Asia-Pacific.

    Major Players

    Major players include Eli Lilly and Company (US), Kerry Group (Ireland), Associated British Foods Plc. (UK), Diana Foods (France), DuPont (US), and Kemin Industries Inc. (US).

    Market Trends

    Market is Being Driven by Growing Meat Consumption to boost the market growth

    Rapid increases in meat consumption worldwide have fueled the market for feed palatability enhancers. The demand for feed palatability enhancers is rising Globally as health-conscious consumers' preferences for premium meat and meat products do. The FAO projects that by 2020, poultry meat production will have increased in China, the EU, Britain, Brazil, and Mexico, bringing the total amount produced to 137 million tonnes. Demand for premium meat and meat products has increased as income levels have increased in most developing nations.

    Due to the lower costs of producing beef due to the large area of land used for grazing, the per capita meat consumption is also increasing in the United States, Brazil, and Argentina. Palatability enhancers formulate unpleasant additives and supplements in livestock feed, increasing the feed intake of animals. The demand for feed palatability enhancers has increased because the region’s consumers are becoming more knowledgeable about high-quality feed and pet food. The market for feed palatability enhancers has also grown due to the rising cost of meat caused by numerous disease outbreaks like the African Swine Fever.

    The increase in pet ownership, healthcare spending, and income levels in developing nations like China and India drives the feed palatability enhancers market revenue.

    One of the world's top producers of poultry meat is India. The demand for and consumption of poultry has grown significantly over time due to rising average incomes and urban populations. The region's poultry production has been rapidly increasing, which will increase the need for flavor enhancers to boost feed intake and livestock performance. Applying natural phenolic compounds from aromatic plants is also known to enhance the flavor and palatability of the feed in swine and poultry diets. Increasing feed intake and growth efficiency has recently enhanced the Feed Palatability Enhancer market CAGR globally.

    The increasing demand for high-quality animal feed, driven by a focus on livestock health and productivity, appears to be propelling the growth of the feed palatability enhancer market.

    U.S. Department of Agriculture

    Feed Palatability Enhancers Market Market Drivers

    Consumer Awareness and Preferences

    The Global Feed Palatability Enhancer Market Industry is shaped by increasing consumer awareness regarding animal welfare and nutrition. As consumers demand higher quality meat and dairy products, producers are compelled to invest in feed solutions that enhance palatability and nutritional value. This shift is evident in the growing preference for natural and organic feed additives, which are perceived as healthier options for livestock. The market's expansion reflects these changing consumer preferences, as producers seek to meet the rising expectations for quality and sustainability in animal products.

    Rising Demand for Animal Nutrition

    The Global Feed Palatability Enhancer Market Industry experiences a notable surge in demand for enhanced animal nutrition. As livestock producers increasingly recognize the importance of feed quality in promoting animal health and productivity, the market is projected to reach 7.88 USD Billion in 2024. This growth is driven by the need for improved feed formulations that enhance palatability, thereby ensuring higher feed intake and better growth rates in animals. The emphasis on sustainable and efficient livestock production further propels the adoption of palatability enhancers, as they contribute to overall feed efficiency and animal welfare.

    Increasing Focus on Livestock Health

    The Global Feed Palatability Enhancer Market Industry is significantly influenced by the growing emphasis on livestock health. Producers are increasingly aware that palatable feed can lead to better nutrient absorption and overall health in animals. This trend is reflected in the market's projected growth, with an anticipated value of 10.8 USD Billion by 2035. Enhanced palatability not only encourages feed consumption but also supports the immune system of livestock, reducing the need for antibiotics. As regulations around antibiotic use tighten, the demand for palatability enhancers that promote health without compromising animal welfare is likely to rise.

    Technological Advancements in Feed Formulation

    The Global Feed Palatability Enhancer Market Industry benefits from ongoing technological advancements in feed formulation. Innovations in flavoring agents and additives are enabling manufacturers to create more appealing feed products that cater to the specific preferences of various animal species. This evolution is crucial as it aligns with the industry's shift towards personalized nutrition. The market is expected to grow at a CAGR of 2.95% from 2025 to 2035, indicating a sustained interest in developing novel palatability enhancers that can improve feed acceptance and overall animal performance.

    Regulatory Support for Feed Quality Improvement

    The Global Feed Palatability Enhancer Market Industry is positively impacted by regulatory support aimed at improving feed quality. Governments worldwide are implementing policies that encourage the use of feed additives that enhance palatability and nutritional value. These regulations are designed to ensure that livestock receive high-quality feed, which in turn supports animal health and productivity. As a result, the market is likely to see increased investment in research and development of palatability enhancers, fostering innovation and compliance with safety standards.

    Market Segment Insights

    Feed Palatability Enhancer Type Insights

    Based on type, the Feed Palatability Enhancer Market segmentation includes Feed Flavors & Sweeteners, Feed Texturants, and others. The Feed Flavors & Sweeteners segment held the majority share in 2022 contribution concerning the Feed Palatability Enhancer Market revenue. Animals' appetites can be increased, and feed intake can be enhanced by adding flavors and sweeteners to animal feed. The flavor and sweetener addition can conceal bad odors and unpleasant flavors, which may cause animals to consume more feed. To entice farm animals to consume the feed, they are frequently used in medicated feed containing byproducts with an unpleasant odor and taste.

    It is anticipated that these elements will fuel the market in the years to come.

    Feed Palatability Enhancer Source Insights

    Based on the Source, the Feed Palatability Enhancer Market segmentation includes Natural and Synthetic. The Natural segment dominated the market in 2022 and is projected to be the faster-growing segment during the forecast period, 2022-2030. Natural feed additives like prebiotics, advantageous microorganisms, bacteriocins, phytogenic compounds, and organic acids have the potential to open up new avenues for research into human or animal nutrition and health. They can also meet the growing demand for natural products among consumers implants for Feed Palatability Enhancer positively impacts market growth.

    Figure 1: Feed Palatability Enhancer Market, by Source, 2022 & 2030 (USD Billion)

    Source: Secondary Research, Primary Research, Market Research Future Database and Analyst Review

    Feed Palatability Enhancer Livestock Insights

    Livestock has bifurcated the Feed Palatability Enhancer Market data into Swine, Poultry, Ruminants, Aquaculture, Pet Food, and others. The Poultry segment dominated the market in 2022 and is projected to be the faster-growing segment during the forecast period, 2022-2030. The food of birds is very bland because additives are used to increase feed intake in poultry. Since their palates cannot distinguish between flavors, additives like flavor enhancers can be added to their food to improve its taste and appeal, encouraging the birds to eat more.

    Get more detailed insights about Feed Palatability Enhancer Market Research Report - Global Forecast till 2032

    Regional Insights

    By Region, the study provides market insights into North America, Europe, Asia-Pacific and the Rest of the World. Asia Pacific Feed Palatability Enhancer market accounted for USD 3.4808 billion in 2022 and is expected to exhibit a significant CAGR growth during the study period. The demand for feed palatability enhancers has increased because the region’s consumers are becoming more knowledgeable about high-quality feed and pet food. The market for feed palatability enhancers has also grown due to the rising cost of meat caused by numerous disease outbreaks like the African Swine Fever.

    The increase in pet ownership, healthcare spending, and income levels in developing nations like China and India drives the market for feed palatability enhancers.

    Further, the major countries studied in the market report are The U.S., Canada, Germany, France, the UK, Italy, Spain, China, Japan, India, Australia, South Korea, and Brazil.

    Figure 2: FEED PALATABILITY ENHANCER MARKET SHARE BY REGION 2022 (%)FEED PALATABILITY ENHANCER MARKET SHARE BY REGION 2022 (%)

    Source: Secondary Research, Primary Research, Market Research Future Database and Analyst Review

    Europe's Feed Palatability Enhancer market accounts for the second-largest market share in the region's expanding food service industry. Supermarkets offer premium brands and frequently place orders for meat of the highest caliber. These factors pressured livestock farmers to deliver animals of the highest caliber and in good health to meet the high standards set by different players in the food industry. Further, the Germany Feed Palatability Enhancer market held the largest market share, and the UK Feed Palatability Enhancer market was the fastest-growing market in the European region.

    The North America Feed Palatability Enhancer Market is expected to grow at the fastest CAGR from 2022 to 2030. Customers are becoming more aware of the benefits of consuming high-quality meat products and the quality of the meat they consume. As a result, raising healthy, high-quality livestock has become crucial, increasing demand for better-tasting, higher-quality feed. As a result, it is anticipated that this region will see an increase in the demand for products containing feed flavors and sweeteners.

    Moreover, the US Feed Palatability Enhancer market held the largest market share, and the CANADA Feed Palatability Enhancer market was the fastest-growing market in the Asia-Pacific region.

    Key Players and Competitive Insights

    Major market players are spending much on R&D to increase their product lines, which will help the Feed Palatability Enhancer market grow even more. Market participants are also taking various strategic initiatives to grow their worldwide footprint, with key market developments such as new product launches, contractual agreements, mergers and acquisitions, increased investments, and collaboration with other organizations. Competitors in the Feed Palatability Enhancer industry must offer cost-effective items to expand and survive in an increasingly competitive and rising market environment.

    Manufacturing locally to reduce operating costs is one of the primary business strategies manufacturers adopt in the Global Feed Palatability Enhancer industry to benefit clients and expand the market sector. In recent years, the Feed Palatability Enhancer industry has provided medicine with some of the most significant benefits. The Feed Palatability Enhancer markets major players such as Eli Lilly and Company (US), Kerry Group (Ireland), and Associated British Foods Plc. (UK), Diana Foods (France), And others are working on expanding the market demand by investing in research and development activities.

    DuPont (US) Often abbreviated as DuPont, the French-American industrialist and chemist Éleuthère Irénée du Pont de Nemours founded the multinational chemical company in 1802. The business began as a significant supplier of gunpowder and later played a significant role in the growth of Delaware. In the 20th century, DuPont produced a variety of polymers, including Vespel, neoprene, nylon, Corian, Teflon, Mylar, Kapton, Kevlar, Zemdrain, M5 fiber, Nomex, Tyvek, Sorona, Corfam, and Lycra.

    Also, Diana Foods (France) Our products make it possible for producers of foods, drinks, and nutraceuticals to create consumer goods that make compelling product claims and satisfy the demands of today's changing consumer base. The Diana food portfolio of natural ingredients, provided by the Taste, Nutrition and Health segment, provides solutions to the food and beverage industry for consumer well-being, which has elevated to the top of consumers' priorities worldwide.

    Key Companies in the Feed Palatability Enhancers Market market include

    Industry Developments

    November 2020 A new starter and grower feed for rainbow trout called Nutra Sprint and Celero, respectively, will be introduced by Skretting, a Nutreco company, to help farms operate to their fullest potential. Growth increases of up to 8% were seen during validation trials for the product that had just been released, along with an 8% drop in the feed conversion ratio.

    November 2020 To create, assess, and enhance feeds for the land-based aquaculture sector, Cargill and The Conservation Fund's Freshwater Institute announced a multi-year agreement. Through the Institute, you can access nutritionists and researchers from Cargill with knowledge of recirculating aquaculture systems. The joint effort will create and test feeds specifically for recirculating aquaculture systems, enhancing land-based aquaculture's environmental and financial performance.

    August 2020 The Extrapal line of new, cutting-edge products was unveiled by Symrise AG and is made from exclusive protein hydrolysates. These palatability enhancers are distinguished by a very high level of hydrolysis, resulting in a high content of free amino acids and particular peptides combined with chosen ingredients, proven to improve the palatability performance of feeds created for carnivorous species.

    Future Outlook

    Feed Palatability Enhancers Market Future Outlook

    The Global Feed Palatability Enhancer Market is projected to grow at 3.62% CAGR from 2025 to 2035, driven by rising animal nutrition awareness and demand for high-quality feed.

    New opportunities lie in:

    • Develop innovative flavoring agents tailored for specific livestock species.
    • Leverage digital marketing strategies to enhance product visibility and consumer engagement.
    • Invest in R&D for natural and organic palatability enhancers to meet market trends.

    By 2035, the market is expected to exhibit robust growth, reflecting evolving consumer preferences and industry advancements.

    Market Segmentation

    Feed Palatability Enhancer Type Outlook

    • Feed Flavors & Sweeteners
    • Feed Texturants
    • Others

    Feed Palatability Enhancer Source Outlook

    • Natural
    • Synthetic

    Feed Palatability Enhancer Regional Outlook

    • US
    • Canada

    Feed Palatability Enhancer Livestock Outlook

    • Swine
    • Poultry
    • Ruminants
    • Aquaculture
    • Pet Food
    • Others

    Report Scope

    Attribute/Metric Details
    Market Size 2024 USD 7.87512 billion
    Market Size 2035 11.65 (Value (USD Billion))
    Compound Annual Growth Rate (CAGR) 3.62% (2025 - 2035)
    Base Year 2024
    Market Forecast Period 2025 - 2035
    Historical Data 2019 - 2021
    Market Forecast Units Value (USD Billion)
    Report Coverage Revenue Forecast, Market Competitive Landscape, Growth Factors, and Trends
    Segments Covered Type, Source, Livestock, and Region
    Geographies Covered North America, Europe, Asia Pacific, and the Rest of the World
    Countries Covered The U.S, Canada, Germany, France, the UK, Italy, Spain, China, Japan, India, Australia, South Korea, and Brazil
    Key Companies Profiled Eli Lilly and Company (US), Kerry Group (Ireland), Associated British Foods Plc. (UK), Diana Foods (France)
    Key Market Opportunities Because of their substantial impact on the growth of the animal feed
    Key Market Dynamics Increasing attention to animal health. Greater interest in convenience foods.
    Market Size 2025 8.16 (Value (USD Billion))

    Market Highlights

    Author

    Varsha More
    Research Analyst

    She holds an experience of about 6+ years in market research and business consulting, working under the spectrum of information communication technology, telecommunications and semiconductor domains. aarti conceptualizes and implements a scalable business strategy and provides strategic leadership to the clients. her expertise lies in market estimation, competitive intelligence, pipeline analysis, customer assessment, etc.

    Leave a Comment

    Latest Comments

    John Doe
    john@example.com

    This is a great article! Really helped me understand the topic better.

    Posted on July 23, 2025, 10:15 AM
    Jane Smith
    jane@domain.com

    Thanks for sharing this. I’ve bookmarked it for later reference.

    Posted on July 22, 2025, 7:45 PM

    FAQs

    How much is the Feed Palatability Enhancer market?

    The Feed Palatability Enhancer Market size was valued at USD 7.6 Billion in 2023.

    What is the growth rate of the Feed Palatability Enhancer market?

    The Global market is projected to grow at a CAGR of 3.62% during the forecast period, 2024-2032.

    Which region held the largest market share in the Feed Palatability Enhancer market?

    Asia Pacific had the largest share of the Global market

    Who are the key players in the Feed Palatability Enhancer market?

    The key players in the market are Eli Lilly and Company (US), Kerry Group (Ireland), and Associated British Foods Plc. (UK), Diana Foods (France).

    Which type led the Feed Palatability Enhancer market?

    The Feed Flavors & Sweeteners category dominated the market in 2022.

    Which Source had the largest market share in the Feed Palatability Enhancer market?

    The Natural segment had the largest share of the Global market.

    1. Executive Summary
    2. Scope of the Report
      1. 2.1
      2. Market Definition
      3. Scope of the Study
        1. Research Objectives
        2. Assumptions & Limitations
      4. Market Structure
    3. Market Research
      1. Methodology
      2. Research Process
      3. Secondary Research
      4. Primary
      5. Research
      6. Forecast Model
    4. Market Landscape
      1. Supply Chain Analysis
        1. Raw Material Suppliers
        2. Manufacturers/Producers
        3. Distributors/Retailers/Wholesalers/E-Commerce
        4. End Users
      2. Porter’s Five Forces Analysis
        1. Threat
        2. Bargaining Power of Buyers
        3. Bargaining Power
        4. Threat of Substitutes
        5. Internal Rivalry
      3. of New Entrants
      4. of Suppliers
      5. 5
      6. Market Dynamics of the Global Feed Palatability Enhancers Market
      7. Introduction
      8. Drivers
      9. Restraints
      10. Opportunities
      11. Challenges
    5. Global Feed Palatability Enhancers Market, by Type
      1. Introduction
      2. Feed Flavors & Sweeteners
        1. Market Estimates & Forecast,
        2. Market Estimates & Forecast, by Region, 2024-2032
        3. Market Estimates & Forecast, 2024-2032
      3. 6.3
      4. Feed Texturants
      5. 6.3.2
    6. Market Estimates & Forecast, by Region, 2024-2032
      1. Others
        1. Market Estimates & Forecast,
      2. 6.4.1
      3. Market Estimates & Forecast, 2024-2032
      4. by Region, 2024-2032
    7. Global Feed Palatability Enhancers Market, by Source
      1. Introduction
      2. Natural
        1. Market Estimates & Forecast,
        2. Market Estimates & Forecast, by Region, 2024-2032
        3. Market Estimates & Forecast, 2024-2032
        4. Market
      3. 7.3
      4. Synthetic
      5. Estimates & Forecast, by Region, 2024-2032
    8. Global Feed Palatability
    9. Enhancers Market, by Livestock
      1. Introduction
      2. Swine
        1. Market
        2. Market Estimates & Forecast,
      3. Estimates & Forecast, 2024-2032
      4. by Region, 2024-2032
      5. Poultry
        1. Market Estimates & Forecast,
        2. Market Estimates & Forecast, by Region, 2024-2032
        3. Market Estimates & Forecast, 2024-2032
        4. Market
      6. 8.4
      7. Ruminants
      8. Estimates & Forecast, by Region, 2024-2032
      9. Aquaculture
        1. Market
        2. Market Estimates & Forecast,
      10. Estimates & Forecast, 2024-2032
      11. by Region, 2024-2032
      12. Pet Food
        1. Market Estimates & Forecast,
        2. Market Estimates & Forecast, by Region, 2024-2032
        3. Market Estimates & Forecast, 2024-2032
        4. Market Estimates
      13. 8.7
      14. Others
      15. & Forecast, by Region, 2024-2032
    10. Global Feed Palatability Enhancers
    11. Market, by Region
      1. Introduction
      2. North America
        1. Market
        2. Market Estimates & Forecast,
        3. Market Estimates & Forecast, by Source, 2024-2032
        4. Market Estimates & Forecast, by Livestock, 2024-2032
        5. US
        6. Canada
        7. Mexico
      3. Estimates & Forecast, 2024-2032
      4. by Type, 2024-2032
      5. & Forecast, by Type, 2024-2032
      6. by Source, 2024-2032
      7. Estimates & Forecast, by Source, 2024-2032
      8. Forecast, by Livestock, 2024-2032
      9. & Forecast, 2024-2032
      10. Europe
        1. Market Estimates & Forecast, 2024-2032
        2. Market Estimates &
        3. Market Estimates & Forecast, by Source,
        4. Market Estimates & Forecast, by Livestock, 2024-2032
        5. Germany
      11. Forecast, by Type, 2024-2032
      12. 9.3.5.2
    12. Market Estimates & Forecast, by Type, 2024-2032
      1. & Forecast, by Source, 2024-2032
      2. by Livestock, 2024-2032
      3. 9.3.6.3
    13. Market Estimates
    14. Market Estimates & Forecast,
    15. France
    16. Market Estimates & Forecast,
    17. Market Estimates & Forecast, by Type, 2024-2032
    18. Market Estimates & Forecast, by Source, 2024-2032
      1. & Forecast, by Livestock, 2024-2032
      2. & Forecast, 2024-2032
      3. & Forecast, by Type, 2024-2032
      4. by Source, 2024-2032
      5. Estimates & Forecast, by Source, 2024-2032
      6. Forecast, by Livestock, 2024-2032
      7. Estimates & Forecast, 2024-2032
      8. by Type, 2024-2032
      9. Forecast, by Type, 2024-2032
      10. 9.4.5.2
    19. Market Estimates
    20. Italy
    21. Market Estimates
    22. Market Estimates & Forecast, by Type,
    23. Market Estimates & Forecast, by Source, 2024-2032
    24. Market Estimates & Forecast, by Livestock, 2024-2032
    25. Spain
    26. Market Estimates & Forecast, 2024-2032
    27. Market Estimates
    28. Market Estimates & Forecast,
    29. Market Estimates & Forecast, by Livestock,
    30. UK
    31. Market Estimates & Forecast, 2024-2032
    32. Market Estimates & Forecast, by Type, 2024-2032
    33. Market
    34. Market Estimates &
    35. Rest of Europe
    36. Market
    37. Market Estimates & Forecast,
    38. Market Estimates & Forecast, by Source, 2024-2032
    39. Market Estimates & Forecast, by Livestock, 2024-2032
      1. Asia-Pacific
        1. Market Estimates & Forecast, 2024-2032
        2. Market Estimates &
        3. Market Estimates & Forecast, by Source,
        4. Market Estimates & Forecast, by Livestock, 2024-2032
        5. China
    40. Market Estimates & Forecast, by Type, 2024-2032
      1. & Forecast, by Source, 2024-2032
      2. by Livestock, 2024-2032
      3. 9.4.6.3
    41. Market Estimates
    42. Market Estimates & Forecast,
    43. India
    44. Market Estimates & Forecast,
    45. Market Estimates & Forecast, by Type, 2024-2032
    46. Market Estimates & Forecast, by Source, 2024-2032
      1. & Forecast, by Livestock, 2024-2032
      2. & Forecast, 2024-2032
      3. & New Zealand
      4. 9.4.8.2
    47. Market Estimates
    48. Japan
    49. Market Estimates
    50. Market Estimates & Forecast, by Type,
    51. Market Estimates & Forecast, by Source, 2024-2032
    52. Market Estimates & Forecast, by Livestock, 2024-2032
    53. Australia
    54. Market Estimates & Forecast, 2024-2032
    55. Market Estimates & Forecast, by Type, 2024-2032
      1. & Forecast, by Source, 2024-2032
      2. by Livestock, 2024-2032
      3. & Forecast, 2024-2032
      4. of the World (RoW)
      5. 9.5.2
    56. Market Estimates
    57. Market Estimates & Forecast,
    58. Rest of Asia-Pacific
    59. Market Estimates
    60. Market Estimates & Forecast, by Type,
    61. Market Estimates & Forecast, by Source, 2024-2032
    62. Market Estimates & Forecast, by Livestock, 2024-2032
      1. Rest
        1. Market Estimates & Forecast, 2024-2032
    63. Market Estimates & Forecast, by Type, 2024-2032
      1. & Forecast, by Source, 2024-2032
      2. by Livestock, 2024-2032
      3. Forecast, 2024-2032
      4. Estimates & Forecast, by Livestock, 2024-2032
      5. & Forecast, by Type, 2024-2032
      6. by Source, 2024-2032
      7. Estimates & Forecast, by Source, 2024-2032
      8. Forecast, by Livestock, 2024-2032
    64. Market Estimates
    65. Market Estimates & Forecast,
    66. South America
    67. Market Estimates &
    68. Market Estimates & Forecast, by Type, 2024-2032
    69. Market Estimates & Forecast, by Source, 2024-2032
    70. Market
    71. The Middle East
    72. Market Estimates & Forecast, 2024-2032
    73. Market Estimates
    74. Market Estimates & Forecast,
    75. Market Estimates & Forecast, by Livestock,
    76. Africa
    77. Market Estimates & Forecast, 2024-2032
    78. Market Estimates & Forecast, by Type, 2024-2032
    79. Market
    80. Market Estimates &
    81. Company Landscape
      1. Introduction
      2. Market Strategy
      3. Key Development Analysis
      4. (Expansions/Mergers
      5. and Acquisitions/Joint Ventures/New Product Developments/Agreements/Investments)
    82. Company Profiles
      1. Eli Lilly and Company
        1. Company Overview
        2. Financial Updates
        3. Product/Business Segment Overview
        4. Key Developments
        5. SWOT Analysis
      2. 11.1.4
      3. Strategy
      4. Kerry
        1. Company Overview
        2. Financial Updates
        3. Product/Business
        4. Strategy
        5. Key Developments
        6. SWOT
      5. Group
      6. Segment Overview
      7. Analysis
      8. Associated British Foods Plc.
        1. Company Overview
        2. Financial Updates
        3. Product/Business Segment Overview
        4. Key Developments
        5. SWOT Analysis
      9. 11.3.4
      10. Strategy
      11. Diana
        1. Company Overview
        2. Financial Updates
        3. Product/Business
        4. Strategy
        5. Key Developments
        6. SWOT
      12. Foods
      13. Segment Overview
      14. Analysis
      15. Ensign-Bickford Industries Inc.
        1. Company Overview
        2. Financial Updates
        3. Product/Business Segment Overview
        4. Key Developments
        5. SWOT Analysis
      16. 11.5.4
      17. Strategy
      18. DuPont
        1. Company Overview
        2. Financial Updates
        3. Product/Business
        4. Strategy
        5. Key Developments
        6. SWOT
      19. Segment Overview
      20. Analysis
      21. Kent Feeds Inc.
        1. Company Overview
        2. Financial
        3. Product/Business Segment Overview
        4. Strategy
        5. SWOT Analysis
      22. Updates
      23. 11.7.5
      24. Key Developments
      25. Tanke International Group
        1. Company Overview
        2. Financial Updates
        3. Product/Business
        4. Strategy
        5. Key Developments
        6. SWOT
      26. Segment Overview
      27. Analysis
      28. Grupo Ferrer Internacional S.A.
        1. Company Overview
        2. Financial Updates
        3. Product/Business Segment Overview
        4. Key Developments
        5. SWOT Analysis
      29. 11.9.4
      30. Strategy
      31. Kemin
        1. Company Overview
        2. Financial Updates
        3. Product/Business Segment Overview
        4. Strategy
        5. Key
        6. SWOT Analysis
      32. Industries, Inc.
      33. Developments
      34. Symrise
        1. Company
        2. Financial Updates
        3. Product/Business Segment Overview
        4. Strategy
        5. Key Developments
        6. SWOT Analysis
        7. Company Overview
        8. Financial Updates
        9. Strategy
        10. Key Developments
        11. SWOT Analysis
      35. Overview
      36. 11.12
      37. Adisseo
      38. 11.12.3
      39. Product/Business Segment Overview
      40. Elanco
        1. Company Overview
        2. Product/Business Segment Overview
        3. Strategy
        4. Key Developments
        5. SWOT Analysis
      41. 11.13.2
      42. Financial Updates
      43. Solvay
        1. Financial Updates
        2. Product/Business Segment
        3. Strategy
        4. Key Developments
        5. SWOT Analysis
      44. 11.14.1
      45. Company Overview
      46. Overview
      47. Nutriad
        1. Company Overview
        2. Financial Updates
        3. Product/Business Segment Overview
        4. Strategy
        5. Key
        6. SWOT Analysis
      48. Developments
    83. Conclusion
      1. LIST
    84. OF TABLES
    85. Global Feed Palatability Enhancers Market, by Region, 2024-2032
      1. (USD Million)
    86. Global Feed Palatability Enhancers Market, by Type, 2024-2032
      1. (USD Million)
    87. Global Feed Palatability Enhancers Market, by Source,
    88. Global Feed Palatability Enhancers Market,
      1. by Livestock, 2024-2032 (USD Million)
    89. North America: Feed Palatability
    90. Enhancers Market, by Country, 2024-2032 (USD Million)
    91. North America:
    92. Feed Palatability Enhancers Market, by Type, 2024-2032 (USD Million)
      1. Table
    93. North America: Feed Palatability Enhancers Market, by Source, 2024-2032 (USD Million)
    94. North America: Feed Palatability Enhancers Market, by Livestock, 2024-2032
      1. (USD Million)
    95. US: Feed Palatability Enhancers Market, by Type, 2024-2032
      1. (USD Million)
    96. US: Feed Palatability Enhancers Market, by Source, 2024-2032
      1. (USD Million)
    97. US: Feed Palatability Enhancers Market, by Livestock,
    98. Canada: Feed Palatability Enhancers Market,
      1. by Type, 2024-2032 (USD Million)
    99. Canada: Feed Palatability Enhancers
    100. Market, by Source, 2024-2032 (USD Million)
    101. Canada: Feed Palatability
    102. Enhancers Market, by Livestock, 2024-2032 (USD Million)
    103. Mexico: Feed
    104. Palatability Enhancers Market, by Type, 2024-2032 (USD Million)
    105. Mexico:
    106. Feed Palatability Enhancers Market, by Source, 2024-2032 (USD Million)
      1. Table
    107. Mexico: Feed Palatability Enhancers Market, by Livestock, 2024-2032 (USD Million)
    108. Europe: Feed Palatability Enhancers Market, by Country, 2024-2032 (USD
      1. Million)
    109. Europe: Feed Palatability Enhancers Market, by Type, 2024-2032
      1. (USD Million)
    110. Europe: Feed Palatability Enhancers Market, by Source,
    111. Europe: Feed Palatability Enhancers Market,
      1. by Livestock, 2024-2032 (USD Million)
    112. Germany: Feed Palatability Enhancers
    113. Market, by Type, 2024-2032 (USD Million)
    114. Germany: Feed Palatability
    115. Enhancers Market, by Source, 2024-2032 (USD Million)
    116. Germany: Feed
    117. Palatability Enhancers Market, by Livestock, 2024-2032 (USD Million)
      1. Table
    118. France: Feed Palatability Enhancers Market, by Type, 2024-2032 (USD Million)
    119. France: Feed Palatability Enhancers Market, by Source, 2024-2032 (USD
      1. Million)
    120. France: Feed Palatability Enhancers Market, by Livestock,
    121. Italy: Feed Palatability Enhancers Market,
      1. by Type, 2024-2032 (USD Million)
    122. Italy: Feed Palatability Enhancers
    123. Market, by Source, 2024-2032 (USD Million)
    124. Italy: Feed Palatability
    125. Enhancers Market, by Livestock, 2024-2032 (USD Million)
    126. Spain: Feed
    127. Palatability Enhancers Market, by Type, 2024-2032 (USD Million)
    128. Spain:
    129. Feed Palatability Enhancers Market, by Source, 2024-2032 (USD Million)
      1. Table
    130. Spain: Feed Palatability Enhancers Market, by Livestock, 2024-2032 (USD Million)
    131. UK: Feed Palatability Enhancers Market, by Type, 2024-2032 (USD Million)
    132. UK: Feed Palatability Enhancers Market, by Source, 2024-2032 (USD Million)
    133. UK: Feed Palatability Enhancers Market, by Livestock, 2024-2032 (USD
      1. Million)
    134. Rest of Europe: Feed Palatability Enhancers Market, by Type,
    135. Rest of Europe: Feed Palatability Enhancers
    136. Market, by Source, 2024-2032 (USD Million)
    137. Rest of Europe: Feed Palatability
    138. Enhancers Market, by Livestock, 2024-2032 (USD Million)
    139. Asia-Pacific:
    140. Feed Palatability Enhancers Market, by Country, 2024-2032 (USD Million)
      1. Table
    141. Asia-Pacific: Feed Palatability Enhancers Market, by Type, 2024-2032 (USD Million)
    142. Asia-Pacific: Feed Palatability Enhancers Market, by Source, 2024-2032
      1. (USD Million)
    143. Asia-Pacific: Feed Palatability Enhancers Market, by
      1. Livestock, 2024-2032 (USD Million)
    144. China: Feed Palatability Enhancers
    145. Market, by Type, 2024-2032 (USD Million)
    146. China: Feed Palatability
    147. Enhancers Market, by Source, 2024-2032 (USD Million)
    148. China: Feed Palatability
    149. Enhancers Market, by Livestock, 2024-2032 (USD Million)
    150. India: Feed
    151. Palatability Enhancers Market, by Type, 2024-2032 (USD Million)
    152. India:
    153. Feed Palatability Enhancers Market, by Source, 2024-2032 (USD Million)
      1. Table
    154. India: Feed Palatability Enhancers Market, by Livestock, 2024-2032 (USD Million)
    155. Japan: Feed Palatability Enhancers Market, by Type, 2024-2032 (USD Million)
    156. Japan: Feed Palatability Enhancers Market, by Source, 2024-2032 (USD
      1. Million)
    157. Japan: Feed Palatability Enhancers Market, by Livestock,
    158. Rest of Asia-Pacific: Feed Palatability Enhancers
    159. Market, by Type, 2024-2032 (USD Million)
    160. Rest of Asia-Pacific: Feed
    161. Palatability Enhancers Market, by Source, 2024-2032 (USD Million)
      1. Table 55
    162. Rest of Asia-Pacific: Feed Palatability Enhancers Market, by Livestock, 2024-2032
      1. (USD Million)
    163. Rest of the World (RoW): Feed Palatability Enhancers
    164. Market, by Country, 2024-2032 (USD Million)
    165. Rest of the World (RoW):
    166. Feed Palatability Enhancers Market, by Type, 2024-2032 (USD Million)
      1. Table
    167. Rest of the World (RoW): Feed Palatability Enhancers Market, by Source, 2024-2032
      1. (USD Million)
    168. Rest of the World (RoW): Feed Palatability Enhancers
    169. Market, by Livestock, 2024-2032 (USD Million)
    170. South America: Feed
    171. Palatability Enhancers Market, by Type, 2024-2032 (USD Million)
    172. South
    173. America: Feed Palatability Enhancers Market, by Source, 2024-2032 (USD Million)
    174. South America: Feed Palatability Enhancers Market, by Livestock, 2024-2032
      1. (USD Million)
    175. Middle East: Feed Palatability Enhancers Market, by
      1. Type, 2024-2032 (USD Million)
    176. Middle East: Feed Palatability Enhancers
    177. Market, by Source, 2024-2032 (USD Million)
    178. Middle East: Feed Palatability
    179. Enhancers Market, by Livestock, 2024-2032 (USD Million)
    180. Africa: Feed
    181. Palatability Enhancers Market, by Type, 2024-2032 (USD Million)
    182. Africa:
    183. Feed Palatability Enhancers Market, by Source, 2024-2032 (USD Million)
      1. Table
    184. Africa: Feed Palatability Enhancers Market, by Livestock, 2024-2032 (USD Million)
    185. LIST OF FIGURES
    186. Global Feed Palatability Enhancers Market
      1. Segmentation
    187. Forecast Research Methodology
    188. Five Forces
      1. Analysis of Global Feed Palatability Enhancers Market
    189. Value Chain
      1. of Global Feed Palatability Enhancers Market
    190. Share of Global Feed
    191. Palatability Enhancers Market in 2023, by Country (%)
    192. Global Feed
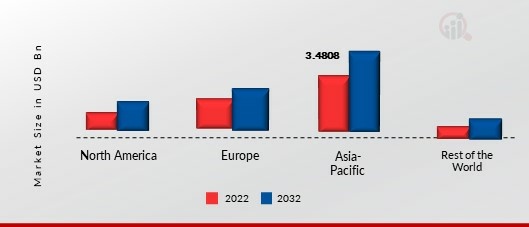
    193. Palatability Enhancers Market, by Region, 2024-2032,
    194. Global Feed Palatability
    195. Enhancers Market Size, by Type, 2023
    196. Share of Global Feed Palatability
    197. Enhancers Market, by Type, 2024-2032 (%)
    198. Global Feed Palatability
    199. Enhancers Market Size, by Livestock, 2023
    200. Share of Global Feed Palatability
    201. Enhancers Market, by Livestock, 2024-2032 (%)
    202. Global Feed Palatability
    203. Enhancers Market Size, by Source, 2023
    204. Share of Global Feed Palatability
    205. Enhancers Market, by Source, 2024-2032 (%)

    Feed Palatability Enhancers Market Segmentation

    Feed Palatability Enhancers Type Outlook (USD Billion, 2019-2030)

    • Feed Flavors & Sweeteners
    • Feed Texturants
    • Others

    Feed Palatability Enhancers Source Outlook (USD Billion, 2019-2030)

    • Natural
    • Synthetic

    Feed Palatability Enhancers Livestock Outlook (USD Billion, 2019-2030)

    • Swine
    • Poultry
    • Ruminants
    • Aquaculture
    • Pet Food
    • Others

    Feed Palatability Enhancers Regional Outlook (USD Billion, 2019-2030)

    • North America Outlook (USD Billion, 2019-2030)

      • North America Feed Palatability Enhancers by Type
        • Feed Flavors & Sweeteners
        • Feed Texturants
        • Others
      • North America Feed Palatability Enhancers by Source
        • Natural
        • Synthetic
      • North America Feed Palatability Enhancers by Livestock
        • Swine
        • Poultry
        • Ruminants
        • Aquaculture
        • Pet Food
        • Others
      • US Outlook (USD Billion, 2019-2030)

      • US Feed Palatability Enhancers by Type
        • Feed Flavors & Sweeteners
        • Feed Texturants
        • Others
      • US Feed Palatability Enhancers by Source
        • Natural
        • Synthetic
      • US Feed Palatability Enhancers by Livestock
        • Swine
        • Poultry
        • Ruminants
        • Aquaculture
        • Pet Food
        • Others
      • CANADA Outlook (USD Billion, 2019-2030)

      • CANADA Feed Palatability Enhancers by Type
        • Feed Flavors & Sweeteners
        • Feed Texturants
        • Others
      • CANADA Feed Palatability Enhancers by Source
        • Natural
        • Synthetic
      • CANADA Feed Palatability Enhancers by Livestock
        • Swine
        • Poultry
        • Ruminants
        • Aquaculture
        • Pet Food
        • Others
    • Europe Outlook (USD Billion, 2019-2030)

      • Europe Feed Palatability Enhancers by Type
        • Feed Flavors & Sweeteners
        • Feed Texturants
        • Others
      • Europe Feed Palatability Enhancers by Source
        • Natural
        • Synthetic
      • Europe Feed Palatability Enhancers by Livestock
        • Swine
        • Poultry
        • Ruminants
        • Aquaculture
        • Pet Food
        • Others
      • Germany Outlook (USD Billion, 2019-2030)

      • Germany Feed Palatability Enhancers by Type
        • Feed Flavors & Sweeteners
        • Feed Texturants
        • Others
      • Germany Feed Palatability Enhancers by Source
        • Natural
        • Synthetic
      • Germany Feed Palatability Enhancers by Livestock
        • Swine
        • Poultry
        • Ruminants
        • Aquaculture
        • Pet Food
        • Others
      • France Outlook (USD Billion, 2019-2030)

      • France Feed Palatability Enhancers by Type
        • Feed Flavors & Sweeteners
        • Feed Texturants
        • Others
      • France Feed Palatability Enhancers by Source
        • Natural
        • Synthetic
      • France Feed Palatability Enhancers by Livestock
        • Swine
        • Poultry
        • Ruminants
        • Aquaculture
        • Pet Food
        • Others
      • UK Outlook (USD Billion, 2019-2030)

      • UK Feed Palatability Enhancers by Type
        • Feed Flavors & Sweeteners
        • Feed Texturants
        • Others
      • UK Feed Palatability Enhancers by Source
        • Natural
        • Synthetic
      • UK Feed Palatability Enhancers by Livestock
        • Swine
        • Poultry
        • Ruminants
        • Aquaculture
        • Pet Food
        • Others
      • ITALY Outlook (USD Billion, 2019-2030)

      • ITALY Feed Palatability Enhancers by Type
        • Feed Flavors & Sweeteners
        • Feed Texturants
        • Others
      • ITALY Feed Palatability Enhancers by Source
        • Natural
        • Synthetic
      • ITALY Feed Palatability Enhancers by Livestock
        • Swine
        • Poultry
        • Ruminants
        • Aquaculture
        • Pet Food
        • Others
      • SPAIN Outlook (USD Billion, 2019-2030)

      • Spain Feed Palatability Enhancers by Type
        • Feed Flavors & Sweeteners
        • Feed Texturants
        • Others
      • Spain Feed Palatability Enhancers by Source
        • Natural
        • Synthetic
      • Spain Feed Palatability Enhancers by Livestock
        • Swine
        • Poultry
        • Ruminants
        • Aquaculture
        • Pet Food
        • Others
      • Rest of Europe Outlook (USD Billion, 2019-2030)

      • Rest of Europe Feed Palatability Enhancers by Type
        • Feed Flavors & Sweeteners
        • Feed Texturants
        • Others
      • REST OF Europe Feed Palatability Enhancers by Source
        • Natural
        • Synthetic
      • REST OF Europe Feed Palatability Enhancers by Livestock
        • Swine
        • Poultry
        • Ruminants
        • Aquaculture
        • Pet Food
        • Others
    • Asia-Pacific Outlook (USD Billion, 2019-2030)

      • Asia-Pacific Feed Palatability Enhancers by Type
        • Feed Flavors & Sweeteners
        • Feed Texturants
        • Others
      • Asia-Pacific Feed Palatability Enhancers by Source
        • Natural
        • Synthetic
      • Asia-Pacific Feed Palatability Enhancers by Livestock
        • Swine
        • Poultry
        • Ruminants
        • Aquaculture
        • Pet Food
        • Others
      • China Outlook (USD Billion, 2019-2030)

      • China Feed Palatability Enhancers by Type
        • Feed Flavors & Sweeteners
        • Feed Texturants
        • Others
      • China Feed Palatability Enhancers by Source
        • Natural
        • Synthetic
      • China Feed Palatability Enhancers by Livestock
        • Swine
        • Poultry
        • Ruminants
        • Aquaculture
        • Pet Food
        • Others
      • Japan Outlook (USD Billion, 2019-2030)

      • Japan Feed Palatability Enhancers by Type
        • Feed Flavors & Sweeteners
        • Feed Texturants
        • Others
      • Japan Feed Palatability Enhancers by Source
        • Natural
        • Synthetic
      • Japan Feed Palatability Enhancers by Livestock
        • Swine
        • Poultry
        • Ruminants
        • Aquaculture
        • Pet Food
        • Others
      • India Outlook (USD Billion, 2019-2030)

      • India Feed Palatability Enhancers by Type
        • Feed Flavors & Sweeteners
        • Feed Texturants
        • Others
      • India Feed Palatability Enhancers by Source
        • Natural
        • Synthetic
      • India Feed Palatability Enhancers by Livestock
        • Swine
        • Poultry
        • Ruminants
        • Aquaculture
        • Pet Food
        • Others
      • Australia Outlook (USD Billion, 2019-2030)

      • Australia Feed Palatability Enhancers by Type
        • Feed Flavors & Sweeteners
        • Feed Texturants
        • Others
      • Australia Feed Palatability Enhancers by Source
        • Natural
        • Synthetic
      • Australia Feed Palatability Enhancers by Livestock
        • Swine
        • Poultry
        • Ruminants
        • Aquaculture
        • Pet Food
        • Others
      • Rest of Asia-Pacific Outlook (USD Billion, 2019-2030)

      • Rest of Asia-Pacific Feed Palatability Enhancers by Type
        • Feed Flavors & Sweeteners
        • Feed Texturants
        • Others
      • Rest of Asia-Pacific Feed Palatability Enhancers by Source
        • Natural
        • Synthetic
      • Rest of Asia-Pacific Feed Palatability Enhancers by Livestock
        • Swine
        • Poultry
        • Ruminants
        • Aquaculture
        • Pet Food
        • Others
    • Rest of the World Outlook (USD Billion, 2019-2030)

      • Rest of the World Feed Palatability Enhancers by Type
        • Feed Flavors & Sweeteners
        • Feed Texturants
        • Others
      • Rest of the World Feed Palatability Enhancers by Source
        • Natural
        • Synthetic
      • Rest of the World Feed Palatability Enhancers by Livestock
        • Swine
        • Poultry
        • Ruminants
        • Aquaculture
        • Pet Food
        • Others
      • Middle East Outlook (USD Billion, 2019-2030)

      • Middle East Feed Palatability Enhancers by Type
        • Feed Flavors & Sweeteners
        • Feed Texturants
        • Others
      • Middle East Feed Palatability Enhancers by Source
        • Natural
        • Synthetic
      • Middle East Feed Palatability Enhancers by Livestock
        • Swine
        • Poultry
        • Ruminants
        • Aquaculture
        • Pet Food
        • Others
      • Africa Outlook (USD Billion, 2019-2030)

      • Africa Feed Palatability Enhancers by Type
        • Feed Flavors & Sweeteners
        • Feed Texturants
        • Others
      • Africa Feed Palatability Enhancers by Source
        • Natural
        • Synthetic
      • Africa Feed Palatability Enhancers by Livestock
        • Swine
        • Poultry
        • Ruminants Aquaculture
        • Pet Food
        • Others
      • Latin America Outlook (USD Billion, 2019-2030)

      • Latin America Feed Palatability Enhancers by Type
        • Feed Flavors & Sweeteners
        • Feed Texturants
        • Others
      • Latin America Feed Palatability Enhancers by Source
        • Natural
        • Synthetic
      • Latin America Feed Palatability Enhancers by Livestock
        • Swine
        • Poultry
        • Ruminants
        • Aquaculture
        • Pet Food
        • Others
    Infographic

    Free Sample Request

    Kindly complete the form below to receive a free sample of this Report

    Get Free Sample

    Customer Strories

    “I am very pleased with how market segments have been defined in a relevant way for my purposes (such as "Portable Freezers & refrigerators" and "last-mile"). In general the report is well structured. Thanks very much for your efforts.”

    Victoria Milne

    Founder
    Case Study
    Chemicals and Materials