• Cat-intel
  • MedIntelliX
  • Resources
  • About Us
  • Hero Background
    English
    Chinese
    French
    Japanese
    Korean
    German
    Spanish

    Hearing Aids Market Trends

    ID: MRFR/HC/6892-CR
    131 Pages
    Rahul Gotadki
    July 2025

    Hearing Aids Market Research Report Information by Product (Hearing Aid Devices (Receiver-In-The-Ear (RITE) Hearing Aids, Behind-The-Ear (BTE) Hearing Aids, Canal Hearing Aids, In-The-Ear (ITE) Hearing Aids, Other), Hearing Implants (Cochlear Implants and Bone-Anchored Systems), by Type of Hearing Loss (Sensorineural Hearing Loss and Conductive Hearing Loss), by Patient Type (Adults and Pediatr...

    Share:
    Download PDF ×

    We do not share your information with anyone. However, we may send you emails based on your report interest from time to time. You may contact us at any time to opt-out.

    Hearing Aids Market Infographic
    $ 4,950.0
    $ 5,950.0
    $ 7,250.0

    Market Trends

    Key Emerging Trends in the Hearing Aids Market

    The hearing aids market is witnessing transformative trends which are revamping the outlook of this critical healthcare industry. The key market driving factor is the adoption of advanced technology in hearing aid devices. The digital trend has enabled intelligent hearing aids with Bluetooth connectivity, AI algorithms as well personalized settings. These innovations improve, not only the general user interface but also meet with rising demand of a smooth integration between other smart devices. Another prominent trend is the focus on design aesthetics and form factor. Initially, hearing aids were large and easily seen by others causing people to not want it. Alternatively, the current direction is towards a minimalist look that balances both function and form. Today, it is difficult to deny that hearing aids no longer have the status they used to; consumer needs are reflected in manufacturers’ effort of providing much larger variety options. The demand is also soaring in the market due to aging population worldwide. As human beings continue to grow old, hearing loss is also on the increase which only makes it more important for a proper solution in this regard. As a result of this demographic shift, one of the most important drivers is encouraging manufacturers to concentrate on creating easy-to-use cost and accessible hearing aid solutions for the increasing need. In addition, telehealth and virtual healthcare services are crucial elements of the hearing aids market. The pandemic of COVID-19 advanced the use in remote health solutions including online consultation and diagnostic services. This trend has also been embraced by the hearing aid industry where one can consult a professional for advice and adjustments without physically going to their office. Telehealth services have not only improved patient care but also created new opportunities for market growth through the convenience and accessibility that they provide. Environmental sustainability has become one of the leading issues in hearing aids market. Factoring in the increasing consciousness of environmental concern regarding electronic devices, many manufacturers are shifting to eco-friendly materials, energy efficient designs and recyclability. This sustainability trend fits well with wider global initiatives to embrace green practices as a general change in consumer ideas.

    Market Summary

    As per Market Research Future Analysis, the Hearing Aids Market was valued at 13.16 USD Billion in 2024 and is projected to grow to 32.45 USD Billion by 2035. The market is driven by an aging global population, technological advancements, and increasing awareness of hearing health. The demand for hearing aids is expected to rise significantly due to the growing incidence of hearing loss, particularly among the elderly and in developing nations.

    Key Market Trends & Highlights

    The global hearing aids market is witnessing substantial growth driven by several key trends.

    • The market is expected to grow from 9.13 USD Billion in 2024 to 14.5 USD Billion by 2035, with a CAGR of 4.29% from 2025 to 2035. Digital Hearing Aids are projected to increase from 4.25 USD Billion in 2024 to 6.72 USD Billion by 2035. The aging population is expected to double from 1 billion in 2020 to 2.1 billion by 2050, correlating with a rise in age-related hearing loss. Approximately 1.1 billion young people are at risk of hearing loss due to unsafe listening practices.

    Market Size & Forecast

    2024 Market Size USD 13.16 Billion
    2035 Market Size USD 32.45 Billion
    CAGR (2025-2035) 8.55%
    Largest Regional Market Share in 2024 North America

    Major Players

    <p>Starkey Hearing Technologies, Signia, Oticon, Demant, GN Store Nord, Unitron, Eargo, Cochlear, WS Audiology, Rexton, Amplifon, Sonova, Audina Hearing Instruments, Beltone, Hearing Life</p>

    Market Trends

    <p>The ongoing advancements in digital technology and increasing awareness of hearing health are driving a notable transformation in the global hearing aids market, enhancing accessibility and user experience.</p>

    U.S. Department of Health and Human Services

    Hearing Aids Market Market Drivers

    Aging Population

    The Global Hearing Aids Market Industry is significantly influenced by the aging population, as individuals aged 65 and older are more prone to hearing loss. By 2024, the market is projected to reach 12.9 USD Billion, largely driven by the increasing number of elderly individuals requiring hearing assistance. As life expectancy rises globally, the demand for hearing aids is expected to escalate, with estimates suggesting that by 2035, the market could expand to 32.6 USD Billion. This demographic shift underscores the necessity for innovative hearing solutions tailored to the needs of older adults.

    Market Segment Insights

    <p>Hearing Aids</p>

    <p>Based on Product, this segment includes Hearing Aid Devices (Receiver-In-The-Ear (RITE) Hearing Aids, Behind-The-Ear (BTE) Hearing Aids, Canal Hearing Aids, In-The-Ear (ITE) Hearing Aids, Other), Hearing Implants (Cochlear Implants and Bone-Anchored Systems. The Hearing Aid Devices segment dominated the global market in 2024, while the Hearing Implants segment is projected to be the fastest–growing segment during the forecast period.&nbsp;</p>

    <p>Hearing aid devices are electronic instruments worn in or around the ear to amplify sound and help individuals with hearing impairments. These devices are designed to enhance the ability to hear sounds that might otherwise be inaudible. Typically, hearing aid devices consist of three major components: a microphone, an amplifier, and a receiver. The microphone captures sound from the environment, the amplifier increases the volume of the sound, and the receiver sends the amplified sound into the ear.</p>

    <p>Hearing Aids</p>

    <p>Based on Type of Hearing Loss, this segment includes Sensorineural Hearing Loss and Conductive Hearing Loss. The Sensorineural Hearing Loss segment dominated the global market in 2024, while it is projected to be the fastest–growing segment during the forecast period.&nbsp;</p>

    <p>Sensorineural hearing loss (SNHL) is the most common type of permanent hearing loss, accounting for the majority of cases globally. It arises from damage to the inner ear (cochlea) or the auditory nerve, which transmits sound signals to the brain. The damage can result from various factors, including aging (presbycusis), noise exposure, genetics, illnesses, and ototoxic medications. This type of hearing loss cannot be reversed, and the extent of hearing impairment depends on the severity and location of the damage.</p>

    <p>Hearing Aids</p>

    <p>Based on Patient Type, this segment includes Adults and Pediatrics. The Adults segment dominated the global market in 2024, while the Pediatrics segment is projected to be the fastest–growing segment during the forecast period. Adults in the context of the hearing aids market refer to individuals aged 18 and older who experience various types of hearing loss.&nbsp;</p>

    <p>The types of hearing loss most commonly encountered in adults are sensorineural hearing loss (SNHL), conductive hearing loss (CHL), and mixed hearing loss. The primary causes of hearing loss in adults are aging (presbycusis), long-term noise exposure, genetic factors, and medical conditions such as diabetes or hypertension.</p>

    <p>Hearing Aids</p>

    <p>Based on Technology, this segment includes Analog and Digital. The Digital segment dominated the global market in 2024, while it is projected to be the fastest–growing segment during the forecast period.&nbsp;</p>

    <p><a href="https://www.marketresearchfuture.com/reports/digital-healthcare-market-7636">Digital</a> hearing aids use advanced signal processing technology to convert sound waves into digital signals, allowing for precise sound customization and enhancement. They can automatically adjust to different environments and reduce unwanted background noise while improving speech clarity.</p>

    <p>Hearing Aids</p>

    <p>Based on End-User, this segment includes Private Pay/Out of Pocket, Third Party Payer, Medicare/Medicaid. The Private Pay/Out of Pocket segment dominated the global market in 2024, while the Third-Party Payer segment is projected to be the fastest–growing segment during the forecast period. Private Pay, also known as Out of Pocket, refers to individuals who purchase hearing aids using their own financial resources without relying on insurance or government assistance.&nbsp;</p>

    <p>This segment is significant, particularly in regions where hearing aids are not fully covered by insurance or public healthcare systems. In countries like the United States, where the cost of hearing aids can be expensive, a substantial portion of the market is driven by consumers who pay out of pocket. This segment is often characterized by a higher willingness to invest in premium, feature-rich devices, as these consumers are typically more focused on quality, comfort, and advanced functionalities such as Bluetooth connectivity, noise cancellation, and rechargeable batteries.</p>

    Get more detailed insights about Hearing Aids Market Research Report – Forecast Till 2035

    Regional Insights

    Based on the Region, the global Hearing Aids are segmented into North America, Europe, Asia-Pacific, South America and Middle East & Africa. The North America dominated the global market in 2024, while the Asia-Pacific is projected to be the fastest–growing segment during the forecast period. 

    Major demand factors driving the North America market are the increasing incidences of hearing loss and growth of elderly/geriatric population. The increasing sales volume of hearing devices, coupled with the strong adoption of less noticeable devices for more aesthetic appeal and new product launches, are some of the primary factors attributable to this region's prominent position in the market, Hence, North America is anticipated to register the highest growth rate over the forecast period.

    FIGURE 3: HEARING AIDS MARKET VALUE BY REGION 2024 AND 2035 (USD BILLION)

    HEARING AIDS MARKET VALUE BY REGION 2024 AND 2035

    Source: Secondary Research, Primary Research, MRFR Database, and Analyst Review

    Further, the countries considered in the scope of the Application Tracking System Market are the U.S., Canada, Mexico, Germany, U.K., France, Italy, Spain, Japan, China, India, Australia, Brazil, Colombia, South Africa, GCC Countries and others.

    Key Players and Competitive Insights

    Many global, regional, and local vendors characterize the Hearing Aids Market. The market is highly competitive, with all the players competing to gain market share. Intense competition, rapid advances in technology, frequent changes in government policies, and environmental regulations are key factors that confront market growth. The vendors compete based on cost, product quality, reliability, and government regulations. Vendors must provide cost-efficient, high-quality products to survive and succeed in an intensely competitive market.

    The major competitors in the market are Cochlear Limited, GN Hearing A/S, Sonova, William Demant Holding A/S, Starkey, Petrofac, Halliburton, Zounds Hearing, Audina Hearing Instruments, Audina are among others. The Hearing Aids Market is a consolidated market due to increasing competition, acquisitions, mergers and other strategic market developments and decisions to improve operational effectiveness.

    Key Companies in the Hearing Aids Market market include

    Industry Developments

    Future Outlook

    Hearing Aids Market Future Outlook

    <p>The Global Hearing Aids Market is projected to grow at an 8.55% CAGR from 2025 to 2035, driven by technological advancements, increasing awareness, and an aging population.</p>

    New opportunities lie in:

    • <p>Develop AI-driven hearing aids for personalized user experiences. Expand telehealth services for remote fitting and support. Invest in sustainable materials for eco-friendly hearing aid production.</p>

    <p>By 2035, the market is expected to be robust, reflecting significant advancements and increased accessibility.</p>

    Market Segmentation

    Regional Outlook

    • {""=>["U.S."
    • "Canada"
    • "Mexico"]}
    • {""=>["Germany"
    • "U.K."
    • "France"
    • "Italy"
    • "Spain"
    • "Rest Of Europe"]}
    • {""=>["Japan"
    • "China"
    • "India"
    • "Australia"
    • "Rest Of Asia Pacific"]}
    • {""=>["Brazil"
    • "Colombia"
    • "Rest of South America"]}
    • {""=>["South Africa"
    • "GCC Countries"
    • "Rest of Middle East and Africa"]}

    Hearing Aids Regional Outlook

    • {""=>["U.S."
    • "Canada"
    • "Mexico"]}
    • {""=>["Germany"
    • "U.K."
    • "France"
    • "Italy"
    • "Spain"
    • "Rest Of Europe"]}
    • {""=>["Japan"
    • "China"
    • "India"
    • "Australia"
    • "Rest Of Asia Pacific"]}
    • {""=>["Brazil"
    • "Colombia"
    • "Rest of South America"]}
    • {""=>["South Africa"
    • "GCC Countries"
    • "Rest of Middle East and Africa"]}

    Hearing Aids by Product Outlook

    • {""=>["Receiver-In-The-Ear (RITE) Hearing Aids"
    • "Behind-The-Ear (BTE) Hearing Aids"
    • "Canal Hearing Aids"
    • "In-The-Ear (ITE) Hearing Aids"
    • "Other"]}
    • {""=>["Cochlear Implants"
    • "Bone-Anchored Systems"]}

    Hearing Aids by End-User Outlook

    • Private Pay/Out of Pocket
    • Third Party Payer
    • Medicare/Medicaid

    Hearing Aids by Technology Outlook

    • Analog
    • Digital

    Hearing Aids by Patient Type Outlook

    • Adults
    • Pediatrics

    Hearing Aids by Type of Hearing Loss Outlook

    • Sensorineural Hearing Loss
    • Conductive Hearing Loss

    Report Scope

    Report Attribute/MetricDetails
    Market Size 2024USD 12.90 Billion
    Market Size 2025USD 13.88 Billion
    Market Size 203532.45
    Compound Annual Growth Rate (CAGR)8.55% (2025 - 2035)
    Base Year2024
    Forecast Period2025 - 2035
    Historical Data2019-2023
    Forecast UnitsValue (USD Billion)
    Report CoverageRevenue Forecast, Competitive Landscape, Growth Factors, and Trends
    Segments CoveredBy Product, By Type of Hearing Loss, By Patient Type, By Technology, By End-User
    Geographies CoveredNorth America, Europe, Asia Pacific, South America, Middle East & Africa
    Countries CoveredThe U.S., Canada, Mexico, Germany, U.K., France, Italy, Spain, Japan, China, India, Australia, Brazil, Colombia, South Africa, GCC Countries
    Key Companies ProfiledCochlear Limited, GN Hearing A/S, Sonova, William Demant Holding A/S, Starkey, Petrofac, Halliburton, Zounds Hearing, Audina Hearing Instruments, Audina
    Key Market Opportunities

    ·         Rise in Disposable Income and Affordability

    ·         Technological Advancements

    Key Market Dynamics

    ·         Increasing Incidences of Hearing Loss

    ·         Growth of Elderly/Geriatric Population

    Market Highlights

    Author

    Rahul Gotadki
    Assistant Manager

    She holds an experience of about 6+ years in market research and business consulting, working under the spectrum of information communication technology, telecommunications and semiconductor domains. aarti conceptualizes and implements a scalable business strategy and provides strategic leadership to the clients. her expertise lies in market estimation, competitive intelligence, pipeline analysis, customer assessment, etc.

    Leave a Comment

    Latest Comments

    John Doe
    john@example.com

    This is a great article! Really helped me understand the topic better.

    Posted on July 23, 2025, 10:15 AM
    Jane Smith
    jane@domain.com

    Thanks for sharing this. I’ve bookmarked it for later reference.

    Posted on July 22, 2025, 7:45 PM

    FAQs

    How much is the Hearing Aids Market?

    USD 12.90 Billion is the Hearing Aids Market in 2024

    Which Product holds the largest market share?

    The Hearing Aid Devices segment by Material holds the largest market share and grows at a CAGR of 8.34 % during the forecast period.

    Which region holds the largest market share in the Hearing Aids Market?

    North America holds the largest market share in the Hearing Aids Market.

    Who are the prominent players in the Hearing Aids Market?

    Cochlear Limited, GN Hearing A/S, Sonova, William Demant Holding A/S, Starkey, Petrofac, Halliburton, Zounds Hearing, Audina Hearing Instruments, Audina are prominent players in the Hearing Aids Market.

    Which Patient Type segment led the Hearing Aids Market?

    The Adults segment dominated the market in 2024.

    1. --- "Table of Contents
    2. Executive Summary
    3. Market Introduction
      1. DEFINITION
      2. Scope of the Study
      3. RESEARCH OBJECTIVE
    4. Research Methodology
      1. OVERVIEW
      2. DATA FLOW
        1. DATA MINING PROCESS
      3. PURCHASED DATABASE:
      4. SECONDARY SOURCES:
        1. SECONDARY RESEARCH DATA FLOW:
      5. PRIMARY RESEARCH:
        1. PRIMARY RESEARCH DATA FLOW:
        2. PRIMARY RESEARCH: NUMBER OF INTERVIEWS CONDUCTED
        3. PRIMARY RESEARCH: REGIONAL COVERAGE
      6. APPROACHES FOR MARKET SIZE ESTIMATION:
        1. REVENUE ANALYSIS APPROACH
      7. DATA FORECASTING
        1. DATA FORECASTING TYPE
      8. DATA MODELING
        1. MICROECONOMIC FACTOR ANALYSIS:
        2. DATA MODELING:
      9. TEAMS AND ANALYST CONTRIBUTION
    5. MARKET DYNAMICS
      1. INTRODUCTION
      2. DRIVERS
        1. INCREASING INCIDENCES OF HEARING LOSS
        2. GROWTH OF ELDERLY/GERIATRIC POPULATION
      3. RESTRAINTS
        1. HIGH COST AND AFFORDABILITY ISSUES
        2. STIGMA AND SOCIAL ACCEPTANCE
      4. OPPORTUNITY
        1. RISE IN DISPOSABLE INCOME AND AFFORDABILITY
        2. TECHNOLOGICAL ADVANCEMENTS
    6. MARKET FACTOR ANALYSIS
      1. PORTER’S FIVE FORCES MODEL
        1. PORTER’S FIVE FORCES MODEL
      2. IMPACT OF COVID-19 ON HEARING AIDS MARKET
      3. OTC HEARING AID MARKET TRENDS
      4. PAYMENT MODE ANALYSIS BY REGION
    7. GLOBAL HEARING AIDS MARKET, BY PRODUCT
      1. INTRODUCTION
        1. HEARING AID DEVICES
        2. HEARING IMPLANTS
    8. GLOBAL HEARING AIDS MARKET, BY TYPE OF HEARING LOSS
      1. INTRODUCTION
        1. SENSORINEURAL HEARING LOSS
        2. CONDUCTIVE HEARING LOSS
    9. GLOBAL HEARING AIDS MARKET, BY PATIENT TYPE
      1. INTRODUCTION
        1. ADULTS
        2. PEDIATRICS
    10. GLOBAL HEARING AIDS MARKET, BY TECHNOLOGY
      1. INTRODUCTION
        1. DIGITAL
        2. ANALOG
    11. GLOBAL HEARING AIDS MARKET, BY END USER
      1. INTRODUCTION
        1. PRIVATE PAY/OUT OF POCKET
        2. THIRD PARTY PAYER
        3. MEDICARE/MEDICAID
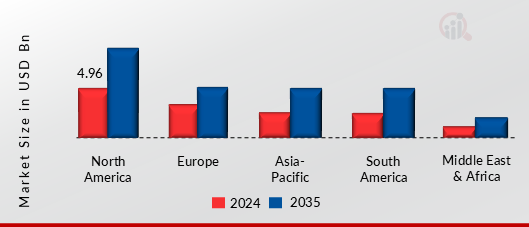
    12. GLOBAL HEARING AIDS MARKET, BY REGION
      1. INTRODUCTION
        1. NORTH AMERICA
        2. EUROPE
        3. ASIA-PACIFIC
        4. SOUTH AMERICA
        5. MIDDLE EAST & AFRICA
    13. Competitive Landscape
      1. INTRODUCTION
      2. MARKET SHARE ANALYSIS, 2023
    14. COMPANY PROFILES
      1. COCHLEAR LIMITED
        1. COMPANY OVERVIEW
        2. PRODUCTS OFFERED
        3. SWOT ANALYSIS
        4. KEY STRATEGY
      2. GN HEARING A/S
        1. COMPANY OVERVIEW
        2. PRODUCTS OFFERED
        3. SWOT ANALYSIS
        4. KEY STRATEGY
      3. SONOVA
        1. COMPANY OVERVIEW
        2. PRODUCTS OFFERED
        3. SWOT ANALYSIS
        4. KEY STRATEGY
      4. WILLIAM DEMANT HOLDING A/S
        1. COMPANY OVERVIEW
        2. PRODUCTS OFFERED
        3. SWOT ANALYSIS
        4. KEY STRATEGY
      5. STARKEY
        1. COMPANY OVERVIEW
        2. PRODUCTS OFFERED
        3. SWOT ANALYSIS
        4. KEY STRATEGY
      6. PETROFAC
        1. COMPANY OVERVIEW
        2. PRODUCTS OFFERED
        3. SWOT ANALYSIS
        4. KEY STRATEGY
      7. HALLIBURTON
        1. COMPANY OVERVIEW
        2. PRODUCTS OFFERED
        3. SWOT ANALYSIS
        4. KEY STRATEGY
      8. ZOUNDS HEARING
        1. COMPANY OVERVIEW
        2. PRODUCTS OFFERED
        3. SWOT ANALYSIS
        4. KEY STRATEGY
      9. AUDINA HEARING INSTRUMENTS
        1. COMPANY OVERVIEW
        2. PRODUCTS OFFERED
        3. SWOT ANALYSIS
        4. KEY STRATEGY
      10. AMPLIFON
        1. COMPANY OVERVIEW
        2. PRODUCTS OFFERED
        3. SWOT ANALYSIS
        4. KEY STRATEGY
    15. List of Tables and Figures
      1. 14 DATA CITATIONS                         LIST OF TABLES
      2. TABLE 1 QFD MODELING FOR MARKET SHARE ASSESSMENT
      3. TABLE 2 GLOBAL HEARING AIDS ESTIMATES & FORECAST, BY PRODUCT, 2019–2035 (USD MILLION)
      4. TABLE 3 GLOBAL HEARING AIDS ESTIMATES & FORECAST, BY HEARING AID DEVICES, 2019–2035 (USD MILLION)
      5. TABLE 4 GLOBAL HEARING AIDS ESTIMATES & FORECAST, BY HEARING IMPLANTS, 2019–2035 (USD MILLION)
      6. TABLE 5 GLOBAL HEARING AIDS ESTIMATES & FORECAST, BY TYPE OF HEARING LOSS, 2019–2035 (USD MILLION)
      7. TABLE 6 GLOBAL HEARING AIDS ESTIMATES & FORECAST, BY PATIENT TYPE, 2019–2035 (USD MILLION)
      8. TABLE 7 GLOBAL HEARING AIDS ESTIMATES & FORECAST, BY TECHNOLOGY, 2019–2035 (USD MILLION)
      9. TABLE 8 GLOBAL HEARING AIDS ESTIMATES & FORECAST, BY END USER, 2019–2035 (USD MILLION)
      10. TABLE 9 GLOBAL HEARING AIDS ESTIMATES & FORECAST, BY REGION, 2019–2035 (USD MILLION)
      11. TABLE 10 NORTH AMERICA HEARING AIDS ESTIMATES & FORECAST, BY PRODUCT, 2019–2035 (USD MILLION)
      12. TABLE 11 NORTH AMERICA HEARING AIDS ESTIMATES & FORECAST, BY HEARING AID DEVICES, 2019–2035 (USD MILLION)
      13. TABLE 12 NORTH AMERICA HEARING AIDS ESTIMATES & FORECAST, BY HEARING IMPLANTS, 2019–2035 (USD MILLION)
      14. TABLE 13 NORTH AMERICA HEARING AIDS ESTIMATES & FORECAST, BY TYPE OF HEARING LOSS, 2019–2035 (USD MILLION)
      15. TABLE 14 NORTH AMERICA HEARING AIDS ESTIMATES & FORECAST, BY PATIENT TYPE, 2019–2035 (USD MILLION)
      16. TABLE 15 NORTH AMERICA HEARING AIDS ESTIMATES & FORECAST, BY TECHNOLOGY, 2019–2035 (USD MILLION)
      17. TABLE 16 NORTH AMERICA HEARING AIDS ESTIMATES & FORECAST, BY END USER, 2019–2035 (USD MILLION)
      18. TABLE 17 US HEARING AIDS ESTIMATES & FORECAST, BY PRODUCT, 2019–2035 (USD MILLION)
      19. TABLE 18 US HEARING AIDS ESTIMATES & FORECAST, BY HEARING AID DEVICES, 2019–2035 (USD MILLION)
      20. TABLE 19 US HEARING AIDS ESTIMATES & FORECAST, BY HEARING IMPLANTS, 2019–2035 (USD MILLION)
      21. TABLE 20 US HEARING AIDS ESTIMATES & FORECAST, BY TYPE OF HEARING LOSS, 2019–2035 (USD MILLION)
      22. TABLE 21 US HEARING AIDS ESTIMATES & FORECAST, BY PATIENT TYPE, 2019–2035 (USD MILLION)
      23. TABLE 22 US HEARING AIDS ESTIMATES & FORECAST, BY TECHNOLOGY, 2019–2035 (USD MILLION)
      24. TABLE 23 US HEARING AIDS ESTIMATES & FORECAST, BY END USER, 2019–2035 (USD MILLION)
      25. TABLE 24 CANADA HEARING AIDS ESTIMATES & FORECAST, BY PRODUCT, 2019–2035 (USD MILLION)
      26. TABLE 25 CANADA HEARING AIDS ESTIMATES & FORECAST, BY HEARING AID DEVICES, 2019–2035 (USD MILLION)
      27. TABLE 26 CANADA HEARING AIDS ESTIMATES & FORECAST, BY HEARING IMPLANTS, 2019–2035 (USD MILLION)
      28. TABLE 27 CANADA HEARING AIDS ESTIMATES & FORECAST, BY TYPE OF HEARING LOSS, 2019–2035 (USD MILLION)
      29. TABLE 28 CANADA HEARING AIDS ESTIMATES & FORECAST, BY PATIENT TYPE, 2019–2035 (USD MILLION)
      30. TABLE 29 CANADA HEARING AIDS ESTIMATES & FORECAST, BY TECHNOLOGY, 2019–2035 (USD MILLION)
      31. TABLE 30 CANADA HEARING AIDS ESTIMATES & FORECAST, BY END USER, 2019–2035 (USD MILLION)
      32. TABLE 31 MEXICO HEARING AIDS ESTIMATES & FORECAST, BY PRODUCT, 2019–2035 (USD MILLION)
      33. TABLE 32 MEXICO HEARING AIDS ESTIMATES & FORECAST, BY HEARING AID DEVICES, 2019–2035 (USD MILLION)
      34. TABLE 33 MEXICO HEARING AIDS ESTIMATES & FORECAST, BY HEARING IMPLANTS, 2019–2035 (USD MILLION)
      35. TABLE 34 MEXICO HEARING AIDS ESTIMATES & FORECAST, BY TYPE OF HEARING LOSS, 2019–2035 (USD MILLION)
      36. TABLE 35 MEXICO HEARING AIDS ESTIMATES & FORECAST, BY PATIENT TYPE, 2019–2035 (USD MILLION)
      37. TABLE 36 MEXICO HEARING AIDS ESTIMATES & FORECAST, BY TECHNOLOGY, 2019–2035 (USD MILLION)
      38. TABLE 37 MEXICO HEARING AIDS ESTIMATES & FORECAST, BY END USER, 2019–2035 (USD MILLION)
      39. TABLE 38 EUROPE HEARING AIDS ESTIMATES & FORECAST, BY PRODUCT, 2019–2035 (USD MILLION)
      40. TABLE 39 EUROPE HEARING AIDS ESTIMATES & FORECAST, BY HEARING AID DEVICES, 2019–2035 (USD MILLION)
      41. TABLE 40 EUROPE HEARING AIDS ESTIMATES & FORECAST, BY HEARING IMPLANTS, 2019–2035 (USD MILLION)
      42. TABLE 41 EUROPE HEARING AIDS ESTIMATES & FORECAST, BY TYPE OF HEARING LOSS, 2019–2035 (USD MILLION)
      43. TABLE 42 EUROPE HEARING AIDS ESTIMATES & FORECAST, BY PATIENT TYPE, 2019–2035 (USD MILLION)
      44. TABLE 43 EUROPE HEARING AIDS ESTIMATES & FORECAST, BY TECHNOLOGY, 2019–2035 (USD MILLION)
      45. TABLE 44 EUROPE HEARING AIDS ESTIMATES & FORECAST, BY END USER, 2019–2035 (USD MILLION)
      46. TABLE 45 GERMANY HEARING AIDS ESTIMATES & FORECAST, BY PRODUCT, 2019–2035 (USD MILLION)
      47. TABLE 46 GERMANY HEARING AIDS ESTIMATES & FORECAST, BY HEARING AID DEVICES, 2019–2035 (USD MILLION)
      48. TABLE 47 GERMANY HEARING AIDS ESTIMATES & FORECAST, BY HEARING IMPLANTS, 2019–2035 (USD MILLION)
      49. TABLE 48 GERMANY HEARING AIDS ESTIMATES & FORECAST, BY TYPE OF HEARING LOSS, 2019–2035 (USD MILLION)
      50. TABLE 49 GERMANY HEARING AIDS ESTIMATES & FORECAST, BY PATIENT TYPE, 2019–2035 (USD MILLION)
      51. TABLE 50 GERMANY HEARING AIDS ESTIMATES & FORECAST, BY TECHNOLOGY, 2019–2035 (USD MILLION)
      52. TABLE 51 GERMANY HEARING AIDS ESTIMATES & FORECAST, BY END USER, 2019–2035 (USD MILLION)
      53. TABLE 52 UK HEARING AIDS ESTIMATES & FORECAST, BY PRODUCT, 2019–2035 (USD MILLION)
      54. TABLE 53 UK HEARING AIDS ESTIMATES & FORECAST, BY HEARING AID DEVICES, 2019–2035 (USD MILLION)
      55. TABLE 54 UK HEARING AIDS ESTIMATES & FORECAST, BY HEARING IMPLANTS, 2019–2035 (USD MILLION)
      56. TABLE 55 UK HEARING AIDS ESTIMATES & FORECAST, BY TYPE OF HEARING LOSS, 2019–2035 (USD MILLION)
      57. TABLE 56 UK HEARING AIDS ESTIMATES & FORECAST, BY PATIENT TYPE, 2019–2035 (USD MILLION)
      58. TABLE 57 UK HEARING AIDS ESTIMATES & FORECAST, BY TECHNOLOGY, 2019–2035 (USD MILLION)
      59. TABLE 58 UK HEARING AIDS ESTIMATES & FORECAST, BY END USER, 2019–2035 (USD MILLION)
      60. TABLE 59 FRANCE HEARING AIDS ESTIMATES & FORECAST, BY PRODUCT, 2019–2035 (USD MILLION)
      61. TABLE 60 FRANCE HEARING AIDS ESTIMATES & FORECAST, BY HEARING AID DEVICES, 2019–2035 (USD MILLION)
      62. TABLE 61 FRANCE HEARING AIDS ESTIMATES & FORECAST, BY HEARING IMPLANTS, 2019–2035 (USD MILLION)
      63. TABLE 62 FRANCE HEARING AIDS ESTIMATES & FORECAST, BY TYPE OF HEARING LOSS, 2019–2035 (USD MILLION)
      64. TABLE 63 FRANCE HEARING AIDS ESTIMATES & FORECAST, BY PATIENT TYPE, 2019–2035 (USD MILLION)
      65. TABLE 64 FRANCE HEARING AIDS ESTIMATES & FORECAST, BY TECHNOLOGY, 2019–2035 (USD MILLION)
      66. TABLE 65 FRANCE HEARING AIDS ESTIMATES & FORECAST, BY END USER, 2019–2035 (USD MILLION)
      67. TABLE 66 ITALY HEARING AIDS ESTIMATES & FORECAST, BY PRODUCT, 2019–2035 (USD MILLION)
      68. TABLE 67 ITALY HEARING AIDS ESTIMATES & FORECAST, BY HEARING AID DEVICES, 2019–2035 (USD MILLION)
      69. TABLE 68 ITALY HEARING AIDS ESTIMATES & FORECAST, BY HEARING IMPLANTS, 2019–2035 (USD MILLION)
      70. TABLE 69 ITALY HEARING AIDS ESTIMATES & FORECAST, BY TYPE OF HEARING LOSS, 2019–2035 (USD MILLION)
      71. TABLE 70 ITALY HEARING AIDS ESTIMATES & FORECAST, BY PATIENT TYPE, 2019–2035 (USD MILLION)
      72. TABLE 71 ITALY HEARING AIDS ESTIMATES & FORECAST, BY TECHNOLOGY, 2019–2035 (USD MILLION)
      73. TABLE 72 ITALY HEARING AIDS ESTIMATES & FORECAST, BY END USER, 2019–2035 (USD MILLION)
      74. TABLE 73 SPAIN HEARING AIDS ESTIMATES & FORECAST, BY PRODUCT, 2019–2035 (USD MILLION)
      75. TABLE 74 SPAIN HEARING AIDS ESTIMATES & FORECAST, BY HEARING AID DEVICES, 2019–2035 (USD MILLION)
      76. TABLE 75 SPAIN HEARING AIDS ESTIMATES & FORECAST, BY HEARING IMPLANTS, 2019–2035 (USD MILLION)
      77. TABLE 76 SPAIN HEARING AIDS ESTIMATES & FORECAST, BY TYPE OF HEARING LOSS, 2019–2035 (USD MILLION)
      78. TABLE 77 SPAIN HEARING AIDS ESTIMATES & FORECAST, BY PATIENT TYPE, 2019–2035 (USD MILLION)
      79. TABLE 78 SPAIN HEARING AIDS ESTIMATES & FORECAST, BY TECHNOLOGY, 2019–2035 (USD MILLION)
      80. TABLE 79 SPAIN HEARING AIDS ESTIMATES & FORECAST, BY END USER, 2019–2035 (USD MILLION)
      81. TABLE 80 REST OF EUROPE HEARING AIDS ESTIMATES & FORECAST, BY PRODUCT, 2019–2035 (USD MILLION)
      82. TABLE 81 REST OF EUROPE HEARING AIDS ESTIMATES & FORECAST, BY HEARING AID DEVICES, 2019–2035 (USD MILLION)
      83. TABLE 82 REST OF EUROPE HEARING AIDS ESTIMATES & FORECAST, BY HEARING IMPLANTS, 2019–2035 (USD MILLION)
      84. TABLE 83 REST OF EUROPE HEARING AIDS ESTIMATES & FORECAST, BY TYPE OF HEARING LOSS, 2019–2035 (USD MILLION)
      85. TABLE 84 REST OF EUROPE HEARING AIDS ESTIMATES & FORECAST, BY PATIENT TYPE, 2019–2035 (USD MILLION)
      86. TABLE 85 REST OF EUROPE HEARING AIDS ESTIMATES & FORECAST, BY TECHNOLOGY, 2019–2035 (USD MILLION)
      87. TABLE 86 REST OF EUROPE HEARING AIDS ESTIMATES & FORECAST, BY END USER, 2019–2035 (USD MILLION)
      88. TABLE 87 ASIA-PACIFIC HEARING AIDS ESTIMATES & FORECAST, BY PRODUCT, 2019–2035 (USD MILLION)
      89. TABLE 88 ASIA-PACIFIC HEARING AIDS ESTIMATES & FORECAST, BY HEARING AID DEVICES, 2019–2035 (USD MILLION)
      90. TABLE 89 ASIA-PACIFIC HEARING AIDS ESTIMATES & FORECAST, BY HEARING IMPLANTS, 2019–2035 (USD MILLION)
      91. TABLE 90 ASIA-PACIFIC HEARING AIDS ESTIMATES & FORECAST, BY TYPE OF HEARING LOSS, 2019–2035 (USD MILLION)
      92. TABLE 91 ASIA-PACIFIC HEARING AIDS ESTIMATES & FORECAST, BY PATIENT TYPE, 2019–2035 (USD MILLION)
      93. TABLE 92 ASIA-PACIFIC HEARING AIDS ESTIMATES & FORECAST, BY TECHNOLOGY, 2019–2035 (USD MILLION)
      94. TABLE 93 ASIA-PACIFIC HEARING AIDS ESTIMATES & FORECAST, BY END USER, 2019–2035 (USD MILLION)
      95. TABLE 94 JAPAN HEARING AIDS ESTIMATES & FORECAST, BY PRODUCT, 2019–2035 (USD MILLION)
      96. TABLE 95 JAPAN HEARING AIDS ESTIMATES & FORECAST, BY HEARING AID DEVICES, 2019–2035 (USD MILLION)
      97. TABLE 96 JAPAN HEARING AIDS ESTIMATES & FORECAST, BY HEARING IMPLANTS, 2019–2035 (USD MILLION)
      98. TABLE 97 JAPAN HEARING AIDS ESTIMATES & FORECAST, BY TYPE OF HEARING LOSS, 2019–2035 (USD MILLION)
      99. TABLE 98 JAPAN HEARING AIDS ESTIMATES & FORECAST, BY PATIENT TYPE, 2019–2035 (USD MILLION)
      100. TABLE 99 JAPAN HEARING AIDS ESTIMATES & FORECAST, BY TECHNOLOGY, 2019–2035 (USD MILLION)
      101. TABLE 100 JAPAN HEARING AIDS ESTIMATES & FORECAST, BY END USER, 2019–2035 (USD MILLION)
      102. TABLE 101 CHINA HEARING AIDS ESTIMATES & FORECAST, BY PRODUCT, 2019–2035 (USD MILLION)
      103. TABLE 102 CHINA HEARING AIDS ESTIMATES & FORECAST, BY HEARING AID DEVICES, 2019–2035 (USD MILLION)
      104. TABLE 103 CHINA HEARING AIDS ESTIMATES & FORECAST, BY HEARING IMPLANTS, 2019–2035 (USD MILLION)
      105. TABLE 104 CHINA HEARING AIDS ESTIMATES & FORECAST, BY TYPE OF HEARING LOSS, 2019–2035 (USD MILLION)
      106. TABLE 105 CHINA HEARING AIDS ESTIMATES & FORECAST, BY PATIENT TYPE, 2019–2035 (USD MILLION)
      107. TABLE 106 CHINA HEARING AIDS ESTIMATES & FORECAST, BY TECHNOLOGY, 2019–2035 (USD MILLION)
      108. TABLE 107 CHINA HEARING AIDS ESTIMATES & FORECAST, BY END USER, 2019–2035 (USD MILLION)
      109. TABLE 108 INDIA HEARING AIDS ESTIMATES & FORECAST, BY PRODUCT, 2019–2035 (USD MILLION)
      110. TABLE 109 INDIA HEARING AIDS ESTIMATES & FORECAST, BY HEARING AID DEVICES, 2019–2035 (USD MILLION)
      111. TABLE 110 INDIA HEARING AIDS ESTIMATES & FORECAST, BY HEARING IMPLANTS, 2019–2035 (USD MILLION)
      112. TABLE 111 INDIA HEARING AIDS ESTIMATES & FORECAST, BY TYPE OF HEARING LOSS, 2019–2035 (USD MILLION)
      113. TABLE 112 INDIA HEARING AIDS ESTIMATES & FORECAST, BY PATIENT TYPE, 2019–2035 (USD MILLION)
      114. TABLE 113 INDIA HEARING AIDS ESTIMATES & FORECAST, BY TECHNOLOGY, 2019–2035 (USD MILLION)
      115. TABLE 114 INDIA HEARING AIDS ESTIMATES & FORECAST, BY END USER, 2019–2035 (USD MILLION)
      116. TABLE 115 AUSTRALIA HEARING AIDS ESTIMATES & FORECAST, BY PRODUCT, 2019–2035 (USD MILLION)
      117. TABLE 116 AUSTRALIA HEARING AIDS ESTIMATES & FORECAST, BY HEARING AID DEVICES, 2019–2035 (USD MILLION)
      118. TABLE 117 AUSTRALIA HEARING AIDS ESTIMATES & FORECAST, BY HEARING IMPLANTS, 2019–2035 (USD MILLION)
      119. TABLE 118 AUSTRALIA HEARING AIDS ESTIMATES & FORECAST, BY TYPE OF HEARING LOSS, 2019–2035 (USD MILLION)
      120. TABLE 119 AUSTRALIA HEARING AIDS ESTIMATES & FORECAST, BY PATIENT TYPE, 2019–2035 (USD MILLION)
      121. TABLE 120 AUSTRALIA HEARING AIDS ESTIMATES & FORECAST, BY TECHNOLOGY, 2019–2035 (USD MILLION)
      122. TABLE 121 AUSTRALIA HEARING AIDS ESTIMATES & FORECAST, BY END USER, 2019–2035 (USD MILLION)
      123. TABLE 122 REST OF ASIA PACIFIC HEARING AIDS ESTIMATES & FORECAST, BY PRODUCT, 2019–2035 (USD MILLION)
      124. TABLE 123 REST OF ASIA PACIFIC HEARING AIDS ESTIMATES & FORECAST, BY HEARING AID DEVICES, 2019–2035 (USD MILLION)
      125. TABLE 124 REST OF ASIA PACIFIC HEARING AIDS ESTIMATES & FORECAST, BY HEARING IMPLANTS, 2019–2035 (USD MILLION)
      126. TABLE 125 REST OF ASIA PACIFIC HEARING AIDS ESTIMATES & FORECAST, BY TYPE OF HEARING LOSS, 2019–2035 (USD MILLION)
      127. TABLE 126 REST OF ASIA PACIFIC HEARING AIDS ESTIMATES & FORECAST, BY PATIENT TYPE, 2019–2035 (USD MILLION)
      128. TABLE 127 REST OF ASIA PACIFIC HEARING AIDS ESTIMATES & FORECAST, BY TECHNOLOGY, 2019–2035 (USD MILLION)
      129. TABLE 128 REST OF ASIA PACIFIC HEARING AIDS ESTIMATES & FORECAST, BY END USER, 2019–2035 (USD MILLION)
      130. TABLE 129 SOUTH AMERICA HEARING AIDS ESTIMATES & FORECAST, BY PRODUCT, 2019–2035 (USD MILLION)
      131. TABLE 130 SOUTH AMERICA HEARING AIDS ESTIMATES & FORECAST, BY HEARING AID DEVICES, 2019–2035 (USD MILLION)
      132. TABLE 131 SOUTH AMERICA HEARING AIDS ESTIMATES & FORECAST, BY HEARING IMPLANTS, 2019–2035 (USD MILLION)
      133. TABLE 132 SOUTH AMERICA HEARING AIDS ESTIMATES & FORECAST, BY TYPE OF HEARING LOSS, 2019–2035 (USD MILLION)
      134. TABLE 133 SOUTH AMERICA HEARING AIDS ESTIMATES & FORECAST, BY PATIENT TYPE, 2019–2035 (USD MILLION)
      135. TABLE 134 SOUTH AMERICA HEARING AIDS ESTIMATES & FORECAST, BY TECHNOLOGY, 2019–2035 (USD MILLION)
      136. TABLE 135 SOUTH AMERICA HEARING AIDS ESTIMATES & FORECAST, BY END USER, 2019–2035 (USD MILLION)
      137. TABLE 136 BRAZIL HEARING AIDS ESTIMATES & FORECAST, BY PRODUCT, 2019–2035 (USD MILLION)
      138. TABLE 137 BRAZIL HEARING AIDS ESTIMATES & FORECAST, BY HEARING AID DEVICES, 2019–2035 (USD MILLION)
      139. TABLE 138 BRAZIL HEARING AIDS ESTIMATES & FORECAST, BY HEARING IMPLANTS, 2019–2035 (USD MILLION)
      140. TABLE 139 BRAZIL HEARING AIDS ESTIMATES & FORECAST, BY TYPE OF HEARING LOSS, 2019–2035 (USD MILLION)
      141. TABLE 140 BRAZIL HEARING AIDS ESTIMATES & FORECAST, BY PATIENT TYPE, 2019–2035 (USD MILLION)
      142. TABLE 141 BRAZIL HEARING AIDS ESTIMATES & FORECAST, BY TECHNOLOGY, 2019–2035 (USD MILLION)
      143. TABLE 142 BRAZIL HEARING AIDS ESTIMATES & FORECAST, BY END USER, 2019–2035 (USD MILLION)
      144. TABLE 143 COLOMBIA HEARING AIDS ESTIMATES & FORECAST, BY PRODUCT, 2019–2035 (USD MILLION)
      145. TABLE 144 COLOMBIA HEARING AIDS ESTIMATES & FORECAST, BY HEARING AID DEVICES, 2019–2035 (USD MILLION)
      146. TABLE 145 COLOMBIA HEARING AIDS ESTIMATES & FORECAST, BY HEARING IMPLANTS, 2019–2035 (USD MILLION)
      147. TABLE 146 COLOMBIA HEARING AIDS ESTIMATES & FORECAST, BY TYPE OF HEARING LOSS, 2019–2035 (USD MILLION)
      148. TABLE 147 COLOMBIA HEARING AIDS ESTIMATES & FORECAST, BY PATIENT TYPE, 2019–2035 (USD MILLION)
      149. TABLE 148 COLOMBIA HEARING AIDS ESTIMATES & FORECAST, BY TECHNOLOGY, 2019–2035 (USD MILLION)
      150. TABLE 149 COLOMBIA HEARING AIDS ESTIMATES & FORECAST, BY END USER, 2019–2035 (USD MILLION)
      151. TABLE 150 REST OF SOUTH AMERICA HEARING AIDS ESTIMATES & FORECAST, BY PRODUCT, 2019–2035 (USD MILLION)
      152. TABLE 151 REST OF SOUTH AMERICA HEARING AIDS ESTIMATES & FORECAST, BY HEARING AID DEVICES, 2019–2035 (USD MILLION)
      153. TABLE 152 REST OF SOUTH AMERICA HEARING AIDS ESTIMATES & FORECAST, BY HEARING IMPLANTS, 2019–2035 (USD MILLION)
      154. TABLE 153 REST OF SOUTH AMERICA HEARING AIDS ESTIMATES & FORECAST, BY TYPE OF HEARING LOSS, 2019–2035 (USD MILLION)
      155. TABLE 154 REST OF SOUTH AMERICA HEARING AIDS ESTIMATES & FORECAST, BY PATIENT TYPE, 2019–2035 (USD MILLION)
      156. TABLE 155 REST OF SOUTH AMERICA HEARING AIDS ESTIMATES & FORECAST, BY TECHNOLOGY, 2019–2035 (USD MILLION)
      157. TABLE 156 REST OF SOUTH AMERICA HEARING AIDS ESTIMATES & FORECAST, BY END USER, 2019–2035 (USD MILLION)
      158. TABLE 157 MIDDLE EAST AND AFRICA HEARING AIDS ESTIMATES & FORECAST, BY PRODUCT, 2019–2035 (USD MILLION)
      159. TABLE 158 MIDDLE EAST AND AFRICA HEARING AIDS ESTIMATES & FORECAST, BY HEARING AID DEVICES, 2019–2035 (USD MILLION)
      160. TABLE 159 MIDDLE EAST AND AFRICA HEARING AIDS ESTIMATES & FORECAST, BY HEARING IMPLANTS, 2019–2035 (USD MILLION)
      161. TABLE 160 MIDDLE EAST AND AFRICA HEARING AIDS ESTIMATES & FORECAST, BY TYPE OF HEARING LOSS, 2019–2035 (USD MILLION)
      162. TABLE 161 MIDDLE EAST AND AFRICA HEARING AIDS ESTIMATES & FORECAST, BY PATIENT TYPE, 2019–2035 (USD MILLION)
      163. TABLE 162 MIDDLE EAST AND AFRICA HEARING AIDS ESTIMATES & FORECAST, BY TECHNOLOGY, 2019–2035 (USD MILLION)
      164. TABLE 163 MIDDLE EAST AND AFRICA HEARING AIDS ESTIMATES & FORECAST, BY END USER, 2019–2035 (USD MILLION)
      165. TABLE 164 SOUTH AFRICA HEARING AIDS ESTIMATES & FORECAST, BY PRODUCT, 2019–2035 (USD MILLION)
      166. TABLE 165 SOUTH AFRICA HEARING AIDS ESTIMATES & FORECAST, BY HEARING AID DEVICES, 2019–2035 (USD MILLION)
      167. TABLE 166 SOUTH AFRICA HEARING AIDS ESTIMATES & FORECAST, BY HEARING IMPLANTS, 2019–2035 (USD MILLION)
      168. TABLE 167 SOUTH AFRICA HEARING AIDS ESTIMATES & FORECAST, BY TYPE OF HEARING LOSS, 2019–2035 (USD MILLION)
      169. TABLE 168 SOUTH AFRICA HEARING AIDS ESTIMATES & FORECAST, BY PATIENT TYPE, 2019–2035 (USD MILLION)
      170. TABLE 169 SOUTH AFRICA HEARING AIDS ESTIMATES & FORECAST, BY TECHNOLOGY, 2019–2035 (USD MILLION)
      171. TABLE 170 SOUTH AFRICA HEARING AIDS ESTIMATES & FORECAST, BY END USER, 2019–2035 (USD MILLION)
      172. TABLE 171 GCC COUNTRIES HEARING AIDS ESTIMATES & FORECAST, BY PRODUCT, 2019–2035 (USD MILLION)
      173. TABLE 172 GCC COUNTRIES HEARING AIDS ESTIMATES & FORECAST, BY HEARING AID DEVICES, 2019–2035 (USD MILLION)
      174. TABLE 173 GCC COUNTRIES HEARING AIDS ESTIMATES & FORECAST, BY HEARING IMPLANTS, 2019–2035 (USD MILLION)
      175. TABLE 174 GCC COUNTRIES HEARING AIDS ESTIMATES & FORECAST, BY TYPE OF HEARING LOSS, 2019–2035 (USD MILLION)
      176. TABLE 175 GCC COUNTRIES HEARING AIDS ESTIMATES & FORECAST, BY PATIENT TYPE, 2019–2035 (USD MILLION)
      177. TABLE 176 GCC COUNTRIES HEARING AIDS ESTIMATES & FORECAST, BY TECHNOLOGY, 2019–2035 (USD MILLION)
      178. TABLE 177 GCC COUNTRIES HEARING AIDS ESTIMATES & FORECAST, BY END USER, 2019–2035 (USD MILLION)
      179. TABLE 178 REST OF MIDDLE EAST AND AFRICA HEARING AIDS ESTIMATES & FORECAST, BY PRODUCT, 2019–2035 (USD MILLION)
      180. TABLE 179 REST OF MIDDLE EAST AND AFRICA HEARING AIDS ESTIMATES & FORECAST, BY HEARING AID DEVICES, 2019–2035 (USD MILLION)
      181. TABLE 180 REST OF MIDDLE EAST AND AFRICA HEARING AIDS ESTIMATES & FORECAST, BY HEARING IMPLANTS, 2019–2035 (USD MILLION)
      182. TABLE 181 REST OF MIDDLE EAST AND AFRICA HEARING AIDS ESTIMATES & FORECAST, BY TYPE OF HEARING LOSS, 2019–2035 (USD MILLION)
      183. TABLE 182 REST OF MIDDLE EAST AND AFRICA HEARING AIDS ESTIMATES & FORECAST, BY PATIENT TYPE, 2019–2035 (USD MILLION)
      184. TABLE 183 REST OF MIDDLE EAST AND AFRICA HEARING AIDS ESTIMATES & FORECAST, BY TECHNOLOGY, 2019–2035 (USD MILLION)
      185. TABLE 184 REST OF MIDDLE EAST AND AFRICA HEARING AIDS ESTIMATES & FORECAST, BY END USER, 2019–2035 (USD MILLION)
      186. TABLE 185 COCHLEAR LIMITED COMPANY: PRODUCTS OFFERED
      187. TABLE 186 GN HEARING A/S: PRODUCTS OFFERED
      188. TABLE 187 SONOVA: PRODUCTS OFFERED
      189. TABLE 188 WILLIAM DEMANT HOLDING A/S.: PRODUCTS OFFERED
      190. TABLE 189 STARKEY: PRODUCTS OFFERED
      191. TABLE 190 PETROFAC PRODUCTS OFFERED
      192. TABLE 191 HALLIBURTON PRODUCTS OFFERED
      193. TABLE 192 ZOUNDS HEARING PRODUCTS OFFERED
      194. TABLE 193 AUDINA HEARING INSTRUMENTS PRODUCTS OFFERED
      195. TABLE 194 AUDINA HEARING INSTRUMENTS PRODUCTS OFFERED   LIST OF FIGURES
      196. FIGURE 1 GLOBAL HEARING AIDS MARKET, BY PRODUCT, 2023 (% SHARE)
      197. FIGURE 2 GLOBAL HEARING AIDS MARKET, BY TYPE OF HEARING LOSS, 2023 (% SHARE)
      198. FIGURE 3 GLOBAL HEARING AIDS MARKET, BY PATIENT TYPE, 2023 (% SHARE)
      199. FIGURE 4 GLOBAL HEARING AIDS MARKET, BY TECHNOLOGY, 2023 (% SHARE)
      200. FIGURE 5 GLOBAL HEARING AIDS MARKET, BY END USER, 2023 (% SHARE)
      201. FIGURE 6 GLOBAL HEARING AIDS MARKET MAJOR PLAYERS MARKET SHARE ANALYSIS, 2023 (%)
      202. FIGURE 7 COCHLEAR LIMITED COMPANY: SWOT ANALYSIS
      203. FIGURE 8 GN HEARING A/S: SWOT ANALYSIS
      204. FIGURE 9 SONOVA: SWOT ANALYSIS
      205. FIGURE 10 WILLIAM DEMANT HOLDING A/S.: SWOT ANALYSIS
      206. FIGURE 11 STARKEY: SWOT ANALYSIS
      207. FIGURE 12 PETROFAC SWOT ANALYSIS
      208. FIGURE 13 HALLIBURTON SWOT ANALYSIS
      209. FIGURE 14 ZOUNDS HEARING SWOT ANALYSIS
      210. FIGURE 15 AUDINA HEARING INSTRUMENTS SWOT ANALYSIS
      211. FIGURE 16 AUDINA HEARING INSTRUMENTS SWOT ANALYSIS  "

    Global Hearing Aids, By Product (USD Billion,2019-2035)

    • Hearing Aid Devices
      • Receiver-In-The-Ear (RITE) Hearing Aids
      • Behind-The-Ear (BTE) Hearing Aids
      • Canal Hearing Aids
      • In-The-Ear (ITE) Hearing Aids
      • Other
    • Hearing Implants
      • Cochlear Implants
      • Bone-Anchored Systems

    Global Hearing Aids, By Type of Hearing Loss (USD Billion,2019-2035)

    • Sensorineural Hearing Loss
    • Conductive Hearing Loss

    Global Hearing Aids, By Patient Type (USD Billion,2019-2035)

    • Adults
    • Pediatrics

    Global Hearing Aids, By Technology (USD Billion,2019-2035)

    • Analog
    • Digital

    Global Hearing Aids, By End-User (USD Billion,2019-2035)

    • Private Pay/Out of Pocket
    • Third Party Payer
    • Medicare/Medicaid

    US Hearing Aids, By Product (USD Billion,2019-2035)

    • Hearing Aid Devices
      • Receiver-In-The-Ear (RITE) Hearing Aids
      • Behind-The-Ear (BTE) Hearing Aids
      • Canal Hearing Aids
      • In-The-Ear (ITE) Hearing Aids
      • Other
    • Hearing Implants
      • Cochlear Implants
      • Bone-Anchored Systems

    US Hearing Aids, By Type of Hearing Loss (USD Billion,2019-2035)

    • Sensorineural Hearing Loss
    • Conductive Hearing Loss

    US Hearing Aids, By Patient Type (USD Billion,2019-2035)

    • Adults
    • Pediatrics

    US Hearing Aids, By Technology (USD Billion,2019-2035)

    • Analog
    • Digital

    US Hearing Aids, By End-User (USD Billion,2019-2035)

    • Private Pay/Out of Pocket
    • Third Party Payer
    • Medicare/Medicaid

    Canada Hearing Aids, By Product (USD Billion,2019-2035)

    • Hearing Aid Devices
      • Receiver-In-The-Ear (RITE) Hearing Aids
      • Behind-The-Ear (BTE) Hearing Aids
      • Canal Hearing Aids
      • In-The-Ear (ITE) Hearing Aids
      • Other
    • Hearing Implants
      • Cochlear Implants
      • Bone-Anchored Systems

    Canada Hearing Aids, By Type of Hearing Loss (USD Billion,2019-2035)

    • Sensorineural Hearing Loss
    • Conductive Hearing Loss

    Canada Hearing Aids, By Patient Type (USD Billion,2019-2035)

    • Adults
    • Pediatrics

    Canada Hearing Aids, By Technology (USD Billion,2019-2035)

    • Analog
    • Digital

    Canada Hearing Aids, By End-User (USD Billion,2019-2035)

    • Private Pay/Out of Pocket
    • Third Party Payer
    • Medicare/Medicaid

    Mexico Hearing Aids, By Product (USD Billion,2019-2035)

    • Hearing Aid Devices
      • Receiver-In-The-Ear (RITE) Hearing Aids
      • Behind-The-Ear (BTE) Hearing Aids
      • Canal Hearing Aids
      • In-The-Ear (ITE) Hearing Aids
      • Other
    • Hearing Implants
      • Cochlear Implants
      • Bone-Anchored Systems

    Mexico Hearing Aids, By Type of Hearing Loss (USD Billion,2019-2035)

    • Sensorineural Hearing Loss
    • Conductive Hearing Loss

    Mexico Hearing Aids, By Patient Type (USD Billion,2019-2035)

    • Adults
    • Pediatrics

    Mexico Hearing Aids, By Technology (USD Billion,2019-2035)

    • Analog
    • Digital

    Mexico Hearing Aids, By End-User (USD Billion,2019-2035)

    • Private Pay/Out of Pocket
    • Third Party Payer
    • Medicare/Medicaid

    Europe Hearing Aids, By Product (USD Billion,2019-2035)

    • Hearing Aid Devices
      • Receiver-In-The-Ear (RITE) Hearing Aids
      • Behind-The-Ear (BTE) Hearing Aids
      • Canal Hearing Aids
      • In-The-Ear (ITE) Hearing Aids
      • Other
    • Hearing Implants
      • Cochlear Implants
      • Bone-Anchored Systems

    Europe Hearing Aids, By Type of Hearing Loss (USD Billion,2019-2035)

    • Sensorineural Hearing Loss
    • Conductive Hearing Loss

    Europe Hearing Aids, By Patient Type (USD Billion,2019-2035)

    • Adults
    • Pediatrics

    Europe Hearing Aids, By Technology (USD Billion,2019-2035)

    • Analog
    • Digital

    Europe Hearing Aids, By End-User (USD Billion,2019-2035)

    • Private Pay/Out of Pocket
    • Third Party Payer
    • Medicare/Medicaid

    Germany Hearing Aids, By Product (USD Billion,2019-2035)

    • Hearing Aid Devices
      • Receiver-In-The-Ear (RITE) Hearing Aids
      • Behind-The-Ear (BTE) Hearing Aids
      • Canal Hearing Aids
      • In-The-Ear (ITE) Hearing Aids
      • Other
    • Hearing Implants
      • Cochlear Implants
      • Bone-Anchored Systems

    Germany Hearing Aids, By Type of Hearing Loss (USD Billion,2019-2035)

    • Sensorineural Hearing Loss
    • Conductive Hearing Loss

    Germany Hearing Aids, By Patient Type (USD Billion,2019-2035)

    • Adults
    • Pediatrics

    Germany Hearing Aids, By Technology (USD Billion,2019-2035)

    • Analog
    • Digital

    Germany Hearing Aids, By End-User (USD Billion,2019-2035)

    • Private Pay/Out of Pocket
    • Third Party Payer
    • Medicare/Medicaid

    UK Hearing Aids, By Product (USD Billion,2019-2035)

    • Hearing Aid Devices
      • Receiver-In-The-Ear (RITE) Hearing Aids
      • Behind-The-Ear (BTE) Hearing Aids
      • Canal Hearing Aids
      • In-The-Ear (ITE) Hearing Aids
      • Other
    • Hearing Implants
      • Cochlear Implants
      • Bone-Anchored Systems

    UK Hearing Aids, By Type of Hearing Loss (USD Billion,2019-2035)

    • Sensorineural Hearing Loss
    • Conductive Hearing Loss

    UK Hearing Aids, By Patient Type (USD Billion,2019-2035)

    • Adults
    • Pediatrics

    UK Hearing Aids, By Technology (USD Billion,2019-2035)

    • Analog
    • Digital

    UK Hearing Aids, By End-User (USD Billion,2019-2035)

    • Private Pay/Out of Pocket
    • Third Party Payer
    • Medicare/Medicaid

    France Hearing Aids, By Product (USD Billion,2019-2035)

    • Hearing Aid Devices
      • Receiver-In-The-Ear (RITE) Hearing Aids
      • Behind-The-Ear (BTE) Hearing Aids
      • Canal Hearing Aids
      • In-The-Ear (ITE) Hearing Aids
      • Other
    • Hearing Implants
      • Cochlear Implants
      • Bone-Anchored Systems

    France Hearing Aids, By Type of Hearing Loss (USD Billion,2019-2035)

    • Sensorineural Hearing Loss
    • Conductive Hearing Loss

    France Hearing Aids, By Patient Type (USD Billion,2019-2035)

    • Adults
    • Pediatrics

    France Hearing Aids, By Technology (USD Billion,2019-2035)

    • Analog
    • Digital

    France Hearing Aids, By End-User (USD Billion,2019-2035)

    • Private Pay/Out of Pocket
    • Third Party Payer
    • Medicare/Medicaid

    Italy Hearing Aids, By Product (USD Billion,2019-2035)

    • Hearing Aid Devices
      • Receiver-In-The-Ear (RITE) Hearing Aids
      • Behind-The-Ear (BTE) Hearing Aids
      • Canal Hearing Aids
      • In-The-Ear (ITE) Hearing Aids
      • Other
    • Hearing Implants
      • Cochlear Implants
      • Bone-Anchored Systems

    Italy Hearing Aids, By Type of Hearing Loss (USD Billion,2019-2035)

    • Sensorineural Hearing Loss
    • Conductive Hearing Loss

    Italy Hearing Aids, By Patient Type (USD Billion,2019-2035)

    • Adults
    • Pediatrics

    Italy Hearing Aids, By Technology (USD Billion,2019-2035)

    • Analog
    • Digital

    Italy Hearing Aids, By End-User (USD Billion,2019-2035)

    • Private Pay/Out of Pocket
    • Third Party Payer
    • Medicare/Medicaid

    Spain Hearing Aids, By Product (USD Billion,2019-2035)

    • Hearing Aid Devices
      • Receiver-In-The-Ear (RITE) Hearing Aids
      • Behind-The-Ear (BTE) Hearing Aids
      • Canal Hearing Aids
      • In-The-Ear (ITE) Hearing Aids
      • Other
    • Hearing Implants
      • Cochlear Implants
      • Bone-Anchored Systems

    Spain Hearing Aids, By Type of Hearing Loss (USD Billion,2019-2035)

    • Sensorineural Hearing Loss
    • Conductive Hearing Loss

    Spain Hearing Aids, By Patient Type (USD Billion,2019-2035)

    • Adults
    • Pediatrics

    Spain Hearing Aids, By Technology (USD Billion,2019-2035)

    • Analog
    • Digital

    Spain Hearing Aids, By End-User (USD Billion,2019-2035)

    • Private Pay/Out of Pocket
    • Third Party Payer
    • Medicare/Medicaid

    Rest of Europe Hearing Aids, By Product (USD Billion,2019-2035)

    • Hearing Aid Devices
      • Receiver-In-The-Ear (RITE) Hearing Aids
      • Behind-The-Ear (BTE) Hearing Aids
      • Canal Hearing Aids
      • In-The-Ear (ITE) Hearing Aids
      • Other
    • Hearing Implants
      • Cochlear Implants
      • Bone-Anchored Systems

    Rest of Europe Hearing Aids, By Type of Hearing Loss (USD Billion,2019-2035)

    • Sensorineural Hearing Loss
    • Conductive Hearing Loss

    Rest of Europe Hearing Aids, By Patient Type (USD Billion,2019-2035)

    • Adults
    • Pediatrics

    Rest of Europe Hearing Aids, By Technology (USD Billion,2019-2035)

    • Analog
    • Digital

    Rest of Europe Hearing Aids, By End-User (USD Billion,2019-2035)

    • Private Pay/Out of Pocket
    • Third Party Payer
    • Medicare/Medicaid

    Asia-Pacific Hearing Aids, By Product (USD Billion,2019-2035)

    • Hearing Aid Devices
      • Receiver-In-The-Ear (RITE) Hearing Aids
      • Behind-The-Ear (BTE) Hearing Aids
      • Canal Hearing Aids
      • In-The-Ear (ITE) Hearing Aids
      • Other
    • Hearing Implants
      • Cochlear Implants
      • Bone-Anchored Systems

    Asia-Pacific Hearing Aids, By Type of Hearing Loss (USD Billion,2019-2035)

    • Sensorineural Hearing Loss
    • Conductive Hearing Loss

    Asia-Pacific Hearing Aids, By Patient Type (USD Billion,2019-2035)

    • Adults
    • Pediatrics

    Asia-Pacific Hearing Aids, By Technology (USD Billion,2019-2035)

    • Analog
    • Digital

    Asia-Pacific Hearing Aids, By End-User (USD Billion,2019-2035)

    • Private Pay/Out of Pocket
    • Third Party Payer
    • Medicare/Medicaid

    Japan Hearing Aids, By Product (USD Billion,2019-2035)

    • Hearing Aid Devices
      • Receiver-In-The-Ear (RITE) Hearing Aids
      • Behind-The-Ear (BTE) Hearing Aids
      • Canal Hearing Aids
      • In-The-Ear (ITE) Hearing Aids
      • Other
    • Hearing Implants
      • Cochlear Implants
      • Bone-Anchored Systems

    Japan Hearing Aids, By Type of Hearing Loss (USD Billion,2019-2035)

    • Sensorineural Hearing Loss
    • Conductive Hearing Loss

    Japan Hearing Aids, By Patient Type (USD Billion,2019-2035)

    • Adults
    • Pediatrics

    Japan Hearing Aids, By Technology (USD Billion,2019-2035)

    • Analog
    • Digital

    Japan Hearing Aids, By End-User (USD Billion,2019-2035)

    • Private Pay/Out of Pocket
    • Third Party Payer
    • Medicare/Medicaid

    China Hearing Aids, By Product (USD Billion,2019-2035)

    • Hearing Aid Devices
      • Receiver-In-The-Ear (RITE) Hearing Aids
      • Behind-The-Ear (BTE) Hearing Aids
      • Canal Hearing Aids
      • In-The-Ear (ITE) Hearing Aids
      • Other
    • Hearing Implants
      • Cochlear Implants
      • Bone-Anchored Systems

    China Hearing Aids, By Type of Hearing Loss (USD Billion,2019-2035)

    • Sensorineural Hearing Loss
    • Conductive Hearing Loss

    China Hearing Aids, By Patient Type (USD Billion,2019-2035)

    • Adults
    • Pediatrics

    China Hearing Aids, By Technology (USD Billion,2019-2035)

    • Analog
    • Digital

    China Hearing Aids, By End-User (USD Billion,2019-2035)

    • Private Pay/Out of Pocket
    • Third Party Payer
    • Medicare/Medicaid

    India Hearing Aids, By Product (USD Billion,2019-2035)

    • Hearing Aid Devices
      • Receiver-In-The-Ear (RITE) Hearing Aids
      • Behind-The-Ear (BTE) Hearing Aids
      • Canal Hearing Aids
      • In-The-Ear (ITE) Hearing Aids
      • Other
    • Hearing Implants
      • Cochlear Implants
      • Bone-Anchored Systems

    India Hearing Aids, By Type of Hearing Loss (USD Billion,2019-2035)

    • Sensorineural Hearing Loss
    • Conductive Hearing Loss

    India Hearing Aids, By Patient Type (USD Billion,2019-2035)

    • Adults
    • Pediatrics

    India Hearing Aids, By Technology (USD Billion,2019-2035)

    • Analog
    • Digital

    India Hearing Aids, By End-User (USD Billion,2019-2035)

    • Private Pay/Out of Pocket
    • Third Party Payer
    • Medicare/Medicaid

    Australia Hearing Aids, By Product (USD Billion,2019-2035)

    • Hearing Aid Devices
      • Receiver-In-The-Ear (RITE) Hearing Aids
      • Behind-The-Ear (BTE) Hearing Aids
      • Canal Hearing Aids
      • In-The-Ear (ITE) Hearing Aids
      • Other
    • Hearing Implants
      • Cochlear Implants
      • Bone-Anchored Systems

    Australia Hearing Aids, By Type of Hearing Loss (USD Billion,2019-2035)

    • Sensorineural Hearing Loss
    • Conductive Hearing Loss

    Australia Hearing Aids, By Patient Type (USD Billion,2019-2035)

    • Adults
    • Pediatrics

    Australia Hearing Aids, By Technology (USD Billion,2019-2035)

    • Analog
    • Digital

    Australia Hearing Aids, By End-User (USD Billion,2019-2035)

    • Private Pay/Out of Pocket
    • Third Party Payer
    • Medicare/Medicaid

    Rest of Asia-Pacific Hearing Aids, By Product (USD Billion,2019-2035)

    • Hearing Aid Devices
      • Receiver-In-The-Ear (RITE) Hearing Aids
      • Behind-The-Ear (BTE) Hearing Aids
      • Canal Hearing Aids
      • In-The-Ear (ITE) Hearing Aids
      • Other
    • Hearing Implants
      • Cochlear Implants
      • Bone-Anchored Systems

    Rest of Asia-Pacific Hearing Aids, By Type of Hearing Loss (USD Billion,2019-2035)

    • Sensorineural Hearing Loss
    • Conductive Hearing Loss

    Rest of Asia-Pacific Hearing Aids, By Patient Type (USD Billion,2019-2035)

    • Adults
    • Pediatrics

    Rest of Asia-Pacific Hearing Aids, By Technology (USD Billion,2019-2035)

    • Analog
    • Digital

    Rest of Asia-Pacific Hearing Aids, By End-User (USD Billion,2019-2035)

    • Private Pay/Out of Pocket
    • Third Party Payer
    • Medicare/Medicaid

    South America Hearing Aids, By Product (USD Billion,2019-2035)

    • Hearing Aid Devices
      • Receiver-In-The-Ear (RITE) Hearing Aids
      • Behind-The-Ear (BTE) Hearing Aids
      • Canal Hearing Aids
      • In-The-Ear (ITE) Hearing Aids
      • Other
    • Hearing Implants
      • Cochlear Implants
      • Bone-Anchored Systems

    South America Hearing Aids, By Type of Hearing Loss (USD Billion,2019-2035)

    • Sensorineural Hearing Loss
    • Conductive Hearing Loss

    South America Hearing Aids, By Patient Type (USD Billion,2019-2035)

    • Adults
    • Pediatrics

    South America Hearing Aids, By Technology (USD Billion,2019-2035)

    • Analog
    • Digital

    South America Hearing Aids, By End-User (USD Billion,2019-2035)

    • Private Pay/Out of Pocket
    • Third Party Payer
    • Medicare/Medicaid

    Brazil Hearing Aids, By Product (USD Billion,2019-2035)

    • Hearing Aid Devices
      • Receiver-In-The-Ear (RITE) Hearing Aids
      • Behind-The-Ear (BTE) Hearing Aids
      • Canal Hearing Aids
      • In-The-Ear (ITE) Hearing Aids
      • Other
    • Hearing Implants
      • Cochlear Implants
      • Bone-Anchored Systems

    Brazil Hearing Aids, By Type of Hearing Loss (USD Billion,2019-2035)

    • Sensorineural Hearing Loss
    • Conductive Hearing Loss

    Brazil Hearing Aids, By Patient Type (USD Billion,2019-2035)

    • Adults
    • Pediatrics

    Brazil Hearing Aids, By Technology (USD Billion,2019-2035)

    • Analog
    • Digital

    Brazil Hearing Aids, By End-User (USD Billion,2019-2035)

    • Private Pay/Out of Pocket
    • Third Party Payer
    • Medicare/Medicaid

    Colombia Hearing Aids, By Product (USD Billion,2019-2035)

    • Hearing Aid Devices
      • Receiver-In-The-Ear (RITE) Hearing Aids
      • Behind-The-Ear (BTE) Hearing Aids
      • Canal Hearing Aids
      • In-The-Ear (ITE) Hearing Aids
      • Other
    • Hearing Implants
      • Cochlear Implants
      • Bone-Anchored Systems

    Colombia Hearing Aids, By Type of Hearing Loss (USD Billion,2019-2035)

    • Sensorineural Hearing Loss
    • Conductive Hearing Loss

    Colombia Hearing Aids, By Patient Type (USD Billion,2019-2035)

    • Adults
    • Pediatrics

    Colombia Hearing Aids, By Technology (USD Billion,2019-2035)

    • Analog
    • Digital

    Colombia Hearing Aids, By End-User (USD Billion,2019-2035)

    • Private Pay/Out of Pocket
    • Third Party Payer
    • Medicare/Medicaid

    Rest of South America Hearing Aids, By Product (USD Billion,2019-2035)

    • Hearing Aid Devices
      • Receiver-In-The-Ear (RITE) Hearing Aids
      • Behind-The-Ear (BTE) Hearing Aids
      • Canal Hearing Aids
      • In-The-Ear (ITE) Hearing Aids
      • Other
    • Hearing Implants
      • Cochlear Implants
      • Bone-Anchored Systems

    Rest of South America Hearing Aids, By Type of Hearing Loss (USD Billion,2019-2035)

    • Sensorineural Hearing Loss
    • Conductive Hearing Loss

    Rest of South America Hearing Aids, By Patient Type (USD Billion,2019-2035)

    • Adults
    • Pediatrics

    Rest of South America Hearing Aids, By Technology (USD Billion,2019-2035)

    • Analog
    • Digital

    Rest of South America Hearing Aids, By End-User (USD Billion,2019-2035)

    • Private Pay/Out of Pocket
    • Third Party Payer
    • Medicare/Medicaid

    Middle East & Africa Hearing Aids, By Product (USD Billion,2019-2035)

    • Hearing Aid Devices
      • Receiver-In-The-Ear (RITE) Hearing Aids
      • Behind-The-Ear (BTE) Hearing Aids
      • Canal Hearing Aids
      • In-The-Ear (ITE) Hearing Aids
      • Other
    • Hearing Implants
      • Cochlear Implants
      • Bone-Anchored Systems

    Middle East & Africa Hearing Aids, By Type of Hearing Loss (USD Billion,2019-2035)

    • Sensorineural Hearing Loss
    • Conductive Hearing Loss

    Middle East & Africa Hearing Aids, By Patient Type (USD Billion,2019-2035)

    • Adults
    • Pediatrics

    Middle East & Africa Hearing Aids, By Technology (USD Billion,2019-2035)

    • Analog
    • Digital

    Middle East & Africa Hearing Aids, By End-User (USD Billion,2019-2035)

    • Private Pay/Out of Pocket
    • Third Party Payer
    • Medicare/Medicaid

    South Africa Hearing Aids, By Product (USD Billion,2019-2035)

    • Hearing Aid Devices
      • Receiver-In-The-Ear (RITE) Hearing Aids
      • Behind-The-Ear (BTE) Hearing Aids
      • Canal Hearing Aids
      • In-The-Ear (ITE) Hearing Aids
      • Other
    • Hearing Implants
      • Cochlear Implants
      • Bone-Anchored Systems

    South Africa Hearing Aids, By Type of Hearing Loss (USD Billion,2019-2035)

    • Sensorineural Hearing Loss
    • Conductive Hearing Loss

    South Africa Hearing Aids, By Patient Type (USD Billion,2019-2035)

    • Adults
    • Pediatrics

    South Africa Hearing Aids, By Technology (USD Billion,2019-2035)

    • Analog
    • Digital

    South Africa Hearing Aids, By End-User (USD Billion,2019-2035)

    • Private Pay/Out of Pocket
    • Third Party Payer
    • Medicare/Medicaid

    GCC Countries Hearing Aids, By Product (USD Billion,2019-2035)

    • Hearing Aid Devices
      • Receiver-In-The-Ear (RITE) Hearing Aids
      • Behind-The-Ear (BTE) Hearing Aids
      • Canal Hearing Aids
      • In-The-Ear (ITE) Hearing Aids
      • Other
    • Hearing Implants
      • Cochlear Implants
      • Bone-Anchored Systems

    GCC Countries Hearing Aids, By Type of Hearing Loss (USD Billion,2019-2035)

    • Sensorineural Hearing Loss
    • Conductive Hearing Loss

    GCC Countries Hearing Aids, By Patient Type (USD Billion,2019-2035)

    • Adults
    • Pediatrics

    GCC Countries Hearing Aids, By Technology (USD Billion,2019-2035)

    • Analog
    • Digital

    GCC Countries Hearing Aids, By End-User (USD Billion,2019-2035)

    • Private Pay/Out of Pocket
    • Third Party Payer
    • Medicare/Medicaid

    Rest of Middle East & Africa Hearing Aids, By Product (USD Billion,2019-2035)

    • Hearing Aid Devices
      • Receiver-In-The-Ear (RITE) Hearing Aids
      • Behind-The-Ear (BTE) Hearing Aids
      • Canal Hearing Aids
      • In-The-Ear (ITE) Hearing Aids
      • Other
    • Hearing Implants
      • Cochlear Implants
      • Bone-Anchored Systems

    Rest of Middle East & Africa Hearing Aids, By Type of Hearing Loss (USD Billion,2019-2035)

    • Sensorineural Hearing Loss
    • Conductive Hearing Loss

    Rest of Middle East & Africa Hearing Aids, By Patient Type (USD Billion,2019-2035)

    • Adults
    • Pediatrics

    Rest of Middle East & Africa Hearing Aids, By Technology (USD Billion,2019-2035)

    • Analog
    • Digital

    Rest of Middle East & Africa Hearing Aids, By End-User (USD Billion,2019-2035)

    • Private Pay/Out of Pocket
    • Third Party Payer
    • Medicare/Medicaid
    Infographic

    Free Sample Request

    Kindly complete the form below to receive a free sample of this Report

    Get Free Sample

    Customer Strories

    “I am very pleased with how market segments have been defined in a relevant way for my purposes (such as "Portable Freezers & refrigerators" and "last-mile"). In general the report is well structured. Thanks very much for your efforts.”

    Victoria Milne

    Founder
    Case Study
    Chemicals and Materials