• Cat-intel
  • MedIntelliX
  • Resources
  • About Us
  • Hero Background
    English
    Chinese
    French
    Japanese
    Korean
    German
    Spanish

    IoT Sensor Market Size

    ID: MRFR/SEM/2990-HCR
    200 Pages
    Ankit Gupta
    October 2025

    IoT Sensor Market Size, Share & Industry Analysis: By Type (Proximity, Acoustic, Temperature, Pressure, Flow, Humidity, Inertial, Image, Motion, CO2, Gyroscope, Occupancy, Magnetometer), By Vertical (Consumers, Industrial, Commercial), And By Region (North America, Europe, Asia-Pacific, And Rest Of The World) – Forecast Till 2035

    Share:
    Download PDF ×

    We do not share your information with anyone. However, we may send you emails based on your report interest from time to time. You may contact us at any time to opt-out.

    IoT Sensor Market Infographic
    $ 4,950.0
    $ 5,950.0
    $ 7,250.0

    Iot Sensor Size

    IoT Sensor Market Growth Projections and Opportunities

    The market for Internet of Things (IoT) sensors is constantly changing, and different factors affecting it are all growing. One important consideration is the rising need for smart, connected devices across many industries. Now that industries and consumers are catching on to the advantages of IoT applications, gathering and transmitting data requires sensors. Sectors from healthcare to manufacturing, agriculture and transportation are all gearing up for the new wave with increased demand in each of them brought about by a desire to maximize efficiency through data gathered via sensors. Another powerful force in the market is ongoing improvements in sensor technology. As the capabilities of sensors are continually developing--becoming increasingly precise, consuming less power and offering more communications options--use phones spreading all around. As manufacturers and developers are constantly innovating, sensor solutions become increasingly sophisticated yet cheaper at the same time. These technological developments are becoming more widespread, stimulating the development of IoT sensor industry. This is an excellent investment opportunity for enterprises that want to stay ahead in their field. The significance of IoT to economic growth and increased efficiency is recognized by governments and regulatory bodies all over the world. Therefore they are developing policies and standards for the responsible, secure deployment of IoT equipment such as sensors. These regulations are becoming an important consideration for businesses, and whether they decide to introduce IoT sensor solutions depends on this factor. Another market force pushing forward the growth of IoT sensors is increasing demand for real-time data analytics. Companies are increasingly turning to data-based insights from which they can draw decision making advantage. The IoT sensors are a key element in collecting and transmitting real-time data to organizations, for which they can track changes in time and respond appropriately. Predictive maintenance in the industrial field, or health monitoring for sick people--in either case the ability to sense and analyze data all together has been a leading driver of this huge market. In addition, environmental sustainability and energy efficiency are becoming hot topics. This is affecting the use of IoT sensors to a certain extent as well. Industries strive to reduce their environmental impact and use resources systematically. They contribute in the form of smart energy management, effective waste disposal and environmentally friendly agriculture. With more businesses restructuring to conform with environmentally friendly habits, the need for environmental protection sensors is increasing ever further.

    IoT Sensor Market Size Graph

    Market Summary

    As per Market Research Future Analysis, the Global IoT Sensor Market was valued at USD 53.10 Billion in 2024 and is projected to reach USD 301.51 Billion by 2035, growing at a CAGR of 17.10% from 2025 to 2035. The market is driven by advancements in wireless IoT sensors and the integration of smart sensor systems. The pressure sensor segment is expected to dominate due to its applications in HVAC systems and industrial automation. The industrial sector will lead market growth, fueled by demand for IoT sensors in process control and predictive maintenance. The Asia Pacific region is anticipated to maintain its dominance, supported by high demand in countries like China and Japan.

    Key Market Trends & Highlights

    Key trends driving the IoT Sensor Market include technological advancements and increasing applications across various sectors.

    • IoT Sensor Market Size in 2024: USD 53.10 Billion Projected Market Size by 2035: USD 301.51 Billion CAGR from 2025 to 2035: 17.10% Dominant Segment: Pressure sensors due to HVAC and industrial applications

    Market Size & Forecast

    2024 Market Size USD 53.10 Billion
    2035 Market Size USD 301.51 Billion
    CAGR (2024-2035) 17.10%
    Dominant Region Asia Pacific

    Major Players

    <p>Major players include Texas Instruments, TE Connectivity, Bosch Sensortec, Honeywell, and Silicon Laboratories.</p>

    Market Trends

    Rising usage of sensors in IoT applications

    Microelectromechanical systems (MEMS) technology and the fast reduction in sensor size have led to the widespread use of sensors in consumer, medical, and automotive devices. This has significantly contributed to the expansion of the sensors market. Smaller sensors have been increasingly incorporated into gadgets like smartphones, drones, wearables, and robotics during the past five years.

    <p>The Global IoT Sensor Market is poised for robust growth as industries increasingly leverage interconnected devices to enhance operational efficiency and data-driven decision-making.</p>

    U.S. Department of Commerce

    IoT Sensor Market Market Drivers

    Market Growth Projections

    The Global IoT Sensor Market Industry is experiencing substantial growth, with projections indicating a market size of 53.1 USD Billion in 2024 and an anticipated increase to 241.3 USD Billion by 2035. This growth trajectory suggests a compound annual growth rate of 14.76% from 2025 to 2035, reflecting the increasing adoption of IoT technologies across various sectors. The expansion of smart devices, advancements in sensor technology, and supportive government initiatives are contributing factors to this upward trend. As industries continue to recognize the value of IoT solutions, the demand for sensors is expected to rise, driving the market forward.

    Emergence of 5G Technology

    The rollout of 5G technology is poised to have a transformative impact on the Global IoT Sensor Market Industry. With its promise of higher speeds, lower latency, and greater connectivity, 5G is expected to facilitate the deployment of a vast number of IoT devices and sensors. This enhanced connectivity will enable real-time data transmission and processing, which is crucial for applications such as autonomous vehicles, smart cities, and industrial automation. As 5G networks become more widespread, the demand for IoT sensors that can leverage these capabilities is likely to increase significantly, further propelling market growth in the coming years.

    Rising Demand for Smart Devices

    The increasing proliferation of smart devices across various sectors appears to be a primary driver for the Global IoT Sensor Market Industry. As consumers and businesses alike embrace smart technologies, the demand for sensors that facilitate connectivity and data collection is surging. In 2024, the market is projected to reach 53.1 USD Billion, reflecting a growing reliance on IoT solutions for enhanced efficiency and automation. This trend is particularly evident in smart homes, where devices such as smart thermostats and security systems utilize sensors to optimize performance and user experience. Consequently, the expansion of smart device adoption is likely to propel the growth of the IoT sensor market.

    Advancements in Sensor Technology

    Technological advancements in sensor capabilities are significantly influencing the Global IoT Sensor Market Industry. Innovations such as miniaturization, enhanced accuracy, and energy efficiency are enabling the development of more sophisticated sensors. For instance, the integration of artificial intelligence and machine learning into sensor systems allows for real-time data processing and predictive analytics. These advancements not only improve the functionality of IoT devices but also expand their applications across industries, including healthcare, agriculture, and manufacturing. As a result, the market is expected to experience robust growth, with projections indicating a rise to 241.3 USD Billion by 2035, driven by the continuous evolution of sensor technologies.

    Growing Focus on Energy Efficiency

    The increasing emphasis on energy efficiency and sustainability is driving the Global IoT Sensor Market Industry. Organizations are increasingly adopting IoT solutions to monitor and optimize energy consumption, thereby reducing operational costs and minimizing environmental impact. Sensors play a pivotal role in this transition by providing real-time data on energy usage, enabling businesses to make informed decisions. For instance, smart meters equipped with IoT sensors allow utilities to manage energy distribution more effectively. This growing focus on sustainability is likely to enhance the demand for IoT sensors, contributing to the market's expansion as businesses seek to align with global sustainability goals.

    Government Initiatives and Regulations

    Government initiatives aimed at promoting IoT adoption are playing a crucial role in shaping the Global IoT Sensor Market Industry. Various countries are implementing policies and regulations that encourage the integration of IoT solutions in sectors such as transportation, energy, and healthcare. For example, smart city initiatives are being launched globally, focusing on improving urban infrastructure through IoT technologies. These initiatives often include the deployment of sensors for traffic management, waste management, and environmental monitoring. The support from governments not only fosters innovation but also creates a conducive environment for market growth, potentially leading to a compound annual growth rate of 14.76% from 2025 to 2035.

    Market Segment Insights

    IoT Sensor Type Insights

    <p>The market segmentation, based on type, includes Proximity, Acoustic, Temperature, Pressure, Flow, Humidity, Inertial, Image, Motion, CO2, Gyroscope, Occupancy, and Magnetometer. The Pressure segment will dominate the market. <a href="https://www.marketresearchfuture.com/reports/pressure-sensors-market-6096">Pressure sensors</a> are widely used in a variety of applications such as HVAC systems, industrial automation, and consumer electronics. The increasing demand for these sensors in smart homes and building automation systems, along with their ability to provide real-time data, is expected to drive the growth of the pressure sensor segment in the market.</p>

    IoT Sensor Vertical Insights

    <p>Based on Vertical, the market segmentation includes Consumers, Industrial, and Commercial. The Industrial sector is anticipated to dominate the market over the forecast period. The increasing demand for IoT sensors in various <a href="https://www.marketresearchfuture.com/reports/industrial-control-system-security-market-2924">industrial</a> applications, such as process control, asset tracking, and predictive maintenance, is expected to drive the growth of the industrial segment.</p>

    <p>Source: Secondary Research, Primary Research, MRFR Database, and Analyst Review</p>

    Get more detailed insights about IoT Sensor Market Research Report- Global Forecast 2032

    Regional Insights

    By region, the study provides market insights into North America, Europe, Asia-Pacific, and the Rest of the World. The Asia Pacific region is a major player in the market and is expected to continue to dominate the market in the coming years. The region has a large number of manufacturers of IoT sensors and also a high demand for IoT solutions in countries such as China, South Korea, and Japan.

    The growth of the IoT industry in the Asia Pacific region is driven by factors such as the increasing adoption of connected devices, the growth of smart cities, and the increasing use of IoT sensors in various industries such as healthcare, manufacturing, and transportation.

    Figure 3:  IOT SENSOR MARKET SHARE BY REGION 2022 (%)IOT SENSOR MARKET SHARE BY REGION 2022

    Source: Secondary Research, Primary Research, MRFR Database, and Analyst Review

    Key Players and Competitive Insights

    The major market players are investing a lot of money in R&D to expand their product lines, which will spur further market growth. With significant market development such as new product releases, contractual agreements, mergers and acquisitions, increased investments, and collaboration with other organizations, market participants are also undertaking various strategic activities to expand their presence. To grow and thrive in a market climate that is becoming more competitive and growing, competitors in the IoT Sensor industry must offer affordable products.

    Manufacturing locally to cut operating costs is one of the main business tactics manufacturers use in the  IoT Sensor industry to benefit customers and expand the market sector. Major market players, including Texas Instruments, TE Connectivity, Bosch Sensortec, Honeywell, and others, are attempting to increase market demand by funding R&D initiatives.

    Texas Instruments (TI) creates, produces, tests, and sells analog and embedded processing chips. It is divided into two sections: analog and embedded processing. Power, signal chain, and high-volume product lines are all part of the Analog category. The Embedded Processing section includes microcontrollers, microcontrollers with integrated wireless capabilities, stand-alone wireless connection solutions, digital signal processors (DSPs), and applications processors.

    TE Connection is a manufacturer and seller of connectivity and sensor products. Its business is divided into three divisions: Transportation Solutions, Industrial Solutions, and Communications Solutions. The Transportation Solutions sector services the automotive, commercial transportation, and sensing markets by supplying terminals and connection systems and components, sensors, relays, antennas, application tools, and wire and heat shrink tubing. The Industrial Solutions category serves the aerospace, defense, oil & gas, industrial equipment, medical, and energy industries by providing solutions that connect and transfer power, data, and signals. The Communications Solutions division provides electronic components for the data, devices, and appliances industries.

    Key Companies in the IoT Sensor Market market include

    Industry Developments

    February 2024: OMAC, an influential industry association for machine automation and control, collaborated with ei3 to issue a publication titled “Wired for Success: Strategic Insights into the Deployment of Ethernet Networks in Manufacturing.” The guide will be unveiled at the highly respected 28th Annual ARC Industry Leadership Forum.

    January 2024: Honeywell and NXP Semiconductors N.V. combined their resources in January 2024 to enhance energy management in commercial buildings. Their partnership exclusively targets pressure sensing enhancement and guaranteed secured control.

    January 2024: Nozomi Networks launched in January 2024 its IoT security sensor called Guardian Air in Australia via a partnership with partners CyberCX and The Missing Link.

    July 2023: Bosch Sensortec and HopeRun Software signed a contract outlining their shared desire to cooperate and develop together. Sebastien Therond, Head of Business Strategy and Portfolio Management at Bosch Sensortec, and Liu Yang, Vice President of HopeRun, both attended the signing event. Through the launch of two development boards, the HH-SCDAYU200 and Neptune 100B, the partnership seeks to simplify the practical deployment of AIoT applications.

    June 2023: STMicroelectronics released the first MEMS pressure sensor that is waterproof for industrial IoT applications in June 2023. This was intended to have a lifespan of ten years, thus making it suitable for use in manufacturing.

    May 2023: STMicroelectronics introduced to the market this May 2023 the industry’s first ever water/liquid resistant absolute pressure MEMS sensor with its stated ten-year lifespan especially aimed towards industry use.

    April 2023: Texas Instruments developed SimpleLink series Wi-Fi 6 companion ICs (integrated circuits) as early as April 2023 to assist designers in implementing strong, secure, cost-effective Wi-Fi connections. These ICs are designed for applications requiring reliable performance under high-density or hot environments operating up to 105 degrees Celsius.

    March 2023: two new integrated circuit families, the xG27 family of Bluetooth systems on chips (SoCs) and the BB50 microcontroller unit (MCU), have been introduced by Silicon Labs, a pioneer in safe, intelligent wireless technology for a more connected world. These new families are intended for the lowest form factor IoT devices.

    February 2023: Qualcomm expanded its range of services in February 2023 so as to streamline and accelerate IoT implementation across industries. Qualcomm Aware is meant for excellence in asset management, particularly for assets that require precise timely decisions on critical matters. This involves combining cutting-edge silicon technology, an extensive developer-oriented cloud platform, and an ecosystem composed of hardware and software partners.

    February 2023: Henkel developed an innovative Sensor Experience Kit specifically for IoT development across various sectors during February 2023. Henkel Qhesive Solutions Sensor INKxperience Kit combines four separate printed electronics technologies together with pre-designed hardware and software, allowing for prototyping and conceptualizing engineering projects.

    January 2023: Texas Instruments announced a partnership with TDK to develop the world's first sensor module with embedded edge AI and wireless mesh networking, the i3 Micro Module.

    October 2022: For instance, in October 2022, Infineon Technologies AG unveiled its XENSIV connected sensor kit (CSK), the latest IoT sensor platform designed for fast prototyping and creation of IoT solutions tailored to specific needs.

    April 2022: Arm Limited introduced two new solutions - Arm Cortex-M85 and Cortex-A in April 2022 aimed at enhancing customer offerings. These product launches will attract new customers and add to the company’s revenue growth acceleration.

    Future Outlook

    IoT Sensor Market Future Outlook

    <p>The IoT Sensor Market is projected to grow at a 17.10% CAGR from 2025 to 2035, driven by advancements in connectivity, automation, and data analytics.</p>

    New opportunities lie in:

    • <p>Develop specialized sensors for smart agriculture to enhance yield and resource management.&nbsp;</p><p>Invest in AI-integrated sensors for predictive maintenance in manufacturing sectors.&nbsp;</p><p>Create IoT sensor solutions for urban infrastructure to improve smart city initiatives.</p>

    <p>By 2035, the IoT Sensor Market is expected to be a pivotal component of global technological infrastructure.</p>

    Market Segmentation

    IoT Sensor Type Outlook

    • Proximity
    • Acoustic
    • Temperature
    • Pressure
    • Flow
    • Humidity
    • Inertial
    • Image
    • Motion
    • CO2
    • Gyroscope
    • Occupancy
    • Magnetometer

    IoT Sensor Regional Outlook

    • {"North America"=>["US"
    • "Canada"]}
    • {"Europe"=>["Germany"
    • "France"
    • "UK"
    • "Italy"
    • "Spain"
    • "Rest of Europe"]}
    • {"Asia-Pacific"=>["China"
    • "Japan"
    • "India"
    • "Australia"
    • "South Korea"
    • "Rest of Asia-Pacific"]}
    • {"Rest of the World"=>["Middle East"
    • "Africa"
    • "Latin America"]}

    IoT Sensor Vertical Outlook

    • Consumers
    • Industrial
    • Commercial

    Report Scope

    Attribute/Metric Details
    Market Size 2024 USD 53.1 Billion
    Market Size 2035 301.51 (Value (USD Million))
    Compound Annual Growth Rate (CAGR) 17.10% (2025 - 2035)
    Base Year 2024
    Market Forecast Period 2025 - 2035
    Historical Data 2018 & 2022
    Market Forecast Units Value (USD Million)
    Report Coverage Revenue Forecast, Market Competitive Landscape, Growth Factors, and Trends
    Segments Covered Type, Vertical, and Region
    Geographies Covered North America, Europe, Asia Pacific, and Rest of the World
    Countries Covered The U.S, Canada, Germany, France, UK, Italy, Spain, China, Japan, India, Australia, South Korea, and Brazil
    Key Companies Profiled Texas Instruments, TE Connectivity, Silicon Laboratories, Libelium, Murata Manufacturing, General Electric, Monnit, Bosch Sensortec, Smart Things, Honeywell
    Key Market Opportunities The governments of many countries are supporting IoT innovations
    Key Market Dynamics Continuous Increase of sensors used in IoT-driven applications
    Market Size 2025 62.18 (Value (USD Million))

    Market Highlights

    Author

    Ankit Gupta
    Senior Research Analyst

    She holds an experience of about 6+ years in market research and business consulting, working under the spectrum of information communication technology, telecommunications and semiconductor domains. aarti conceptualizes and implements a scalable business strategy and provides strategic leadership to the clients. her expertise lies in market estimation, competitive intelligence, pipeline analysis, customer assessment, etc.

    Leave a Comment

    Latest Comments

    John Doe
    john@example.com

    This is a great article! Really helped me understand the topic better.

    Posted on July 23, 2025, 10:15 AM
    Jane Smith
    jane@domain.com

    Thanks for sharing this. I’ve bookmarked it for later reference.

    Posted on July 22, 2025, 7:45 PM

    FAQs

    How much is the IoT Sensor market?

    The IoT Sensor market size was valued at USD 51.6 Billion in 2023.

    What is the growth rate of the IoT Sensor market?

    The market is projected to grow at a CAGR of 17.10% during the forecast period, 2024-2032.

    Which region held the largest market share in the market of IoT Sensor?

    Asia Pacific had the largest share of the IoT Sensor market.

    Who are the key players in the IoT Sensors market?

    The key players in the market are Texas Instruments, TE Connectivity, Silicon Laboratories, Libelium, Murata Manufacturing, General Electric, Monnit, Bosch Sensortec, Smart Things, and Honeywell.

    Which type led the market of IoT Sensor?

    The Pressure category dominated the market in 2023.

    Which Vertical had the largest market share in the market?

    Industrial had the largest share in the global market for IoT sensors.

    1. --- "Table of Contents
    2. Market Introduction
      1. INTRODUCTION
      2. SCOPE OF STUDY
        1. RESEARCH OBJECTIVE
        2. ASSUMPTIONS
        3. LIMITATIONS
      3. MARKET STRUCTURE
    3. Research Methodology
      1. RESEARCH TYPE
      2. PRIMARY RESEARCH
      3. SECONDARY RESEARCH
      4. FORECAST MODEL
        1. MARKET DATA COLLECTION, ANALYSIS & FORECAST
        2. MARKET SIZE ESTIMATION
    4. MARKET DYNAMICS
      1. INTRODUCTION
      2. MARKET DRIVERS
      3. MARKET CHALLENGES
      4. MARKET OPPORTUNITIES
      5. MARKET RESTRAINTS
    5. Executive Summary
    6. MARKET FACTOR ANALYSIS
      1. PORTER’S FIVE FORCES ANALYSIS
      2. SUPPLY CHAIN ANALYSIS
    7. IOT SENSOR MARKET, BY SEGMENTS
      1. INTRODUCTION
      2. MARKET STATISTICS
        1. BY COMPONENT
        2. BY TYPE
        3. BY NETWORK TECHNOLOGY
        4. BY VERTICAL
        5. BY REGION
    8. COMPETITIVE ANALYSIS
      1. MARKET SHARE ANALYSIS
      2. COMPANY PROFILES
        1. TEXAS INSTRUMENTS INCORPORATED (U.S.)
        2. STMICROELECTRONICS N.V. (SWITZERLAND)
        3. TE CONNECTIVITY LTD. (U.S.)
        4. INFINEON TECHNOLOGIES AG (GERMANY)
        5. ANALOG DEVICES, INC. (U.S.)
        6. BROADCOM LIMITED (U.S.)
        7. ROBERT BOSCH GMBH (GERMANY)
        8. JOHNSON CONTROLS INTERNATIONAL PLC (IRELAND)
        9. SONY CORPORATION (JAPAN)
        10. HONEYWELL INTERNATIONAL, INC. (U.S.)
        11. OTHERS
    9. List of Tables and Figures
      1. LIST OF TABLES
      2. TABLE 1 IOT SENSOR MARKET, BY COMPONENT
      3. TABLE 2 IOT SENSOR MARKET, BY TYPE
      4. TABLE 3 IOT SENSOR MARKET, BY NETWORK TECHNOLOGY
      5. TABLE 4 IOT SENSOR MARKET, BY VERTICAL
      6. TABLE 5 IOT SENSOR MARKET, BY REGIONS
      7. TABLE 6 NORTH AMERICA IOT SENSOR MARKET, BY COMPONENT
      8. TABLE 7 NORTH AMERICA IOT SENSOR MARKET, BY TYPE
      9. TABLE 8 NORTH AMERICA IOT SENSOR MARKET, BY NETWORK TECHNOLOGY
      10. TABLE 9 NORTH AMERICA IOT SENSOR MARKET, BY VERTICAL
      11. TABLE 10 U.S. IOT SENSOR MARKET, BY COMPONENT
      12. TABLE 11 U.S. IOT SENSOR MARKET, BY TYPE
      13. TABLE 12 U.S. IOT SENSOR MARKET, BY NETWORK TECHNOLOGY
      14. TABLE 13 U.S. IOT SENSOR MARKET, BY VERTICAL
      15. TABLE 14 CANADA IOT SENSOR MARKET, BY COMPONENT
      16. TABLE 15 CANADA IOT SENSOR MARKET, BY TYPE
      17. TABLE 16 CANADA IOT SENSOR MARKET, BY NETWORK TECHNOLOGY
      18. TABLE 17 CANADA IOT SENSOR MARKET, BY VERTICAL
      19. TABLE 18 EUROPE IOT SENSOR MARKET, BY COMPONENT
      20. TABLE 19 EUROPE IOT SENSOR MARKET, BY TYPE
      21. TABLE 20 EUROPE IOT SENSOR MARKET, BY NETWORK TECHNOLOGY
      22. TABLE 21 EUROPE IOT SENSOR MARKET, BY VERTICAL
      23. TABLE 22 U.K. IOT SENSOR MARKET, BY COMPONENT
      24. TABLE 23 U.K. IOT SENSOR MARKET, BY TYPE
      25. TABLE 24 U.K. IOT SENSOR MARKET, BY NETWORK TECHNOLOGY
      26. TABLE 25 U.K. IOT SENSOR MARKET, BY VERTICAL
      27. TABLE 26 GERMANY IOT SENSOR MARKET, BY COMPONENT
      28. TABLE 27 GERMANY IOT SENSOR MARKET, BY TYPE
      29. TABLE 28 GERMANY IOT SENSOR MARKET, BY NETWORK TECHNOLOGY
      30. TABLE 29 GERMANY IOT SENSOR MARKET, BY VERTICAL
      31. TABLE 30 FRANCE IOT SENSOR MARKET, BY COMPONENT
      32. TABLE 31 FRANCE IOT SENSOR MARKET, BY TYPE
      33. TABLE 32 FRANCE IOT SENSOR MARKET, BY NETWORK TECHNOLOGY
      34. TABLE 33 FRANCE IOT SENSOR MARKET, BY VERTICAL
      35. TABLE 34 ITALY IOT SENSOR MARKET, BY COMPONENT
      36. TABLE 35 ITALY IOT SENSOR MARKET, BY TYPE
      37. TABLE 36 ITALY IOT SENSOR MARKET, BY NETWORK TECHNOLOGY
      38. TABLE 37 ITALY IOT SENSOR MARKET, BY VERTICAL
      39. TABLE 38 REST OF EUROPE IOT SENSOR MARKET, BY COMPONENT
      40. TABLE 39 REST OF EUROPE IOT SENSOR MARKET, BY TYPE
      41. TABLE 40 REST OF EUROPE IOT SENSOR MARKET, BY NETWORK TECHNOLOGY
      42. TABLE 41 REST OF EUROPE IOT SENSOR MARKET, BY VERTICAL
      43. TABLE 42 ASIA-PACIFIC IOT SENSOR MARKET, BY COMPONENT
      44. TABLE 43 ASIA-PACIFIC IOT SENSOR MARKET, BY TYPE
      45. TABLE 44 ASIA-PACIFIC IOT SENSOR MARKET, BY NETWORK TECHNOLOGY
      46. TABLE 45 ASIA-PACIFIC IOT SENSOR MARKET, BY VERTICAL
      47. TABLE 46 CHINA IOT SENSOR MARKET, BY COMPONENT
      48. TABLE 47 CHINA IOT SENSOR MARKET, BY TYPE
      49. TABLE 48 CHINA IOT SENSOR MARKET, BY NETWORK TECHNOLOGY
      50. TABLE 49 CHINA IOT SENSOR MARKET, BY VERTICAL
      51. TABLE 50 JAPAN IOT SENSOR MARKET, BY COMPONENT
      52. TABLE 51 JAPAN IOT SENSOR MARKET, BY TYPE
      53. TABLE 52 JAPAN IOT SENSOR MARKET, BY NETWORK TECHNOLOGY
      54. TABLE 53 JAPAN IOT SENSOR MARKET, BY VERTICAL
      55. TABLE 54 SOUTH KOREA IOT SENSOR MARKET, BY COMPONENT
      56. TABLE 55 SOUTH KOREA IOT SENSOR MARKET, BY TYPE
      57. TABLE 56 SOUTH KOREA IOT SENSOR MARKET, BY NETWORK TECHNOLOGY
      58. TABLE 57 SOUTH KOREA IOT SENSOR MARKET, BY VERTICAL
      59. TABLE 58 INDIA IOT SENSOR MARKET, BY COMPONENT
      60. TABLE 59 INDIA IOT SENSOR MARKET, BY TYPE
      61. TABLE 60 INDIA IOT SENSOR MARKET, BY NETWORK TECHNOLOGY
      62. TABLE 61 INDIA IOT SENSOR MARKET, BY VERTICAL
      63. TABLE 62 REST OF ASIA-PACIFIC IOT SENSOR MARKET, BY COMPONENT
      64. TABLE 63 REST OF ASIA-PACIFIC IOT SENSOR MARKET, BY TYPE
      65. TABLE 64 REST OF ASIA-PACIFIC IOT SENSOR MARKET, BY NETWORK TECHNOLOGY
      66. TABLE 65 REST OF ASIA-PACIFIC IOT SENSOR MARKET, BY VERTICAL
      67. TABLE 66 REST OF THE WORLD IOT SENSOR MARKET, BY COMPONENT
      68. TABLE 67 REST OF THE WORLD IOT SENSOR MARKET, BY TYPE
      69. TABLE 68 REST OF THE WORLD IOT SENSOR MARKET, BY NETWORK TECHNOLOGY
      70. TABLE 69 REST OF THE WORLD IOT SENSOR MARKET, BY VERTICAL   LIST OF FIGURES
      71. FIGURE 1 RESEARCH TYPE
      72. FIGURE 1 IOT SENSOR MARKET, BY COMPONENT (%)
      73. FIGURE 2 IOT SENSOR MARKET, BY TYPE (%)
      74. FIGURE 3 IOT SENSOR MARKET, BY NETWORK TECHNOLOGY (%)
      75. FIGURE 4 IOT SENSOR MARKET, BY VERTICAL (%)
      76. FIGURE 5 
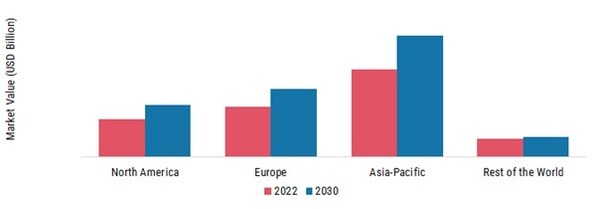
IOT SENSOR MARKET, BY REGIONS (%)
      77. FIGURE 6 NORTH AMERICA IOT SENSOR MARKET, BY COMPONENT (%)
      78. FIGURE 7 NORTH AMERICA IOT SENSOR MARKET, BY TYPE (%)
      79. FIGURE 8 NORTH AMERICA IOT SENSOR MARKET, BY NETWORK TECHNOLOGY (%)
      80. FIGURE 9 NORTH AMERICA IOT SENSOR MARKET, BY VERTICAL (%)
      81. FIGURE 10 U.S. IOT SENSOR MARKET, BY COMPONENT (%)
      82. FIGURE 11 U.S. IOT SENSOR MARKET, BY TYPE (%)
      83. FIGURE 12 U.S. IOT SENSOR MARKET, BY NETWORK TECHNOLOGY (%)
      84. FIGURE 13 U.S. IOT SENSOR MARKET, BY VERTICAL (%)
      85. FIGURE 14 CANADA IOT SENSOR MARKET, BY COMPONENT (%)
      86. FIGURE 15 CANADA IOT SENSOR MARKET, BY TYPE (%)
      87. FIGURE 16 CANADA IOT SENSOR MARKET, BY NETWORK TECHNOLOGY (%)
      88. FIGURE 17 CANADA IOT SENSOR MARKET, BY VERTICAL (%)
      89. FIGURE 18 EUROPE IOT SENSOR MARKET, BY COMPONENT (%)
      90. FIGURE 19 EUROPE IOT SENSOR MARKET, BY TYPE (%)
      91. FIGURE 20 EUROPE IOT SENSOR MARKET, BY NETWORK TECHNOLOGY (%)
      92. FIGURE 21 EUROPE IOT SENSOR MARKET, BY VERTICAL (%)
      93. FIGURE 22 U.K. IOT SENSOR MARKET, BY COMPONENT (%)
      94. FIGURE 23 U.K. IOT SENSOR MARKET, BY TYPE (%)
      95. FIGURE 24 U.K. IOT SENSOR MARKET, BY NETWORK TECHNOLOGY (%)
      96. FIGURE 25 U.K. IOT SENSOR MARKET, BY VERTICAL (%)
      97. FIGURE 26 GERMANY IOT SENSOR MARKET, BY COMPONENT (%)
      98. FIGURE 27 GERMANY IOT SENSOR MARKET, BY TYPE (%)
      99. FIGURE 28 GERMANY IOT SENSOR MARKET, BY NETWORK TECHNOLOGY (%)
      100. FIGURE 29 GERMANY IOT SENSOR MARKET, BY VERTICAL (%)
      101. FIGURE 30 FRANCE IOT SENSOR MARKET, BY COMPONENT (%)
      102. FIGURE 31 FRANCE IOT SENSOR MARKET, BY TYPE (%)
      103. FIGURE 32 FRANCE IOT SENSOR MARKET, BY NETWORK TECHNOLOGY (%)
      104. FIGURE 33 FRANCE IOT SENSOR MARKET, BY VERTICAL (%)
      105. FIGURE 34 ITALY IOT SENSOR MARKET, BY COMPONENT (%)
      106. FIGURE 35 ITALY IOT SENSOR MARKET, BY TYPE (%)
      107. FIGURE 36 ITALY IOT SENSOR MARKET, BY NETWORK TECHNOLOGY (%)
      108. FIGURE 37 ITALY IOT SENSOR MARKET, BY VERTICAL (%)
      109. FIGURE 38 REST OF EUROPE IOT SENSOR MARKET, BY COMPONENT (%)
      110. FIGURE 39 REST OF EUROPE IOT SENSOR MARKET, BY TYPE (%)
      111. FIGURE 40 REST OF EUROPE IOT SENSOR MARKET, BY NETWORK TECHNOLOGY (%)
      112. FIGURE 41 REST OF EUROPE IOT SENSOR MARKET, BY VERTICAL (%)
      113. FIGURE 42 ASIA-PACIFIC IOT SENSOR MARKET, BY COMPONENT (%)
      114. FIGURE 43 ASIA-PACIFIC IOT SENSOR MARKET, BY TYPE (%)
      115. FIGURE 44 ASIA-PACIFIC IOT SENSOR MARKET, BY NETWORK TECHNOLOGY (%)
      116. FIGURE 45 ASIA-PACIFIC IOT SENSOR MARKET, BY VERTICAL (%)
      117. FIGURE 46 CHINA IOT SENSOR MARKET, BY COMPONENT (%)
      118. FIGURE 47 CHINA IOT SENSOR MARKET, BY TYPE (%)
      119. FIGURE 48 CHINA IOT SENSOR MARKET, BY NETWORK TECHNOLOGY (%)
      120. FIGURE 49 CHINA IOT SENSOR MARKET, BY VERTICAL (%)
      121. FIGURE 50 JAPAN IOT SENSOR MARKET, BY COMPONENT (%)
      122. FIGURE 51 JAPAN IOT SENSOR MARKET, BY TYPE (%)
      123. FIGURE 52 JAPAN IOT SENSOR MARKET, BY NETWORK TECHNOLOGY (%)
      124. FIGURE 53 JAPAN IOT SENSOR MARKET, BY VERTICAL (%)
      125. FIGURE 54 SOUTH KOREA IOT SENSOR MARKET, BY COMPONENT (%)
      126. FIGURE 55 SOUTH KOREA IOT SENSOR MARKET, BY TYPE (%)
      127. FIGURE 56 SOUTH KOREA IOT SENSOR MARKET, BY NETWORK TECHNOLOGY (%)
      128. FIGURE 57 SOUTH KOREA IOT SENSOR MARKET, BY VERTICAL (%)
      129. FIGURE 58 INDIA IOT SENSOR MARKET, BY COMPONENT (%)
      130. FIGURE 59 INDIA IOT SENSOR MARKET, BY TYPE (%)
      131. FIGURE 60 INDIA IOT SENSOR MARKET, BY NETWORK TECHNOLOGY (%)
      132. FIGURE 61 INDIA IOT SENSOR MARKET, BY VERTICAL (%)
      133. FIGURE 62 REST OF ASIA-PACIFIC IOT SENSOR MARKET, BY COMPONENT (%)
      134. FIGURE 63 REST OF ASIA-PACIFIC IOT SENSOR MARKET, BY TYPE (%)
      135. FIGURE 64 REST OF ASIA-PACIFIC IOT SENSOR MARKET, BY NETWORK TECHNOLOGY (%)
      136. FIGURE 65 REST OF ASIA-PACIFIC IOT SENSOR MARKET, BY VERTICAL (%)
      137. FIGURE 66 REST OF THE WORLD IOT SENSOR MARKET, BY COMPONENT (%)
      138. FIGURE 67 REST OF THE WORLD IOT SENSOR MARKET, BY TYPE (%)
      139. FIGURE 68 REST OF THE WORLD IOT SENSOR MARKET, BY NETWORK TECHNOLOGY (%)
      140. FIGURE 69 REST OF THE WORLD IOT SENSOR MARKET, BY VERTICAL (%)"

    IoT Sensor Market Segmentation

    IoT Sensor Type Outlook (USD Million, 2018-2032)

    Proximity

    Acoustic

    Temperature

    Pressure

    Flow

    Humidity

    Inertial

    Image

    Motion

    CO2

    Gyroscope

    Occupancy

    Magnetometer

    IoT Sensor Vertical Outlook (USD Million, 2018-2032)

    Consumers

    Industrial

    Commercial

    IoT Sensor Regional Outlook (USD Million, 2018-2032)

    North America Outlook (USD Million, 2018-2032)

    North America IoT Sensor by Type

    Proximity

    Acoustic

    Temperature

    Pressure

    Flow

    Humidity

    Inertial

    Image

    Motion

    CO2

    Gyroscope

    Occupancy

    Magnetometer

    North America IoT Sensor by Vertical

    Consumers

    Industrial

    Commercial

    US Outlook (USD Million, 2018-2032)

    US IoT Sensor by Type

    Proximity

    Acoustic

    Temperature

    Pressure

    Flow

    Humidity

    Inertial

    Image

    Motion

    CO2

    Gyroscope

    Occupancy

    Magnetometer

    US IoT Sensor by Vertical

    Consumers

    Industrial

    Commercial

    CANADA Outlook (USD Million, 2018-2032)

    CANADA IoT Sensor by Type

    Proximity

    Acoustic

    Temperature

    Pressure

    Flow

    Humidity

    Inertial

    Image

    Motion

    CO2

    Gyroscope

    Occupancy

    Magnetometer

    CANADA IoT Sensor by Vertical

    Consumers

    Industrial

    Commercial

    Europe Outlook (USD Million, 2018-2032)

    Europe IoT Sensor by Type

    Proximity

    Acoustic

    Temperature

    Pressure

    Flow

    Humidity

    Inertial

    Image

    Motion

    CO2

    Gyroscope

    Occupancy

    Magnetometer

    Europe IoT Sensor by Vertical

    Consumers

    Industrial

    Commercial

    Germany Outlook (USD Million, 2018-2032)

    Germany IoT Sensor by Type

    Proximity

    Acoustic

    Temperature

    Pressure

    Flow

    Humidity

    Inertial

    Image

    Motion

    CO2

    Gyroscope

    Occupancy

    Magnetometer

    Germany IoT Sensor by Vertical

    Consumers

    Industrial

    Commercial

    France Outlook (USD Million, 2018-2032)

    France IoT Sensor by Type

    Proximity

    Acoustic

    Temperature

    Pressure

    Flow

    Humidity

    Inertial

    Image

    Motion

    CO2

    Gyroscope

    Occupancy

    Magnetometer

    France IoT Sensor by Vertical

    Consumers

    Industrial

    Commercial

    UK Outlook (USD Million, 2018-2032)

    UK IoT Sensor by Type

    Proximity

    Acoustic

    Temperature

    Pressure

    Flow

    Humidity

    Inertial

    Image

    Motion

    CO2

    Gyroscope

    Occupancy

    Magnetometer

    UK IoT Sensor by Vertical

    Consumers

    Industrial

    Commercial

    ITALY Outlook (USD Million, 2018-2032)

    ITALY IoT Sensor by Type

    Proximity

    Acoustic

    Temperature

    Pressure

    Flow

    Humidity

    Inertial

    Image

    Motion

    CO2

    Gyroscope

    Occupancy

    Magnetometer

    ITALY IoT Sensor by Vertical

    Consumers

    Industrial

    Commercial

    SPAIN Outlook (USD Million, 2018-2032)

    Spain IoT Sensor by Type

    Proximity

    Acoustic

    Temperature

    Pressure

    Flow

    Humidity

    Inertial

    Image

    Motion

    CO2

    Gyroscope

    Occupancy

    Magnetometer

    Spain IoT Sensor by Vertical

    Consumers

    Industrial

    Commercial

    Rest Of Europe Outlook (USD Million, 2018-2032)

    REST OF EUROPE IoT Sensor by Type

    Proximity

    Acoustic

    Temperature

    Pressure

    Flow

    Humidity

    Inertial

    Image

    Motion

    CO2

    Gyroscope

    Occupancy

    Magnetometer

    REST OF EUROPE IoT Sensor by Vertical

    Consumers

    Industrial

    Commercial

    Asia-Pacific Outlook (USD Million, 2018-2032)

    Asia-Pacific IoT Sensor by Type

    Proximity

    Acoustic

    Temperature

    Pressure

    Flow

    Humidity

    Inertial

    Image

    Motion

    CO2

    Gyroscope

    Occupancy

    Magnetometer

    Asia-Pacific IoT Sensor by Vertical

    Consumers

    Industrial

    Commercial

    China Outlook (USD Million, 2018-2032)

    China IoT Sensor by Type

    Proximity

    Acoustic

    Temperature

    Pressure

    Flow

    Humidity

    Inertial

    Image

    Motion

    CO2

    Gyroscope

    Occupancy

    Magnetometer

    China IoT Sensor by Vertical

    Consumers

    Industrial

    Commercial

    Japan Outlook (USD Million, 2018-2032)

    Japan IoT Sensor by Type

    Proximity

    Acoustic

    Temperature

    Pressure

    Flow

    Humidity

    Inertial

    Image

    Motion

    CO2

    Gyroscope

    Occupancy

    Magnetometer

    Japan IoT Sensor by Vertical

    Consumers

    Industrial

    Commercial

    India Outlook (USD Million, 2018-2032)

    India IoT Sensor by Type

    Proximity

    Acoustic

    Temperature

    Pressure

    Flow

    Humidity

    Inertial

    Image

    Motion

    CO2

    Gyroscope

    Occupancy

    Magnetometer

    India IoT Sensor by Vertical

    Consumers

    Industrial

    Commercial

    Australia Outlook (USD Million, 2018-2032)

    Australia IoT Sensor by Type

    Proximity

    Acoustic

    Temperature

    Pressure

    Flow

    Humidity

    Inertial

    Image

    Motion

    CO2

    Gyroscope

    Occupancy

    Magnetometer

    Australia IoT Sensor by Vertical

    Consumers

    Industrial

    Commercial

    Rest of Asia-Pacific Outlook (USD Million, 2018-2032)

    Rest of Asia-Pacific IoT Sensor by Type

    Proximity

    Acoustic

    Temperature

    Pressure

    Flow

    Humidity

    Inertial

    Image

    Motion

    CO2

    Gyroscope

    Occupancy

    Magnetometer

    Rest of Asia-Pacific IoT Sensor by Vertical

    Consumers

    Industrial

    Commercial

    Rest of the World Outlook (USD Million, 2018-2032)

    Rest of the World IoT Sensor by Type

    Proximity

    Acoustic

    Temperature

    Pressure

    Flow

    Humidity

    Inertial

    Image

    Motion

    CO2

    Gyroscope

    Occupancy

    Magnetometer

    Rest of the World IoT Sensor by Vertical

    Consumers

    Industrial

    Commercial

    Middle East Outlook (USD Million, 2018-2032)

    Middle East IoT Sensor by Type

    Proximity

    Acoustic

    Temperature

    Pressure

    Flow

    Humidity

    Inertial

    Image

    Motion

    CO2

    Gyroscope

    Occupancy

    Magnetometer

    Middle East IoT Sensor by Vertical

    Consumers

    Industrial

    Commercial

    Africa Outlook (USD Million, 2018-2032)

    Africa IoT Sensor by Type

    Proximity

    Acoustic

    Temperature

    Pressure

    Flow

    Humidity

    Inertial

    Image

    Motion

    CO2

    Gyroscope

    Occupancy

    Magnetometer

    Africa IoT Sensor by Vertical

    Consumers

    Industrial

    Commercial

    Latin America Outlook (USD Million, 2018-2032)

    Latin America IoT Sensor by Type

    Proximity

    Acoustic

    Temperature

    Pressure

    Flow

    Humidity

    Inertial

    Image

    Motion

    CO2

    Gyroscope

    Occupancy

    Magnetometer

    Latin America IoT Sensor by Vertical

    Consumers

    Industrial

    Commercial

    Infographic

    Free Sample Request

    Kindly complete the form below to receive a free sample of this Report

    Get Free Sample

    Customer Strories

    “I am very pleased with how market segments have been defined in a relevant way for my purposes (such as "Portable Freezers & refrigerators" and "last-mile"). In general the report is well structured. Thanks very much for your efforts.”

    Victoria Milne

    Founder
    Case Study
    Chemicals and Materials