• Cat-intel
  • MedIntelliX
  • Resources
  • About Us
  • Hero Background
    English
    Chinese
    French
    Japanese
    Korean
    German
    Spanish

    Oil Gas Sensors Market Size

    ID: MRFR/E&P/5500-HCR
    188 Pages
    Chitranshi Jaiswal
    October 2025

    Oil & Gas Sensors Market Research Report By Type (Pressure Sensors, Temperature Sensors, Flow Sensors, Level Sensors, Chemical Sensors), By Application (Upstream, Midstream, Downstream, Refining, Processing), By Technology (Wireless Sensors, Wired Sensors, Smart Sensors, Optical Sensors), By End Use (Onshore, Offshore) and  By Regional (North America, Europe, South America, Asia Pacifi...

    Share:
    Download PDF ×

    We do not share your information with anyone. However, we may send you emails based on your report interest from time to time. You may contact us at any time to opt-out.

    Oil Gas Sensors Market Infographic
    $ 4,950.0
    $ 5,950.0
    $ 7,250.0

    Oil Gas Sensors Size

    Oil Gas Sensors Market Growth Projections and Opportunities

    The oil and gas industry has been experiencing a paradigm shift in recent years primarily because of advancements in the sensing technology. In general, demand for energy, technological developments and regulatory aspects are some of the factors that have shaped market dynamics of oil and gas sensors. The necessity of these sensors is to ensure operations within the oil and gas sector remain safe as well as efficient and sustainable. One main driver of the sensors market for oil and gas is increasing global energy demand. As the world population increases so does the demand for petroleum products needed to run industries, vehicles or homes. Consequently, advanced sensor technologies have been adopted by oil and gas companies to optimize production processes, monitor equipment health and improve operational efficiency at large due to rising demands. Technological advancements have equally contributed towards shaping market dynamics in oil and gas sensors. These include smart sensor development; internet of things (IoT) integration, where these devices capture real-time data from remote areas on various process variables such as temperature on refinery columns; atomization of data analytics among others. These types of improvements lead to more accurate data which can be used for predictive maintenance hence reducing downtime associated with process failures. Furthermore stringent regulation requirements have necessitated use of sensors in the oil and gas sector. Governments globally impose tough rules aimed at ensuring safety as well as environmental protection in this industry. Consequently, investments into sensor technologies are made by industries mainly to watch out emissions, detect leaks plus complying with set regulations thereby mitigating environmental risks while keeping their social licenses intact. Additionally, asset integrity focus also affects market dynamics relating to oil and gas sensors’ since there is an increased emphasis on worker safety within this field. This technique helps avoid unnecessary accidents arising from pipeline bursts among other related activities which eventually safeguard workers lives. Moreover, the adoption of digitalization strategies in the oil and gas industry also drives the sensors market growth. The incorporation of sensor technology with digital platforms enables real-time data analysis, remote monitoring and decision-making. This transformation in this sector improves both efficiency and resource management that helps to achieve cost optimization.

    Oil Gas Sensors Market Size Graph

    Market Summary

    As per Market Research Future Analysis, the Oil & Gas Sensors Market was valued at 12.52 USD Billion in 2022 and is projected to grow from 13.15 USD Billion in 2023 to 20.5 USD Billion by 2032, reflecting a CAGR of 5.05% during the forecast period. The market is driven by the increasing demand for safety, real-time monitoring, and compliance with environmental regulations. Technological advancements, including IoT integration, are enhancing operational efficiency and predictive maintenance capabilities, while the shift towards renewable energy sources is expanding market opportunities.

    Key Market Trends & Highlights

    Key trends driving the Oil & Gas Sensors Market include advancements in technology and regulatory compliance.

    • The market is expected to reach 20.5 USD Billion by 2032, growing from 13.15 USD Billion in 2023.
    • Pressure Sensors are projected to grow from 3.15 USD Billion in 2023 to 5.0 USD Billion by 2032.
    • Temperature Sensors are anticipated to rise from 2.75 USD Billion in 2023 to 4.25 USD Billion by 2032.
    • Wireless Sensors are gaining traction due to their ability to facilitate real-time data transmission.

    Market Size & Forecast

    2022 Market Size USD 12.52 Billion
    2023 Market Size USD 13.15 Billion
    2032 Market Size USD 20.5 Billion
    CAGR (2024-2032) 5.05%
    Largest Regional Market Share in 2023 North America.

    Major Players

    Key players include General Electric, Teledyne Technologies, Siemens, National Instruments, Bosch, ABB, Honeywell, Endress+Hauser, Emerson Electric, Yokogawa Electric, Rockwell Automation, Krohne, Texas Instruments, Ventus Technologies, Schneider Electric.

    Market Trends

    The increasing necessity of safety and productivity has become the principal factor fueling the growth of the Oil and Gas Sensors Market. The oil and gas sensors market is significantly fueled by the growing demand for real-time monitoring and data analysis that optimizes operational processes. Furthermore, due to the strict policies related to emissions and environmental pollution, businesses are compelled to upgrade their sensor systems. Therefore, the growing need for safety and compliance gives a strong motivation for the growth of the market.

    It is also seen that the oil and gas sensors market can also be captured through the use of IoT and smart technology.

    With these improvements come increased overall operational efficiency, predictive maintenance capabilities, and remote monitoring capabilities. Companies in those markets will be looking for ways to enhance sensor adoption to boost their targets, enhance business performance, and decrease costs. Moreover, the trend of changing energy consumption practices offers many opportunities for sensor manufacturers as sensors from their products will be designed for renewable energy uses which expands their market range. Current patterns indicate a growing commitment to digitization across the oil and gas industry.

    To boost processes, automation and sophisticated analytics are being utilized which results in the higher penetration of advanced integrated sensors.

    All in all, these trends, as well as technologies, will more or less drive the Oil & Gas Sensors Market in the coming decades.

    The ongoing transition towards digitalization and automation in the oil and gas sector appears to be driving a heightened demand for advanced sensor technologies, which are increasingly recognized as critical for enhancing operational efficiency and safety.

    U.S. Department of Energy

    Oil Gas Sensors Market Market Drivers

    Market Growth Charts Only

    Market Growth Projections

    The Global Oil and Gas Sensors Market Industry is poised for substantial growth, with projections indicating a market value of 13.7 USD Billion in 2024 and an anticipated increase to 23.8 USD Billion by 2035. This growth trajectory suggests a robust demand for sensor technologies driven by various factors, including safety regulations, technological advancements, and environmental sustainability. The compound annual growth rate of 5.16% from 2025 to 2035 further underscores the market's potential. As the industry evolves, stakeholders are likely to invest in innovative sensor solutions that enhance operational efficiency and safety, thereby contributing to the overall growth of the market.

    Focus on Environmental Sustainability

    Environmental sustainability has emerged as a crucial driver for the Global Oil and Gas Sensors Market Industry. Companies are increasingly adopting sensor technologies to monitor emissions, manage waste, and ensure compliance with environmental standards. The push for greener operations compels organizations to invest in sensors that provide real-time data on environmental impact. For instance, sensors that detect gas leaks or monitor water quality are becoming essential tools in minimizing ecological footprints. This growing emphasis on sustainability not only enhances corporate responsibility but also aligns with global efforts to combat climate change, thereby propelling market growth.

    Increasing Demand for Safety and Compliance

    The Global Oil and Gas Sensors Market Industry experiences a heightened demand for safety and compliance measures. Regulatory bodies worldwide enforce stringent safety protocols to mitigate risks associated with oil and gas operations. This regulatory landscape compels companies to invest in advanced sensor technologies that monitor environmental conditions, detect leaks, and ensure operational safety. For instance, the implementation of real-time monitoring systems has become essential in preventing accidents and ensuring compliance with environmental regulations. As a result, the market is projected to reach 13.7 USD Billion in 2024, reflecting the industry's commitment to safety and compliance.

    Rising Exploration and Production Activities

    The Global Oil and Gas Sensors Market Industry is significantly influenced by the rising exploration and production activities across various regions. As countries seek to tap into untapped reserves, the demand for sensors that monitor drilling operations, reservoir conditions, and production efficiency increases. Enhanced exploration efforts in regions such as the Middle East and North America drive the need for advanced sensor technologies. This trend is expected to contribute to a compound annual growth rate of 5.16% from 2025 to 2035, as companies invest in sensors that ensure optimal performance and safety during exploration and production phases.

    Technological Advancements in Sensor Technologies

    Technological advancements play a pivotal role in shaping the Global Oil and Gas Sensors Market Industry. Innovations in sensor technologies, such as IoT integration and wireless communication, enhance the efficiency and reliability of monitoring systems. These advancements allow for real-time data collection and analysis, enabling operators to make informed decisions swiftly. For example, the integration of smart sensors in drilling operations has improved operational efficiency and reduced downtime. As the industry embraces these technologies, the market is expected to grow significantly, with a projected value of 23.8 USD Billion by 2035, indicating a robust trajectory driven by technological innovation.

    Market Segment Insights

    Oil & Gas Sensors Market Type Insights  

    The Oil & Gas Sensors Market has emerged as a vital component of the energy sector, primarily driven by the need for enhanced safety, efficiency, and regulatory compliance in the oil and gas industry. The market has shown an increasing valuation from 13.15 USD Billion in 2023 to 20.5 USD Billion by 2032, highlighting substantial growth prospects. Within this expansive market, various types of sensors play crucial roles.

    Pressure Sensors are recognized for their significant contribution, where they hold a major market share with a valuation of 3.15 USD Billion in 2023 and are projected to reach 5.0 USD Billion in 2032, underscoring their critical function in monitoring pressure levels within oil and gas pipelines, tanks, and equipment, thereby enhancing operational safety and reliability.

    Similarly, Temperature Sensors are anticipated to maintain their significance, valued at 2.75 USD Billion in 2023, and are expected to rise to 4.25 USD Billion in 2032. Their importance lies in the ability to monitor thermal variations, which are essential for preventing equipment failures and ensuring optimal operational conditions. Flow Sensors, with an initial valuation of 3.1 USD Billion in 2023 and expected to reach 4.5 USD Billion in 2032, play a vital role in measuring the flow rates of liquids and gases in various processes, essential for accurate production and operational efficiency.

    Level Sensors are also a relevant category within the market, valued at 2.0 USD Billion in 2023 and projected to increase to 3.0 USD Billion by 2032. These sensors are crucial for monitoring levels of liquids and gases, which is a necessary function for tank management and process control. Furthermore, Chemical Sensors, valued at 2.15 USD Billion in 2023 and expected to grow to 4.25 USD Billion by 2032, are emerging as important tools due to their capabilities in detecting and analyzing chemical compositions and hazardous materials in process environments.

    This trend reflects an increased emphasis on environmental safety and compliance with regulatory standards. 

    Oil & Gas Sensors Market Application Insights  

    The Oil & Gas Sensors Market, valued at 13.15 USD billion in 2023, showcases a prominent Application segment that is poised for robust growth through various domains, including Upstream, Midstream, and Downstream activities. This Application segment is essential as it encompasses the critical functions of exploration, production, and distribution of oil and gas, contributing significantly to the overall market landscape. The Upstream sector is vital for monitoring drilling conditions and ensuring production efficiency, while the Midstream is crucial for the safe transportation and storage of oil and gas, thereby enhancing operational integrity.

    Downstream operations involving refining and processing require advanced sensors to maintain product quality and optimize refining processes, which dominate the market due to the increasing demand for refined products. Market statistics reveal that technological advancements and stricter regulatory frameworks act as key growth drivers, creating opportunities for innovative sensor solutions. However, challenges like high installation costs and maintenance issues could affect market penetration. Overall, the Oil & Gas Sensors Market data underscore the importance of these diverse applications in driving industry advancements and market growth.

    Oil & Gas Sensors Market Technology Insights  

    The Oil & Gas Sensors Market in the Technology segment is witnessing notable growth, with the overall market expected to reach a valuation of 13.15 billion USD in 2023. This segment comprises various types of sensors including Wireless Sensors, Wired Sensors, Smart Sensors, and Optical Sensors, each playing a vital role in advancing operations in the oil and gas industry. Wireless Sensors have gained traction due to their ability to facilitate real-time data transmission and reduce installation costs, promoting operational efficiency. Wired Sensors continue to be essential owing to their reliability and accuracy, especially in critical environments.

    Smart Sensors leverage advanced technologies, including IoT, to enhance monitoring, reporting, and predictive maintenance capabilities. Optical Sensors stand out for their sensitivity and precision in detecting gas leaks, contributing significantly to safety protocols. These technologies are being driven by increasing safety regulations, the demand for improved operational efficiency, and the industry's focus on digital transformation, shaping the future landscape of the oil and gas sensors market with strong growth potential. The Oil & Gas Sensors Market segmentation is paving the path for diversified technological advancements, aligning with emerging trends and addressing the evolving needs of the industry.

    Oil & Gas Sensors Market End Use Insights  

    The Oil & Gas Sensors Market, with an expected valuation of 13.15 billion USD in 2023, encompasses various end-use applications that highlight its importance in the industry. Among these, the Onshore segment significantly contributes to the overall market, catering to land-based oil extraction and processing. Similarly, the Offshore segment also showcases substantial relevance by addressing the unique challenges and operational requirements of sensor technologies in marine environments. The Oil & Gas Sensors Market revenue benefits from the increasing demand for efficient monitoring and safety measures in both environments, driven by advancements in technology and a rising focus on operational efficiency.

    However, the industry faces challenges such as stringent regulatory standards and the need for high reliability in sensor performance. Despite these challenges, opportunities exist in the form of innovations in sensor technologies that enhance data accuracy and real-time monitoring capabilities. The future trajectory for the Oil & Gas Sensors Market data indicates a robust growth pattern, fuelled by the persistent need for enhanced safety and environmental sustainability across the oil and gas operations.

    As such, understanding the dynamics within the end-use applications is critical for stakeholders looking to capitalize on emerging trends and navigate the evolving landscape of the Oil & Gas Sensors Market industry.

    Get more detailed insights about Oil & Gas Sensors Market Research Report - Global Forecast till 2032

    Regional Insights

    The Oil & Gas Sensors Market revenue for 2023 stands at 13.15 billion USD, reflecting diverse growth potential across regions. North America dominates with a significant valuation of 5.0 billion USD in 2023, which is projected to rise to 8.0 billion USD by 2032, indicating its major role driven by robust oil exploration and production activities. Europe holds a considerable share, valued at 3.0 billion USD in 2023 and anticipated to grow to 4.5 billion USD, supported by stringent regulations on safety and efficiency.

    The APAC region matches Europe with a valuation of 3.0 billion USD this year, showcasing potential driven by increasing energy demands and technological advancements, reaching 5.5 billion USD by 2032.

    South America and the MEA regions are smaller, with valuations of 1.0 billion USD and 1.15 billion USD in 2023, rising to 1.7 billion USD and 1.3 billion USD, respectively. Their growth stems from emerging market opportunities in oil and gas exploration. The overall Oil & Gas Sensors Market data indicates strong regional dynamics, backed by advancements in sensor technology and increasing safety regulations across all regions, fueling market growth and offering opportunities for innovation in sensor applications.

    Oil & Gas Sensors Market Regional Insights

    Source: Primary Research, Secondary Research, Market Research Future Database and Analyst Review

    Key Players and Competitive Insights

    The Oil & Gas Sensors Market is characterized by a dynamic competitive landscape driven by the need for enhanced safety, efficiency, and sustainability in exploration, extraction, and refining processes. Key players in this market are continually innovating and improving their sensor technologies to meet the growing demands for real-time data, regulatory compliance, and operational reliability. With rising concerns over environmental impact and safety incidents, companies are focusing on developing advanced sensors that can monitor various parameters such as pressure, temperature, and gas composition in real-time.

    Additionally, the integration of Internet of Things (IoT) technology is enhancing these sensor systems, enabling more sophisticated data analysis and predictive maintenance capabilities, thereby creating opportunities for competitive differentiation and market leadership.

    General Electric has established a strong presence in the Oil & Gas Sensors Market through its extensive portfolio of sensor technologies aimed at optimizing operational performance and safety in the oil and gas sector. The company's strengths lie in its deep-rooted expertise in industrial applications, advanced analytics capabilities, and commitment to innovation. General Electric offers high-quality, reliable sensors that are integral to monitoring critical processes in oil and gas operations. Its integrated solutions leverage data intelligence, helping stakeholders make informed decisions and improve efficiency.

    Furthermore, partnerships and collaborations in research and development have allowed General Electric to stay at the forefront of sensor technology advancements.

    Teledyne Technologies is recognized for its significant contributions to the Oil & Gas Sensors Market, providing specialized sensors that cater to various applications within the industry. The company's strengths include a robust portfolio of high-performance sensing solutions that enhance safety and operational efficiency while tackling complex challenges faced by the oil and gas sector. Teledyne Technologies prides itself on its commitment to quality and precision, ensuring that its sensors meet rigorous industry standards. The company's focus on research and development enables it to introduce innovative products geared towards real-time monitoring and data collection, empowering operators to optimize their processes.

    With a solid reputation and a wide range of offerings, Teledyne Technologies continues to be a key player in driving advancements in sensor technology for the oil and gas industry.

    Key Companies in the Oil Gas Sensors Market market include

    Industry Developments

    Recent developments in the Oil & Gas Sensors Market reflect significant technological advancements and strategic movements among key players. General Electric and Honeywell have been at the forefront, investing in the integration of IoT solutions to enhance sensor capabilities for monitoring oil and gas processes. Teledyne Technologies and Siemens are increasingly focusing on smart sensors, aiming to improve data accuracy and reduce operational costs.

    Significant market activity has also been observed with a rise in acquisitions; however, specific recent mergers involving companies such as Rockwell Automation and ABB have reinforced their positions in the market, indicating a trend toward consolidation to leverage shared technologies and customer bases.

    Additionally, Emerson Electric and Yokogawa Electric are exploring partnerships to expand their sensor offerings, driven by the need for compliance with regulatory standards and efficiency. As a result, growth in market valuation is being witnessed, influencing competitive dynamics and prompting other firms, like Bosch and national instruments, to innovate continuously and adapt to changing market demands. Overall, these developments highlight a robust market environment that is evolving rapidly to meet the increasing needs of the oil and gas sector.

    Future Outlook

    Oil Gas Sensors Market Future Outlook

    The Oil & Gas Sensors Market is projected to grow at a 5.16% CAGR from 2024 to 2035, driven by technological advancements, increasing safety regulations, and the demand for operational efficiency.

    New opportunities lie in:

    • Invest in IoT-enabled sensors for real-time monitoring and predictive maintenance solutions.
    • Develop advanced analytics platforms to enhance data interpretation and decision-making processes.
    • Focus on sustainable sensor technologies to meet environmental regulations and reduce carbon footprints.

    By 2035, the Oil & Gas Sensors Market is expected to achieve substantial growth, reflecting evolving industry demands and technological innovations.

    Market Segmentation

    Oil & Gas Sensors Market Type Outlook

    • Pressure Sensors
    • Temperature Sensors
    • Flow Sensors
    • Level Sensors
    • Chemical Sensors

    Oil & Gas Sensors Market End Use Outlook

    • Onshore
    • Offshore

    Oil & Gas Sensors Market Regional Outlook

    • North America
    • Europe
    • South America
    • Asia Pacific
    • Middle East and Africa

    Oil & Gas Sensors Market Technology Outlook

    • Wireless Sensors
    • Wired Sensors
    • Smart Sensors
    • Optical Sensors

    Oil & Gas Sensors Market Application Outlook

    • Upstream
    • Midstream
    • Downstream
    • Refining
    • Processing

    Report Scope

    Report Attribute/Metric Details
    Market Size 2022 12.52 (USD Billion)
    Market Size 2023 13.15 (USD Billion)
    Market Size 2032 20.5 (USD Billion)
    Compound Annual Growth Rate (CAGR) 5.05% (2024 - 2032)
    Report Coverage Revenue Forecast, Competitive Landscape, Growth Factors, and Trends
    Base Year 2023
    Market Forecast Period 2024 - 2032
    Historical Data 2019 - 2023
    Market Forecast Units USD Billion
    Key Companies Profiled General Electric, Teledyne Technologies, Siemens, National Instruments, Bosch, ABB, Honeywell, Endress+Hauser, Emerson Electric, Yokogawa Electric, Rockwell Automation, Krohne, Texas Instruments, Ventus Technologies, Schneider Electric
    Segments Covered Type, Application, Technology, End Use, Regional
    Key Market Opportunities Increased demand for safety standards, Advancement in IoT technology, Integration with AI analytics, Expansion of renewable energy sectors, Growth in smart pipeline monitoring
    Key Market Dynamics Rising safety regulations, Increasing demand for automation, Growing exploration activities, Advancements in sensor technology, Development of smart oilfields
    Countries Covered North America, Europe, APAC, South America, MEA

    Market Highlights

    Author

    Chitranshi Jaiswal
    Research Analyst Level I

    She holds an experience of about 6+ years in market research and business consulting, working under the spectrum of information communication technology, telecommunications and semiconductor domains. aarti conceptualizes and implements a scalable business strategy and provides strategic leadership to the clients. her expertise lies in market estimation, competitive intelligence, pipeline analysis, customer assessment, etc.

    Leave a Comment

    Latest Comments

    John Doe
    john@example.com

    This is a great article! Really helped me understand the topic better.

    Posted on July 23, 2025, 10:15 AM
    Jane Smith
    jane@domain.com

    Thanks for sharing this. I’ve bookmarked it for later reference.

    Posted on July 22, 2025, 7:45 PM

    FAQs

    What is the expected market size of the Oil & Gas Sensors Market by 2032?

    By 2032, the Oil & Gas Sensors Market is expected to be valued at 20.5 USD billion.

    What is the anticipated CAGR for the Oil & Gas Sensors Market from 2024 to 2032?

    The anticipated CAGR for the Oil & Gas Sensors Market from 2024 to 2032 is 5.05%.

    Which region is forecasted to hold the largest market share in 2032?

    North America is forecasted to hold the largest market share with a valuation of 8.0 USD billion in 2032.

    What is the market size for Pressure Sensors in the Oil & Gas Sensors Market by 2032?

    The market size for Pressure Sensors is projected to reach 5.0 USD billion by 2032.

    Which key players are major competitors in the Global Oil & Gas Sensors Market?

    Major competitors in the Oil & Gas Sensors Market include General Electric, Siemens, and Honeywell.

    What is the expected market size for Temperature Sensors by 2032?

    The expected market size for Temperature Sensors is anticipated to reach 4.25 USD billion by 2032.

    Which region is expected to have significant growth from 2024 to 2032?

    The Asia-Pacific region is expected to have significant growth, projected to reach 5.5 USD billion by 2032.

    How much is the Flow Sensors segment expected to be valued in 2032?

    The Flow Sensors segment is expected to be valued at 4.5 USD billion by 2032.

    What challenges could impact the growth of the Global Oil & Gas Sensors Market?

    Challenges such as regulatory changes and technological advancements could impact the growth of the market.

    What is the expected market size for Chemical Sensors by 2032?

    The expected market size for Chemical Sensors is projected to reach 4.25 USD billion by 2032.

    1. Table of Contents
    2. Executive Summary
      1. Market Overview
      2. Key Findings
      3. Market Segmentation
      4. Competitive Landscape
      5. Challenges and Opportunities
      6. Future Outlook
    3. Market Introduction
      1. Definition
      2. Scope of the Study
        1. Research Objective
        2. Assumption
        3. Limitations
    4. Research Methodology
      1. Overview
      2. Data Mining
      3. Secondary Research
      4. Primary Research
        1. Primary Interviews and Information Gathering Process
        2. Breakdown of Primary Respondents
      5. Forecasting Model
      6. Market Size Estimation
        1. Bottom-up Approach
        2. Top-Down Approach
      7. Data Triangulation
      8. Validation
    5. MARKET DYNAMICS
      1. Overview
      2. Drivers
      3. Restraints
      4. Opportunities
    6. MARKET FACTOR ANALYSIS
      1. Value chain Analysis
      2. Porter's Five Forces Analysis
        1. Bargaining Power of Suppliers
        2. Bargaining Power of Buyers
        3. Threat of New Entrants
        4. Threat of Substitutes
        5. Intensity of Rivalry
      3. COVID-19 Impact Analysis
        1. Market Impact Analysis
        2. Regional Impact
        3. Opportunity and Threat Analysis
    7. OIL GAS SENSORS MARKET, BY TYPE (USD BILLION)
      1. Pressure Sensors
      2. Temperature Sensors
      3. Flow Sensors
      4. Level Sensors
      5. Chemical Sensors
    8. OIL GAS SENSORS MARKET, BY APPLICATION (USD BILLION)
      1. Upstream
      2. Midstream
      3. Downstream
      4. Refining
      5. Processing
    9. OIL GAS SENSORS MARKET, BY TECHNOLOGY (USD BILLION)
      1. Wireless Sensors
      2. Wired Sensors
      3. Smart Sensors
      4. Optical Sensors
    10. OIL GAS SENSORS MARKET, BY END USE (USD BILLION)
      1. Onshore
      2. Offshore
    11. OIL GAS SENSORS MARKET, BY REGIONAL (USD BILLION)
      1. North America
        1. US
        2. Canada
      2. Europe
        1. Germany
        2. UK
        3. France
        4. Russia
        5. Italy
        6. Spain
        7. Rest of Europe
      3. APAC
        1. China
        2. India
        3. Japan
        4. South Korea
        5. Malaysia
        6. Thailand
        7. Indonesia
        8. Rest of APAC
      4. South America
        1. Brazil
        2. Mexico
        3. Argentina
        4. Rest of South America
      5. MEA
        1. GCC Countries
        2. South Africa
        3. Rest of MEA
    12. Competitive Landscape
      1. Overview
      2. Competitive Analysis
      3. Market share Analysis
      4. Major Growth Strategy in the Oil Gas Sensors Market
      5. Competitive Benchmarking
      6. Leading Players in Terms of Number of Developments in the Oil Gas Sensors Market
      7. Key developments and growth strategies
        1. New Product Launch/Service Deployment
        2. Merger Acquisitions
        3. Joint Ventures
      8. Major Players Financial Matrix
        1. Sales and Operating Income
        2. Major Players RD Expenditure. 2023
    13. COMPANY PROFILES
      1. General Electric
        1. Financial Overview
        2. Products Offered
        3. Key Developments
        4. SWOT Analysis
        5. Key Strategies
      2. Teledyne Technologies
        1. Financial Overview
        2. Products Offered
        3. Key Developments
        4. SWOT Analysis
        5. Key Strategies
      3. Siemens
        1. Financial Overview
        2. Products Offered
        3. Key Developments
        4. SWOT Analysis
        5. Key Strategies
      4. National Instruments
        1. Financial Overview
        2. Products Offered
        3. Key Developments
        4. SWOT Analysis
        5. Key Strategies
      5. Bosch
        1. Financial Overview
        2. Products Offered
        3. Key Developments
        4. SWOT Analysis
        5. Key Strategies
      6. ABB
        1. Financial Overview
        2. Products Offered
        3. Key Developments
        4. SWOT Analysis
        5. Key Strategies
      7. Honeywell
        1. Financial Overview
        2. Products Offered
        3. Key Developments
        4. SWOT Analysis
        5. Key Strategies
      8. Endress+Hauser
        1. Financial Overview
        2. Products Offered
        3. Key Developments
        4. SWOT Analysis
        5. Key Strategies
      9. Emerson Electric
        1. Financial Overview
        2. Products Offered
        3. Key Developments
        4. SWOT Analysis
        5. Key Strategies
      10. Yokogawa Electric
        1. Financial Overview
        2. Products Offered
        3. Key Developments
        4. SWOT Analysis
        5. Key Strategies
      11. Rockwell Automation
        1. Financial Overview
        2. Products Offered
        3. Key Developments
        4. SWOT Analysis
        5. Key Strategies
      12. Krohne
        1. Financial Overview
        2. Products Offered
        3. Key Developments
        4. SWOT Analysis
        5. Key Strategies
      13. Texas Instruments
        1. Financial Overview
        2. Products Offered
        3. Key Developments
        4. SWOT Analysis
        5. Key Strategies
      14. Ventus Technologies
        1. Financial Overview
        2. Products Offered
        3. Key Developments
        4. SWOT Analysis
        5. Key Strategies
      15. Schneider Electric
        1. Financial Overview
        2. Products Offered
        3. Key Developments
        4. SWOT Analysis
        5. Key Strategies
    14. APPENDIX
      1. References
      2. Related Reports
    15. List of Tables and Figures
      1. LIST OF TABLES
      2. TABLE 1. LIST OF ASSUMPTIONS
      3. TABLE 2. NORTH AMERICA OIL & GAS SENSORS MARKET SIZE ESTIMATES & FORECAST, BY TYPE, 2019-2032 (USD BILLIONS)
      4. TABLE 3. NORTH AMERICA OIL & GAS SENSORS MARKET SIZE ESTIMATES & FORECAST, BY APPLICATION, 2019-2032 (USD BILLIONS)
      5. TABLE 4. NORTH AMERICA OIL & GAS SENSORS MARKET SIZE ESTIMATES & FORECAST, BY TECHNOLOGY, 2019-2032 (USD BILLIONS)
      6. TABLE 5. NORTH AMERICA OIL & GAS SENSORS MARKET SIZE ESTIMATES & FORECAST, BY END USE, 2019-2032 (USD BILLIONS)
      7. TABLE 6. NORTH AMERICA OIL & GAS SENSORS MARKET SIZE ESTIMATES & FORECAST, BY REGIONAL, 2019-2032 (USD BILLIONS)
      8. TABLE 7. US OIL & GAS SENSORS MARKET SIZE ESTIMATES & FORECAST, BY TYPE, 2019-2032 (USD BILLIONS)
      9. TABLE 8. US OIL & GAS SENSORS MARKET SIZE ESTIMATES & FORECAST, BY APPLICATION, 2019-2032 (USD BILLIONS)
      10. TABLE 9. US OIL & GAS SENSORS MARKET SIZE ESTIMATES & FORECAST, BY TECHNOLOGY, 2019-2032 (USD BILLIONS)
      11. TABLE 10. US OIL & GAS SENSORS MARKET SIZE ESTIMATES & FORECAST, BY END USE, 2019-2032 (USD BILLIONS)
      12. TABLE 11. US OIL & GAS SENSORS MARKET SIZE ESTIMATES & FORECAST, BY REGIONAL, 2019-2032 (USD BILLIONS)
      13. TABLE 12. CANADA OIL & GAS SENSORS MARKET SIZE ESTIMATES & FORECAST, BY TYPE, 2019-2032 (USD BILLIONS)
      14. TABLE 13. CANADA OIL & GAS SENSORS MARKET SIZE ESTIMATES & FORECAST, BY APPLICATION, 2019-2032 (USD BILLIONS)
      15. TABLE 14. CANADA OIL & GAS SENSORS MARKET SIZE ESTIMATES & FORECAST, BY TECHNOLOGY, 2019-2032 (USD BILLIONS)
      16. TABLE 15. CANADA OIL & GAS SENSORS MARKET SIZE ESTIMATES & FORECAST, BY END USE, 2019-2032 (USD BILLIONS)
      17. TABLE 16. CANADA OIL & GAS SENSORS MARKET SIZE ESTIMATES & FORECAST, BY REGIONAL, 2019-2032 (USD BILLIONS)
      18. TABLE 17. EUROPE OIL & GAS SENSORS MARKET SIZE ESTIMATES & FORECAST, BY TYPE, 2019-2032 (USD BILLIONS)
      19. TABLE 18. EUROPE OIL & GAS SENSORS MARKET SIZE ESTIMATES & FORECAST, BY APPLICATION, 2019-2032 (USD BILLIONS)
      20. TABLE 19. EUROPE OIL & GAS SENSORS MARKET SIZE ESTIMATES & FORECAST, BY TECHNOLOGY, 2019-2032 (USD BILLIONS)
      21. TABLE 20. EUROPE OIL & GAS SENSORS MARKET SIZE ESTIMATES & FORECAST, BY END USE, 2019-2032 (USD BILLIONS)
      22. TABLE 21. EUROPE OIL & GAS SENSORS MARKET SIZE ESTIMATES & FORECAST, BY REGIONAL, 2019-2032 (USD BILLIONS)
      23. TABLE 22. GERMANY OIL & GAS SENSORS MARKET SIZE ESTIMATES & FORECAST, BY TYPE, 2019-2032 (USD BILLIONS)
      24. TABLE 23. GERMANY OIL & GAS SENSORS MARKET SIZE ESTIMATES & FORECAST, BY APPLICATION, 2019-2032 (USD BILLIONS)
      25. TABLE 24. GERMANY OIL & GAS SENSORS MARKET SIZE ESTIMATES & FORECAST, BY TECHNOLOGY, 2019-2032 (USD BILLIONS)
      26. TABLE 25. GERMANY OIL & GAS SENSORS MARKET SIZE ESTIMATES & FORECAST, BY END USE, 2019-2032 (USD BILLIONS)
      27. TABLE 26. GERMANY OIL & GAS SENSORS MARKET SIZE ESTIMATES & FORECAST, BY REGIONAL, 2019-2032 (USD BILLIONS)
      28. TABLE 27. UK OIL & GAS SENSORS MARKET SIZE ESTIMATES & FORECAST, BY TYPE, 2019-2032 (USD BILLIONS)
      29. TABLE 28. UK OIL & GAS SENSORS MARKET SIZE ESTIMATES & FORECAST, BY APPLICATION, 2019-2032 (USD BILLIONS)
      30. TABLE 29. UK OIL & GAS SENSORS MARKET SIZE ESTIMATES & FORECAST, BY TECHNOLOGY, 2019-2032 (USD BILLIONS)
      31. TABLE 30. UK OIL & GAS SENSORS MARKET SIZE ESTIMATES & FORECAST, BY END USE, 2019-2032 (USD BILLIONS)
      32. TABLE 31. UK OIL & GAS SENSORS MARKET SIZE ESTIMATES & FORECAST, BY REGIONAL, 2019-2032 (USD BILLIONS)
      33. TABLE 32. FRANCE OIL & GAS SENSORS MARKET SIZE ESTIMATES & FORECAST, BY TYPE, 2019-2032 (USD BILLIONS)
      34. TABLE 33. FRANCE OIL & GAS SENSORS MARKET SIZE ESTIMATES & FORECAST, BY APPLICATION, 2019-2032 (USD BILLIONS)
      35. TABLE 34. FRANCE OIL & GAS SENSORS MARKET SIZE ESTIMATES & FORECAST, BY TECHNOLOGY, 2019-2032 (USD BILLIONS)
      36. TABLE 35. FRANCE OIL & GAS SENSORS MARKET SIZE ESTIMATES & FORECAST, BY END USE, 2019-2032 (USD BILLIONS)
      37. TABLE 36. FRANCE OIL & GAS SENSORS MARKET SIZE ESTIMATES & FORECAST, BY REGIONAL, 2019-2032 (USD BILLIONS)
      38. TABLE 37. RUSSIA OIL & GAS SENSORS MARKET SIZE ESTIMATES & FORECAST, BY TYPE, 2019-2032 (USD BILLIONS)
      39. TABLE 38. RUSSIA OIL & GAS SENSORS MARKET SIZE ESTIMATES & FORECAST, BY APPLICATION, 2019-2032 (USD BILLIONS)
      40. TABLE 39. RUSSIA OIL & GAS SENSORS MARKET SIZE ESTIMATES & FORECAST, BY TECHNOLOGY, 2019-2032 (USD BILLIONS)
      41. TABLE 40. RUSSIA OIL & GAS SENSORS MARKET SIZE ESTIMATES & FORECAST, BY END USE, 2019-2032 (USD BILLIONS)
      42. TABLE 41. RUSSIA OIL & GAS SENSORS MARKET SIZE ESTIMATES & FORECAST, BY REGIONAL, 2019-2032 (USD BILLIONS)
      43. TABLE 42. ITALY OIL & GAS SENSORS MARKET SIZE ESTIMATES & FORECAST, BY TYPE, 2019-2032 (USD BILLIONS)
      44. TABLE 43. ITALY OIL & GAS SENSORS MARKET SIZE ESTIMATES & FORECAST, BY APPLICATION, 2019-2032 (USD BILLIONS)
      45. TABLE 44. ITALY OIL & GAS SENSORS MARKET SIZE ESTIMATES & FORECAST, BY TECHNOLOGY, 2019-2032 (USD BILLIONS)
      46. TABLE 45. ITALY OIL & GAS SENSORS MARKET SIZE ESTIMATES & FORECAST, BY END USE, 2019-2032 (USD BILLIONS)
      47. TABLE 46. ITALY OIL & GAS SENSORS MARKET SIZE ESTIMATES & FORECAST, BY REGIONAL, 2019-2032 (USD BILLIONS)
      48. TABLE 47. SPAIN OIL & GAS SENSORS MARKET SIZE ESTIMATES & FORECAST, BY TYPE, 2019-2032 (USD BILLIONS)
      49. TABLE 48. SPAIN OIL & GAS SENSORS MARKET SIZE ESTIMATES & FORECAST, BY APPLICATION, 2019-2032 (USD BILLIONS)
      50. TABLE 49. SPAIN OIL & GAS SENSORS MARKET SIZE ESTIMATES & FORECAST, BY TECHNOLOGY, 2019-2032 (USD BILLIONS)
      51. TABLE 50. SPAIN OIL & GAS SENSORS MARKET SIZE ESTIMATES & FORECAST, BY END USE, 2019-2032 (USD BILLIONS)
      52. TABLE 51. SPAIN OIL & GAS SENSORS MARKET SIZE ESTIMATES & FORECAST, BY REGIONAL, 2019-2032 (USD BILLIONS)
      53. TABLE 52. REST OF EUROPE OIL & GAS SENSORS MARKET SIZE ESTIMATES & FORECAST, BY TYPE, 2019-2032 (USD BILLIONS)
      54. TABLE 53. REST OF EUROPE OIL & GAS SENSORS MARKET SIZE ESTIMATES & FORECAST, BY APPLICATION, 2019-2032 (USD BILLIONS)
      55. TABLE 54. REST OF EUROPE OIL & GAS SENSORS MARKET SIZE ESTIMATES & FORECAST, BY TECHNOLOGY, 2019-2032 (USD BILLIONS)
      56. TABLE 55. REST OF EUROPE OIL & GAS SENSORS MARKET SIZE ESTIMATES & FORECAST, BY END USE, 2019-2032 (USD BILLIONS)
      57. TABLE 56. REST OF EUROPE OIL & GAS SENSORS MARKET SIZE ESTIMATES & FORECAST, BY REGIONAL, 2019-2032 (USD BILLIONS)
      58. TABLE 57. APAC OIL & GAS SENSORS MARKET SIZE ESTIMATES & FORECAST, BY TYPE, 2019-2032 (USD BILLIONS)
      59. TABLE 58. APAC OIL & GAS SENSORS MARKET SIZE ESTIMATES & FORECAST, BY APPLICATION, 2019-2032 (USD BILLIONS)
      60. TABLE 59. APAC OIL & GAS SENSORS MARKET SIZE ESTIMATES & FORECAST, BY TECHNOLOGY, 2019-2032 (USD BILLIONS)
      61. TABLE 60. APAC OIL & GAS SENSORS MARKET SIZE ESTIMATES & FORECAST, BY END USE, 2019-2032 (USD BILLIONS)
      62. TABLE 61. APAC OIL & GAS SENSORS MARKET SIZE ESTIMATES & FORECAST, BY REGIONAL, 2019-2032 (USD BILLIONS)
      63. TABLE 62. CHINA OIL & GAS SENSORS MARKET SIZE ESTIMATES & FORECAST, BY TYPE, 2019-2032 (USD BILLIONS)
      64. TABLE 63. CHINA OIL & GAS SENSORS MARKET SIZE ESTIMATES & FORECAST, BY APPLICATION, 2019-2032 (USD BILLIONS)
      65. TABLE 64. CHINA OIL & GAS SENSORS MARKET SIZE ESTIMATES & FORECAST, BY TECHNOLOGY, 2019-2032 (USD BILLIONS)
      66. TABLE 65. CHINA OIL & GAS SENSORS MARKET SIZE ESTIMATES & FORECAST, BY END USE, 2019-2032 (USD BILLIONS)
      67. TABLE 66. CHINA OIL & GAS SENSORS MARKET SIZE ESTIMATES & FORECAST, BY REGIONAL, 2019-2032 (USD BILLIONS)
      68. TABLE 67. INDIA OIL & GAS SENSORS MARKET SIZE ESTIMATES & FORECAST, BY TYPE, 2019-2032 (USD BILLIONS)
      69. TABLE 68. INDIA OIL & GAS SENSORS MARKET SIZE ESTIMATES & FORECAST, BY APPLICATION, 2019-2032 (USD BILLIONS)
      70. TABLE 69. INDIA OIL & GAS SENSORS MARKET SIZE ESTIMATES & FORECAST, BY TECHNOLOGY, 2019-2032 (USD BILLIONS)
      71. TABLE 70. INDIA OIL & GAS SENSORS MARKET SIZE ESTIMATES & FORECAST, BY END USE, 2019-2032 (USD BILLIONS)
      72. TABLE 71. INDIA OIL & GAS SENSORS MARKET SIZE ESTIMATES & FORECAST, BY REGIONAL, 2019-2032 (USD BILLIONS)
      73. TABLE 72. JAPAN OIL & GAS SENSORS MARKET SIZE ESTIMATES & FORECAST, BY TYPE, 2019-2032 (USD BILLIONS)
      74. TABLE 73. JAPAN OIL & GAS SENSORS MARKET SIZE ESTIMATES & FORECAST, BY APPLICATION, 2019-2032 (USD BILLIONS)
      75. TABLE 74. JAPAN OIL & GAS SENSORS MARKET SIZE ESTIMATES & FORECAST, BY TECHNOLOGY, 2019-2032 (USD BILLIONS)
      76. TABLE 75. JAPAN OIL & GAS SENSORS MARKET SIZE ESTIMATES & FORECAST, BY END USE, 2019-2032 (USD BILLIONS)
      77. TABLE 76. JAPAN OIL & GAS SENSORS MARKET SIZE ESTIMATES & FORECAST, BY REGIONAL, 2019-2032 (USD BILLIONS)
      78. TABLE 77. SOUTH KOREA OIL & GAS SENSORS MARKET SIZE ESTIMATES & FORECAST, BY TYPE, 2019-2032 (USD BILLIONS)
      79. TABLE 78. SOUTH KOREA OIL & GAS SENSORS MARKET SIZE ESTIMATES & FORECAST, BY APPLICATION, 2019-2032 (USD BILLIONS)
      80. TABLE 79. SOUTH KOREA OIL & GAS SENSORS MARKET SIZE ESTIMATES & FORECAST, BY TECHNOLOGY, 2019-2032 (USD BILLIONS)
      81. TABLE 80. SOUTH KOREA OIL & GAS SENSORS MARKET SIZE ESTIMATES & FORECAST, BY END USE, 2019-2032 (USD BILLIONS)
      82. TABLE 81. SOUTH KOREA OIL & GAS SENSORS MARKET SIZE ESTIMATES & FORECAST, BY REGIONAL, 2019-2032 (USD BILLIONS)
      83. TABLE 82. MALAYSIA OIL & GAS SENSORS MARKET SIZE ESTIMATES & FORECAST, BY TYPE, 2019-2032 (USD BILLIONS)
      84. TABLE 83. MALAYSIA OIL & GAS SENSORS MARKET SIZE ESTIMATES & FORECAST, BY APPLICATION, 2019-2032 (USD BILLIONS)
      85. TABLE 84. MALAYSIA OIL & GAS SENSORS MARKET SIZE ESTIMATES & FORECAST, BY TECHNOLOGY, 2019-2032 (USD BILLIONS)
      86. TABLE 85. MALAYSIA OIL & GAS SENSORS MARKET SIZE ESTIMATES & FORECAST, BY END USE, 2019-2032 (USD BILLIONS)
      87. TABLE 86. MALAYSIA OIL & GAS SENSORS MARKET SIZE ESTIMATES & FORECAST, BY REGIONAL, 2019-2032 (USD BILLIONS)
      88. TABLE 87. THAILAND OIL & GAS SENSORS MARKET SIZE ESTIMATES & FORECAST, BY TYPE, 2019-2032 (USD BILLIONS)
      89. TABLE 88. THAILAND OIL & GAS SENSORS MARKET SIZE ESTIMATES & FORECAST, BY APPLICATION, 2019-2032 (USD BILLIONS)
      90. TABLE 89. THAILAND OIL & GAS SENSORS MARKET SIZE ESTIMATES & FORECAST, BY TECHNOLOGY, 2019-2032 (USD BILLIONS)
      91. TABLE 90. THAILAND OIL & GAS SENSORS MARKET SIZE ESTIMATES & FORECAST, BY END USE, 2019-2032 (USD BILLIONS)
      92. TABLE 91. THAILAND OIL & GAS SENSORS MARKET SIZE ESTIMATES & FORECAST, BY REGIONAL, 2019-2032 (USD BILLIONS)
      93. TABLE 92. INDONESIA OIL & GAS SENSORS MARKET SIZE ESTIMATES & FORECAST, BY TYPE, 2019-2032 (USD BILLIONS)
      94. TABLE 93. INDONESIA OIL & GAS SENSORS MARKET SIZE ESTIMATES & FORECAST, BY APPLICATION, 2019-2032 (USD BILLIONS)
      95. TABLE 94. INDONESIA OIL & GAS SENSORS MARKET SIZE ESTIMATES & FORECAST, BY TECHNOLOGY, 2019-2032 (USD BILLIONS)
      96. TABLE 95. INDONESIA OIL & GAS SENSORS MARKET SIZE ESTIMATES & FORECAST, BY END USE, 2019-2032 (USD BILLIONS)
      97. TABLE 96. INDONESIA OIL & GAS SENSORS MARKET SIZE ESTIMATES & FORECAST, BY REGIONAL, 2019-2032 (USD BILLIONS)
      98. TABLE 97. REST OF APAC OIL & GAS SENSORS MARKET SIZE ESTIMATES & FORECAST, BY TYPE, 2019-2032 (USD BILLIONS)
      99. TABLE 98. REST OF APAC OIL & GAS SENSORS MARKET SIZE ESTIMATES & FORECAST, BY APPLICATION, 2019-2032 (USD BILLIONS)
      100. TABLE 99. REST OF APAC OIL & GAS SENSORS MARKET SIZE ESTIMATES & FORECAST, BY TECHNOLOGY, 2019-2032 (USD BILLIONS)
      101. TABLE 100. REST OF APAC OIL & GAS SENSORS MARKET SIZE ESTIMATES & FORECAST, BY END USE, 2019-2032 (USD BILLIONS)
      102. TABLE 101. REST OF APAC OIL & GAS SENSORS MARKET SIZE ESTIMATES & FORECAST, BY REGIONAL, 2019-2032 (USD BILLIONS)
      103. TABLE 102. SOUTH AMERICA OIL & GAS SENSORS MARKET SIZE ESTIMATES & FORECAST, BY TYPE, 2019-2032 (USD BILLIONS)
      104. TABLE 103. SOUTH AMERICA OIL & GAS SENSORS MARKET SIZE ESTIMATES & FORECAST, BY APPLICATION, 2019-2032 (USD BILLIONS)
      105. TABLE 104. SOUTH AMERICA OIL & GAS SENSORS MARKET SIZE ESTIMATES & FORECAST, BY TECHNOLOGY, 2019-2032 (USD BILLIONS)
      106. TABLE 105. SOUTH AMERICA OIL & GAS SENSORS MARKET SIZE ESTIMATES & FORECAST, BY END USE, 2019-2032 (USD BILLIONS)
      107. TABLE 106. SOUTH AMERICA OIL & GAS SENSORS MARKET SIZE ESTIMATES & FORECAST, BY REGIONAL, 2019-2032 (USD BILLIONS)
      108. TABLE 107. BRAZIL OIL & GAS SENSORS MARKET SIZE ESTIMATES & FORECAST, BY TYPE, 2019-2032 (USD BILLIONS)
      109. TABLE 108. BRAZIL OIL & GAS SENSORS MARKET SIZE ESTIMATES & FORECAST, BY APPLICATION, 2019-2032 (USD BILLIONS)
      110. TABLE 109. BRAZIL OIL & GAS SENSORS MARKET SIZE ESTIMATES & FORECAST, BY TECHNOLOGY, 2019-2032 (USD BILLIONS)
      111. TABLE 110. BRAZIL OIL & GAS SENSORS MARKET SIZE ESTIMATES & FORECAST, BY END USE, 2019-2032 (USD BILLIONS)
      112. TABLE 111. BRAZIL OIL & GAS SENSORS MARKET SIZE ESTIMATES & FORECAST, BY REGIONAL, 2019-2032 (USD BILLIONS)
      113. TABLE 112. MEXICO OIL & GAS SENSORS MARKET SIZE ESTIMATES & FORECAST, BY TYPE, 2019-2032 (USD BILLIONS)
      114. TABLE 113. MEXICO OIL & GAS SENSORS MARKET SIZE ESTIMATES & FORECAST, BY APPLICATION, 2019-2032 (USD BILLIONS)
      115. TABLE 114. MEXICO OIL & GAS SENSORS MARKET SIZE ESTIMATES & FORECAST, BY TECHNOLOGY, 2019-2032 (USD BILLIONS)
      116. TABLE 115. MEXICO OIL & GAS SENSORS MARKET SIZE ESTIMATES & FORECAST, BY END USE, 2019-2032 (USD BILLIONS)
      117. TABLE 116. MEXICO OIL & GAS SENSORS MARKET SIZE ESTIMATES & FORECAST, BY REGIONAL, 2019-2032 (USD BILLIONS)
      118. TABLE 117. ARGENTINA OIL & GAS SENSORS MARKET SIZE ESTIMATES & FORECAST, BY TYPE, 2019-2032 (USD BILLIONS)
      119. TABLE 118. ARGENTINA OIL & GAS SENSORS MARKET SIZE ESTIMATES & FORECAST, BY APPLICATION, 2019-2032 (USD BILLIONS)
      120. TABLE 119. ARGENTINA OIL & GAS SENSORS MARKET SIZE ESTIMATES & FORECAST, BY TECHNOLOGY, 2019-2032 (USD BILLIONS)
      121. TABLE 120. ARGENTINA OIL & GAS SENSORS MARKET SIZE ESTIMATES & FORECAST, BY END USE, 2019-2032 (USD BILLIONS)
      122. TABLE 121. ARGENTINA OIL & GAS SENSORS MARKET SIZE ESTIMATES & FORECAST, BY REGIONAL, 2019-2032 (USD BILLIONS)
      123. TABLE 122. REST OF SOUTH AMERICA OIL & GAS SENSORS MARKET SIZE ESTIMATES & FORECAST, BY TYPE, 2019-2032 (USD BILLIONS)
      124. TABLE 123. REST OF SOUTH AMERICA OIL & GAS SENSORS MARKET SIZE ESTIMATES & FORECAST, BY APPLICATION, 2019-2032 (USD BILLIONS)
      125. TABLE 124. REST OF SOUTH AMERICA OIL & GAS SENSORS MARKET SIZE ESTIMATES & FORECAST, BY TECHNOLOGY, 2019-2032 (USD BILLIONS)
      126. TABLE 125. REST OF SOUTH AMERICA OIL & GAS SENSORS MARKET SIZE ESTIMATES & FORECAST, BY END USE, 2019-2032 (USD BILLIONS)
      127. TABLE 126. REST OF SOUTH AMERICA OIL & GAS SENSORS MARKET SIZE ESTIMATES & FORECAST, BY REGIONAL, 2019-2032 (USD BILLIONS)
      128. TABLE 127. MEA OIL & GAS SENSORS MARKET SIZE ESTIMATES & FORECAST, BY TYPE, 2019-2032 (USD BILLIONS)
      129. TABLE 128. MEA OIL & GAS SENSORS MARKET SIZE ESTIMATES & FORECAST, BY APPLICATION, 2019-2032 (USD BILLIONS)
      130. TABLE 129. MEA OIL & GAS SENSORS MARKET SIZE ESTIMATES & FORECAST, BY TECHNOLOGY, 2019-2032 (USD BILLIONS)
      131. TABLE 130. MEA OIL & GAS SENSORS MARKET SIZE ESTIMATES & FORECAST, BY END USE, 2019-2032 (USD BILLIONS)
      132. TABLE 131. MEA OIL & GAS SENSORS MARKET SIZE ESTIMATES & FORECAST, BY REGIONAL, 2019-2032 (USD BILLIONS)
      133. TABLE 132. GCC COUNTRIES OIL & GAS SENSORS MARKET SIZE ESTIMATES & FORECAST, BY TYPE, 2019-2032 (USD BILLIONS)
      134. TABLE 133. GCC COUNTRIES OIL & GAS SENSORS MARKET SIZE ESTIMATES & FORECAST, BY APPLICATION, 2019-2032 (USD BILLIONS)
      135. TABLE 134. GCC COUNTRIES OIL & GAS SENSORS MARKET SIZE ESTIMATES & FORECAST, BY TECHNOLOGY, 2019-2032 (USD BILLIONS)
      136. TABLE 135. GCC COUNTRIES OIL & GAS SENSORS MARKET SIZE ESTIMATES & FORECAST, BY END USE, 2019-2032 (USD BILLIONS)
      137. TABLE 136. GCC COUNTRIES OIL & GAS SENSORS MARKET SIZE ESTIMATES & FORECAST, BY REGIONAL, 2019-2032 (USD BILLIONS)
      138. TABLE 137. SOUTH AFRICA OIL & GAS SENSORS MARKET SIZE ESTIMATES & FORECAST, BY TYPE, 2019-2032 (USD BILLIONS)
      139. TABLE 138. SOUTH AFRICA OIL & GAS SENSORS MARKET SIZE ESTIMATES & FORECAST, BY APPLICATION, 2019-2032 (USD BILLIONS)
      140. TABLE 139. SOUTH AFRICA OIL & GAS SENSORS MARKET SIZE ESTIMATES & FORECAST, BY TECHNOLOGY, 2019-2032 (USD BILLIONS)
      141. TABLE 140. SOUTH AFRICA OIL & GAS SENSORS MARKET SIZE ESTIMATES & FORECAST, BY END USE, 2019-2032 (USD BILLIONS)
      142. TABLE 141. SOUTH AFRICA OIL & GAS SENSORS MARKET SIZE ESTIMATES & FORECAST, BY REGIONAL, 2019-2032 (USD BILLIONS)
      143. TABLE 142. REST OF MEA OIL & GAS SENSORS MARKET SIZE ESTIMATES & FORECAST, BY TYPE, 2019-2032 (USD BILLIONS)
      144. TABLE 143. REST OF MEA OIL & GAS SENSORS MARKET SIZE ESTIMATES & FORECAST, BY APPLICATION, 2019-2032 (USD BILLIONS)
      145. TABLE 144. REST OF MEA OIL & GAS SENSORS MARKET SIZE ESTIMATES & FORECAST, BY TECHNOLOGY, 2019-2032 (USD BILLIONS)
      146. TABLE 145. REST OF MEA OIL & GAS SENSORS MARKET SIZE ESTIMATES & FORECAST, BY END USE, 2019-2032 (USD BILLIONS)
      147. TABLE 146. REST OF MEA OIL & GAS SENSORS MARKET SIZE ESTIMATES & FORECAST, BY REGIONAL, 2019-2032 (USD BILLIONS)
      148. TABLE 147. PRODUCT LAUNCH/PRODUCT DEVELOPMENT/APPROVAL
      149. TABLE 148. ACQUISITION/PARTNERSHIP LIST OF FIGURES
      150. FIGURE 1. MARKET SYNOPSIS
      151. FIGURE 2. NORTH AMERICA OIL & GAS SENSORS MARKET ANALYSIS
      152. FIGURE 3. US OIL & GAS SENSORS MARKET ANALYSIS BY TYPE
      153. FIGURE 4. US OIL & GAS SENSORS MARKET ANALYSIS BY APPLICATION
      154. FIGURE 5. US OIL & GAS SENSORS MARKET ANALYSIS BY TECHNOLOGY
      155. FIGURE 6. US OIL & GAS SENSORS MARKET ANALYSIS BY END USE
      156. FIGURE 7. US OIL & GAS SENSORS MARKET ANALYSIS BY REGIONAL
      157. FIGURE 8. CANADA OIL & GAS SENSORS MARKET ANALYSIS BY TYPE
      158. FIGURE 9. CANADA OIL & GAS SENSORS MARKET ANALYSIS BY APPLICATION
      159. FIGURE 10. CANADA OIL & GAS SENSORS MARKET ANALYSIS BY TECHNOLOGY
      160. FIGURE 11. CANADA OIL & GAS SENSORS MARKET ANALYSIS BY END USE
      161. FIGURE 12. CANADA OIL & GAS SENSORS MARKET ANALYSIS BY REGIONAL
      162. FIGURE 13. EUROPE OIL & GAS SENSORS MARKET ANALYSIS
      163. FIGURE 14. GERMANY OIL & GAS SENSORS MARKET ANALYSIS BY TYPE
      164. FIGURE 15. GERMANY OIL & GAS SENSORS MARKET ANALYSIS BY APPLICATION
      165. FIGURE 16. GERMANY OIL & GAS SENSORS MARKET ANALYSIS BY TECHNOLOGY
      166. FIGURE 17. GERMANY OIL & GAS SENSORS MARKET ANALYSIS BY END USE
      167. FIGURE 18. GERMANY OIL & GAS SENSORS MARKET ANALYSIS BY REGIONAL
      168. FIGURE 19. UK OIL & GAS SENSORS MARKET ANALYSIS BY TYPE
      169. FIGURE 20. UK OIL & GAS SENSORS MARKET ANALYSIS BY APPLICATION
      170. FIGURE 21. UK OIL & GAS SENSORS MARKET ANALYSIS BY TECHNOLOGY
      171. FIGURE 22. UK OIL & GAS SENSORS MARKET ANALYSIS BY END USE
      172. FIGURE 23. UK OIL & GAS SENSORS MARKET ANALYSIS BY REGIONAL
      173. FIGURE 24. FRANCE OIL & GAS SENSORS MARKET ANALYSIS BY TYPE
      174. FIGURE 25. FRANCE OIL & GAS SENSORS MARKET ANALYSIS BY APPLICATION
      175. FIGURE 26. FRANCE OIL & GAS SENSORS MARKET ANALYSIS BY TECHNOLOGY
      176. FIGURE 27. FRANCE OIL & GAS SENSORS MARKET ANALYSIS BY END USE
      177. FIGURE 28. FRANCE OIL & GAS SENSORS MARKET ANALYSIS BY REGIONAL
      178. FIGURE 29. RUSSIA OIL & GAS SENSORS MARKET ANALYSIS BY TYPE
      179. FIGURE 30. RUSSIA OIL & GAS SENSORS MARKET ANALYSIS BY APPLICATION
      180. FIGURE 31. RUSSIA OIL & GAS SENSORS MARKET ANALYSIS BY TECHNOLOGY
      181. FIGURE 32. RUSSIA OIL & GAS SENSORS MARKET ANALYSIS BY END USE
      182. FIGURE 33. RUSSIA OIL & GAS SENSORS MARKET ANALYSIS BY REGIONAL
      183. FIGURE 34. ITALY OIL & GAS SENSORS MARKET ANALYSIS BY TYPE
      184. FIGURE 35. ITALY OIL & GAS SENSORS MARKET ANALYSIS BY APPLICATION
      185. FIGURE 36. ITALY OIL & GAS SENSORS MARKET ANALYSIS BY TECHNOLOGY
      186. FIGURE 37. ITALY OIL & GAS SENSORS MARKET ANALYSIS BY END USE
      187. FIGURE 38. ITALY OIL & GAS SENSORS MARKET ANALYSIS BY REGIONAL
      188. FIGURE 39. SPAIN OIL & GAS SENSORS MARKET ANALYSIS BY TYPE
      189. FIGURE 40. SPAIN OIL & GAS SENSORS MARKET ANALYSIS BY APPLICATION
      190. FIGURE 41. SPAIN OIL & GAS SENSORS MARKET ANALYSIS BY TECHNOLOGY
      191. FIGURE 42. SPAIN OIL & GAS SENSORS MARKET ANALYSIS BY END USE
      192. FIGURE 43. SPAIN OIL & GAS SENSORS MARKET ANALYSIS BY REGIONAL
      193. FIGURE 44. REST OF EUROPE OIL & GAS SENSORS MARKET ANALYSIS BY TYPE
      194. FIGURE 45. REST OF EUROPE OIL & GAS SENSORS MARKET ANALYSIS BY APPLICATION
      195. FIGURE 46. REST OF EUROPE OIL & GAS SENSORS MARKET ANALYSIS BY TECHNOLOGY
      196. FIGURE 47. REST OF EUROPE OIL & GAS SENSORS MARKET ANALYSIS BY END USE
      197. FIGURE 48. REST OF EUROPE OIL & GAS SENSORS MARKET ANALYSIS BY REGIONAL
      198. FIGURE 49. APAC OIL & GAS SENSORS MARKET ANALYSIS
      199. FIGURE 50. CHINA OIL & GAS SENSORS MARKET ANALYSIS BY TYPE
      200. FIGURE 51. CHINA OIL & GAS SENSORS MARKET ANALYSIS BY APPLICATION
      201. FIGURE 52. CHINA OIL & GAS SENSORS MARKET ANALYSIS BY TECHNOLOGY
      202. FIGURE 53. CHINA OIL & GAS SENSORS MARKET ANALYSIS BY END USE
      203. FIGURE 54. CHINA OIL & GAS SENSORS MARKET ANALYSIS BY REGIONAL
      204. FIGURE 55. INDIA OIL & GAS SENSORS MARKET ANALYSIS BY TYPE
      205. FIGURE 56. INDIA OIL & GAS SENSORS MARKET ANALYSIS BY APPLICATION
      206. FIGURE 57. INDIA OIL & GAS SENSORS MARKET ANALYSIS BY TECHNOLOGY
      207. FIGURE 58. INDIA OIL & GAS SENSORS MARKET ANALYSIS BY END USE
      208. FIGURE 59. INDIA OIL & GAS SENSORS MARKET ANALYSIS BY REGIONAL
      209. FIGURE 60. JAPAN OIL & GAS SENSORS MARKET ANALYSIS BY TYPE
      210. FIGURE 61. JAPAN OIL & GAS SENSORS MARKET ANALYSIS BY APPLICATION
      211. FIGURE 62. JAPAN OIL & GAS SENSORS MARKET ANALYSIS BY TECHNOLOGY
      212. FIGURE 63. JAPAN OIL & GAS SENSORS MARKET ANALYSIS BY END USE
      213. FIGURE 64. JAPAN OIL & GAS SENSORS MARKET ANALYSIS BY REGIONAL
      214. FIGURE 65. SOUTH KOREA OIL & GAS SENSORS MARKET ANALYSIS BY TYPE
      215. FIGURE 66. SOUTH KOREA OIL & GAS SENSORS MARKET ANALYSIS BY APPLICATION
      216. FIGURE 67. SOUTH KOREA OIL & GAS SENSORS MARKET ANALYSIS BY TECHNOLOGY
      217. FIGURE 68. SOUTH KOREA OIL & GAS SENSORS MARKET ANALYSIS BY END USE
      218. FIGURE 69. SOUTH KOREA OIL & GAS SENSORS MARKET ANALYSIS BY REGIONAL
      219. FIGURE 70. MALAYSIA OIL & GAS SENSORS MARKET ANALYSIS BY TYPE
      220. FIGURE 71. MALAYSIA OIL & GAS SENSORS MARKET ANALYSIS BY APPLICATION
      221. FIGURE 72. MALAYSIA OIL & GAS SENSORS MARKET ANALYSIS BY TECHNOLOGY
      222. FIGURE 73. MALAYSIA OIL & GAS SENSORS MARKET ANALYSIS BY END USE
      223. FIGURE 74. MALAYSIA OIL & GAS SENSORS MARKET ANALYSIS BY REGIONAL
      224. FIGURE 75. THAILAND OIL & GAS SENSORS MARKET ANALYSIS BY TYPE
      225. FIGURE 76. THAILAND OIL & GAS SENSORS MARKET ANALYSIS BY APPLICATION
      226. FIGURE 77. THAILAND OIL & GAS SENSORS MARKET ANALYSIS BY TECHNOLOGY
      227. FIGURE 78. THAILAND OIL & GAS SENSORS MARKET ANALYSIS BY END USE
      228. FIGURE 79. THAILAND OIL & GAS SENSORS MARKET ANALYSIS BY REGIONAL
      229. FIGURE 80. INDONESIA OIL & GAS SENSORS MARKET ANALYSIS BY TYPE
      230. FIGURE 81. INDONESIA OIL & GAS SENSORS MARKET ANALYSIS BY APPLICATION
      231. FIGURE 82. INDONESIA OIL & GAS SENSORS MARKET ANALYSIS BY TECHNOLOGY
      232. FIGURE 83. INDONESIA OIL & GAS SENSORS MARKET ANALYSIS BY END USE
      233. FIGURE 84. INDONESIA OIL & GAS SENSORS MARKET ANALYSIS BY REGIONAL
      234. FIGURE 85. REST OF APAC OIL & GAS SENSORS MARKET ANALYSIS BY TYPE
      235. FIGURE 86. REST OF APAC OIL & GAS SENSORS MARKET ANALYSIS BY APPLICATION
      236. FIGURE 87. REST OF APAC OIL & GAS SENSORS MARKET ANALYSIS BY TECHNOLOGY
      237. FIGURE 88. REST OF APAC OIL & GAS SENSORS MARKET ANALYSIS BY END USE
      238. FIGURE 89. REST OF APAC OIL & GAS SENSORS MARKET ANALYSIS BY REGIONAL
      239. FIGURE 90. SOUTH AMERICA OIL & GAS SENSORS MARKET ANALYSIS
      240. FIGURE 91. BRAZIL OIL & GAS SENSORS MARKET ANALYSIS BY TYPE
      241. FIGURE 92. BRAZIL OIL & GAS SENSORS MARKET ANALYSIS BY APPLICATION
      242. FIGURE 93. BRAZIL OIL & GAS SENSORS MARKET ANALYSIS BY TECHNOLOGY
      243. FIGURE 94. BRAZIL OIL & GAS SENSORS MARKET ANALYSIS BY END USE
      244. FIGURE 95. BRAZIL OIL & GAS SENSORS MARKET ANALYSIS BY REGIONAL
      245. FIGURE 96. MEXICO OIL & GAS SENSORS MARKET ANALYSIS BY TYPE
      246. FIGURE 97. MEXICO OIL & GAS SENSORS MARKET ANALYSIS BY APPLICATION
      247. FIGURE 98. MEXICO OIL & GAS SENSORS MARKET ANALYSIS BY TECHNOLOGY
      248. FIGURE 99. MEXICO OIL & GAS SENSORS MARKET ANALYSIS BY END USE
      249. FIGURE 100. MEXICO OIL & GAS SENSORS MARKET ANALYSIS BY REGIONAL
      250. FIGURE 101. ARGENTINA OIL & GAS SENSORS MARKET ANALYSIS BY TYPE
      251. FIGURE 102. ARGENTINA OIL & GAS SENSORS MARKET ANALYSIS BY APPLICATION
      252. FIGURE 103. ARGENTINA OIL & GAS SENSORS MARKET ANALYSIS BY TECHNOLOGY
      253. FIGURE 104. ARGENTINA OIL & GAS SENSORS MARKET ANALYSIS BY END USE
      254. FIGURE 105. ARGENTINA OIL & GAS SENSORS MARKET ANALYSIS BY REGIONAL
      255. FIGURE 106. REST OF SOUTH AMERICA OIL & GAS SENSORS MARKET ANALYSIS BY TYPE
      256. FIGURE 107. REST OF SOUTH AMERICA OIL & GAS SENSORS MARKET ANALYSIS BY APPLICATION
      257. FIGURE 108. REST OF SOUTH AMERICA OIL & GAS SENSORS MARKET ANALYSIS BY TECHNOLOGY
      258. FIGURE 109. REST OF SOUTH AMERICA OIL & GAS SENSORS MARKET ANALYSIS BY END USE
      259. FIGURE 110. REST OF SOUTH AMERICA OIL & GAS SENSORS MARKET ANALYSIS BY REGIONAL
      260. FIGURE 111. MEA OIL & GAS SENSORS MARKET ANALYSIS
      261. FIGURE 112. GCC COUNTRIES OIL & GAS SENSORS MARKET ANALYSIS BY TYPE
      262. FIGURE 113. GCC COUNTRIES OIL & GAS SENSORS MARKET ANALYSIS BY APPLICATION
      263. FIGURE 114. GCC COUNTRIES OIL & GAS SENSORS MARKET ANALYSIS BY TECHNOLOGY
      264. FIGURE 115. GCC COUNTRIES OIL & GAS SENSORS MARKET ANALYSIS BY END USE
      265. FIGURE 116. GCC COUNTRIES OIL & GAS SENSORS MARKET ANALYSIS BY REGIONAL
      266. FIGURE 117. SOUTH AFRICA OIL & GAS SENSORS MARKET ANALYSIS BY TYPE
      267. FIGURE 118. SOUTH AFRICA OIL & GAS SENSORS MARKET ANALYSIS BY APPLICATION
      268. FIGURE 119. SOUTH AFRICA OIL & GAS SENSORS MARKET ANALYSIS BY TECHNOLOGY
      269. FIGURE 120. SOUTH AFRICA OIL & GAS SENSORS MARKET ANALYSIS BY END USE
      270. FIGURE 121. SOUTH AFRICA OIL & GAS SENSORS MARKET ANALYSIS BY REGIONAL
      271. FIGURE 122. REST OF MEA OIL & GAS SENSORS MARKET ANALYSIS BY TYPE
      272. FIGURE 123. REST OF MEA OIL & GAS SENSORS MARKET ANALYSIS BY APPLICATION
      273. FIGURE 124. REST OF MEA OIL & GAS SENSORS MARKET ANALYSIS BY TECHNOLOGY
      274. FIGURE 125. REST OF MEA OIL & GAS SENSORS MARKET ANALYSIS BY END USE
      275. FIGURE 126. REST OF MEA OIL & GAS SENSORS MARKET ANALYSIS BY REGIONAL
      276. FIGURE 127. KEY BUYING CRITERIA OF OIL & GAS SENSORS MARKET
      277. FIGURE 128. RESEARCH PROCESS OF MRFR
      278. FIGURE 129. DRO ANALYSIS OF OIL & GAS SENSORS MARKET
      279. FIGURE 130. DRIVERS IMPACT ANALYSIS: OIL & GAS SENSORS MARKET
      280. FIGURE 131. RESTRAINTS IMPACT ANALYSIS: OIL & GAS SENSORS MARKET
      281. FIGURE 132. SUPPLY / VALUE CHAIN: OIL & GAS SENSORS MARKET
      282. FIGURE 133. OIL & GAS SENSORS MARKET, BY TYPE, 2024 (% SHARE)
      283. FIGURE 134. OIL & GAS SENSORS MARKET, BY TYPE, 2019 TO 2032 (USD Billions)
      284. FIGURE 135. OIL & GAS SENSORS MARKET, BY APPLICATION, 2024 (% SHARE)
      285. FIGURE 136. OIL & GAS SENSORS MARKET, BY APPLICATION, 2019 TO 2032 (USD Billions)
      286. FIGURE 137. OIL & GAS SENSORS MARKET, BY TECHNOLOGY, 2024 (% SHARE)
      287. FIGURE 138. OIL & GAS SENSORS MARKET, BY TECHNOLOGY, 2019 TO 2032 (USD Billions)
      288. FIGURE 139. OIL & GAS SENSORS MARKET, BY END USE, 2024 (% SHARE)
      289. FIGURE 140. OIL & GAS SENSORS MARKET, BY END USE, 2019 TO 2032 (USD Billions)
      290. FIGURE 141. 
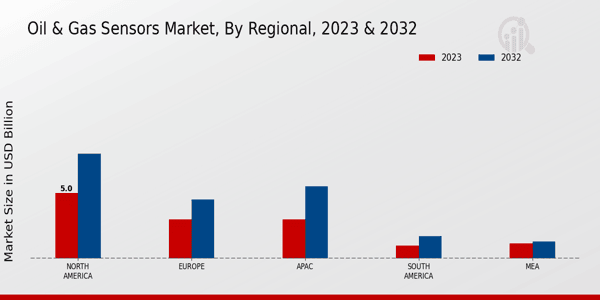
OIL & GAS SENSORS MARKET, BY REGIONAL, 2024 (% SHARE)
      291. FIGURE 142. OIL & GAS SENSORS MARKET, BY REGIONAL, 2019 TO 2032 (USD Billions)
      292. FIGURE 143. BENCHMARKING OF MAJOR COMPETITORS

    Oil Gas Sensors Market Segmentation

    • Oil Gas Sensors Market By Type (USD Billion, 2019-2032)

      • Pressure Sensors
      • Temperature Sensors
      • Flow Sensors
      • Level Sensors
      • Chemical Sensors
    • Oil Gas Sensors Market By Application (USD Billion, 2019-2032)

      • Upstream
      • Midstream
      • Downstream
      • Refining
      • Processing
    • Oil Gas Sensors Market By Technology (USD Billion, 2019-2032)

      • Wireless Sensors
      • Wired Sensors
      • Smart Sensors
      • Optical Sensors
    • Oil Gas Sensors Market By End Use (USD Billion, 2019-2032)

      • Onshore
      • Offshore
    • Oil Gas Sensors Market By Regional (USD Billion, 2019-2032)

      • North America
      • Europe
      • South America
      • Asia Pacific
      • Middle East and Africa

    Oil Gas Sensors Market Regional Outlook (USD Billion, 2019-2032)

    • North America Outlook (USD Billion, 2019-2032)

      • North America Oil Gas Sensors Market by Type

        • Pressure Sensors
        • Temperature Sensors
        • Flow Sensors
        • Level Sensors
        • Chemical Sensors
      • North America Oil Gas Sensors Market by Application Type

        • Upstream
        • Midstream
        • Downstream
        • Refining
        • Processing
      • North America Oil Gas Sensors Market by Technology Type

        • Wireless Sensors
        • Wired Sensors
        • Smart Sensors
        • Optical Sensors
      • North America Oil Gas Sensors Market by End Use Type

        • Onshore
        • Offshore
      • North America Oil Gas Sensors Market by Regional Type

        • US
        • Canada
      • US Outlook (USD Billion, 2019-2032)
      • US Oil Gas Sensors Market by Type

        • Pressure Sensors
        • Temperature Sensors
        • Flow Sensors
        • Level Sensors
        • Chemical Sensors
      • US Oil Gas Sensors Market by Application Type

        • Upstream
        • Midstream
        • Downstream
        • Refining
        • Processing
      • US Oil Gas Sensors Market by Technology Type

        • Wireless Sensors
        • Wired Sensors
        • Smart Sensors
        • Optical Sensors
      • US Oil Gas Sensors Market by End Use Type

        • Onshore
        • Offshore
      • CANADA Outlook (USD Billion, 2019-2032)
      • CANADA Oil Gas Sensors Market by Type

        • Pressure Sensors
        • Temperature Sensors
        • Flow Sensors
        • Level Sensors
        • Chemical Sensors
      • CANADA Oil Gas Sensors Market by Application Type

        • Upstream
        • Midstream
        • Downstream
        • Refining
        • Processing
      • CANADA Oil Gas Sensors Market by Technology Type

        • Wireless Sensors
        • Wired Sensors
        • Smart Sensors
        • Optical Sensors
      • CANADA Oil Gas Sensors Market by End Use Type

        • Onshore
        • Offshore
    • Europe Outlook (USD Billion, 2019-2032)

      • Europe Oil Gas Sensors Market by Type

        • Pressure Sensors
        • Temperature Sensors
        • Flow Sensors
        • Level Sensors
        • Chemical Sensors
      • Europe Oil Gas Sensors Market by Application Type

        • Upstream
        • Midstream
        • Downstream
        • Refining
        • Processing
      • Europe Oil Gas Sensors Market by Technology Type

        • Wireless Sensors
        • Wired Sensors
        • Smart Sensors
        • Optical Sensors
      • Europe Oil Gas Sensors Market by End Use Type

        • Onshore
        • Offshore
      • Europe Oil Gas Sensors Market by Regional Type

        • Germany
        • UK
        • France
        • Russia
        • Italy
        • Spain
        • Rest of Europe
      • GERMANY Outlook (USD Billion, 2019-2032)
      • GERMANY Oil Gas Sensors Market by Type

        • Pressure Sensors
        • Temperature Sensors
        • Flow Sensors
        • Level Sensors
        • Chemical Sensors
      • GERMANY Oil Gas Sensors Market by Application Type

        • Upstream
        • Midstream
        • Downstream
        • Refining
        • Processing
      • GERMANY Oil Gas Sensors Market by Technology Type

        • Wireless Sensors
        • Wired Sensors
        • Smart Sensors
        • Optical Sensors
      • GERMANY Oil Gas Sensors Market by End Use Type

        • Onshore
        • Offshore
      • UK Outlook (USD Billion, 2019-2032)
      • UK Oil Gas Sensors Market by Type

        • Pressure Sensors
        • Temperature Sensors
        • Flow Sensors
        • Level Sensors
        • Chemical Sensors
      • UK Oil Gas Sensors Market by Application Type

        • Upstream
        • Midstream
        • Downstream
        • Refining
        • Processing
      • UK Oil Gas Sensors Market by Technology Type

        • Wireless Sensors
        • Wired Sensors
        • Smart Sensors
        • Optical Sensors
      • UK Oil Gas Sensors Market by End Use Type

        • Onshore
        • Offshore
      • FRANCE Outlook (USD Billion, 2019-2032)
      • FRANCE Oil Gas Sensors Market by Type

        • Pressure Sensors
        • Temperature Sensors
        • Flow Sensors
        • Level Sensors
        • Chemical Sensors
      • FRANCE Oil Gas Sensors Market by Application Type

        • Upstream
        • Midstream
        • Downstream
        • Refining
        • Processing
      • FRANCE Oil Gas Sensors Market by Technology Type

        • Wireless Sensors
        • Wired Sensors
        • Smart Sensors
        • Optical Sensors
      • FRANCE Oil Gas Sensors Market by End Use Type

        • Onshore
        • Offshore
      • RUSSIA Outlook (USD Billion, 2019-2032)
      • RUSSIA Oil Gas Sensors Market by Type

        • Pressure Sensors
        • Temperature Sensors
        • Flow Sensors
        • Level Sensors
        • Chemical Sensors
      • RUSSIA Oil Gas Sensors Market by Application Type

        • Upstream
        • Midstream
        • Downstream
        • Refining
        • Processing
      • RUSSIA Oil Gas Sensors Market by Technology Type

        • Wireless Sensors
        • Wired Sensors
        • Smart Sensors
        • Optical Sensors
      • RUSSIA Oil Gas Sensors Market by End Use Type

        • Onshore
        • Offshore
      • ITALY Outlook (USD Billion, 2019-2032)
      • ITALY Oil Gas Sensors Market by Type

        • Pressure Sensors
        • Temperature Sensors
        • Flow Sensors
        • Level Sensors
        • Chemical Sensors
      • ITALY Oil Gas Sensors Market by Application Type

        • Upstream
        • Midstream
        • Downstream
        • Refining
        • Processing
      • ITALY Oil Gas Sensors Market by Technology Type

        • Wireless Sensors
        • Wired Sensors
        • Smart Sensors
        • Optical Sensors
      • ITALY Oil Gas Sensors Market by End Use Type

        • Onshore
        • Offshore
      • SPAIN Outlook (USD Billion, 2019-2032)
      • SPAIN Oil Gas Sensors Market by Type

        • Pressure Sensors
        • Temperature Sensors
        • Flow Sensors
        • Level Sensors
        • Chemical Sensors
      • SPAIN Oil Gas Sensors Market by Application Type

        • Upstream
        • Midstream
        • Downstream
        • Refining
        • Processing
      • SPAIN Oil Gas Sensors Market by Technology Type

        • Wireless Sensors
        • Wired Sensors
        • Smart Sensors
        • Optical Sensors
      • SPAIN Oil Gas Sensors Market by End Use Type

        • Onshore
        • Offshore
      • REST OF EUROPE Outlook (USD Billion, 2019-2032)
      • REST OF EUROPE Oil Gas Sensors Market by Type

        • Pressure Sensors
        • Temperature Sensors
        • Flow Sensors
        • Level Sensors
        • Chemical Sensors
      • REST OF EUROPE Oil Gas Sensors Market by Application Type

        • Upstream
        • Midstream
        • Downstream
        • Refining
        • Processing
      • REST OF EUROPE Oil Gas Sensors Market by Technology Type

        • Wireless Sensors
        • Wired Sensors
        • Smart Sensors
        • Optical Sensors
      • REST OF EUROPE Oil Gas Sensors Market by End Use Type

        • Onshore
        • Offshore
    • APAC Outlook (USD Billion, 2019-2032)

      • APAC Oil Gas Sensors Market by Type

        • Pressure Sensors
        • Temperature Sensors
        • Flow Sensors
        • Level Sensors
        • Chemical Sensors
      • APAC Oil Gas Sensors Market by Application Type

        • Upstream
        • Midstream
        • Downstream
        • Refining
        • Processing
      • APAC Oil Gas Sensors Market by Technology Type

        • Wireless Sensors
        • Wired Sensors
        • Smart Sensors
        • Optical Sensors
      • APAC Oil Gas Sensors Market by End Use Type

        • Onshore
        • Offshore
      • APAC Oil Gas Sensors Market by Regional Type

        • China
        • India
        • Japan
        • South Korea
        • Malaysia
        • Thailand
        • Indonesia
        • Rest of APAC
      • CHINA Outlook (USD Billion, 2019-2032)
      • CHINA Oil Gas Sensors Market by Type

        • Pressure Sensors
        • Temperature Sensors
        • Flow Sensors
        • Level Sensors
        • Chemical Sensors
      • CHINA Oil Gas Sensors Market by Application Type

        • Upstream
        • Midstream
        • Downstream
        • Refining
        • Processing
      • CHINA Oil Gas Sensors Market by Technology Type

        • Wireless Sensors
        • Wired Sensors
        • Smart Sensors
        • Optical Sensors
      • CHINA Oil Gas Sensors Market by End Use Type

        • Onshore
        • Offshore
      • INDIA Outlook (USD Billion, 2019-2032)
      • INDIA Oil Gas Sensors Market by Type

        • Pressure Sensors
        • Temperature Sensors
        • Flow Sensors
        • Level Sensors
        • Chemical Sensors
      • INDIA Oil Gas Sensors Market by Application Type

        • Upstream
        • Midstream
        • Downstream
        • Refining
        • Processing
      • INDIA Oil Gas Sensors Market by Technology Type

        • Wireless Sensors
        • Wired Sensors
        • Smart Sensors
        • Optical Sensors
      • INDIA Oil Gas Sensors Market by End Use Type

        • Onshore
        • Offshore
      • JAPAN Outlook (USD Billion, 2019-2032)
      • JAPAN Oil Gas Sensors Market by Type

        • Pressure Sensors
        • Temperature Sensors
        • Flow Sensors
        • Level Sensors
        • Chemical Sensors
      • JAPAN Oil Gas Sensors Market by Application Type

        • Upstream
        • Midstream
        • Downstream
        • Refining
        • Processing
      • JAPAN Oil Gas Sensors Market by Technology Type

        • Wireless Sensors
        • Wired Sensors
        • Smart Sensors
        • Optical Sensors
      • JAPAN Oil Gas Sensors Market by End Use Type

        • Onshore
        • Offshore
      • SOUTH KOREA Outlook (USD Billion, 2019-2032)
      • SOUTH KOREA Oil Gas Sensors Market by Type

        • Pressure Sensors
        • Temperature Sensors
        • Flow Sensors
        • Level Sensors
        • Chemical Sensors
      • SOUTH KOREA Oil Gas Sensors Market by Application Type

        • Upstream
        • Midstream
        • Downstream
        • Refining
        • Processing
      • SOUTH KOREA Oil Gas Sensors Market by Technology Type

        • Wireless Sensors
        • Wired Sensors
        • Smart Sensors
        • Optical Sensors
      • SOUTH KOREA Oil Gas Sensors Market by End Use Type

        • Onshore
        • Offshore
      • MALAYSIA Outlook (USD Billion, 2019-2032)
      • MALAYSIA Oil Gas Sensors Market by Type

        • Pressure Sensors
        • Temperature Sensors
        • Flow Sensors
        • Level Sensors
        • Chemical Sensors
      • MALAYSIA Oil Gas Sensors Market by Application Type

        • Upstream
        • Midstream
        • Downstream
        • Refining
        • Processing
      • MALAYSIA Oil Gas Sensors Market by Technology Type

        • Wireless Sensors
        • Wired Sensors
        • Smart Sensors
        • Optical Sensors
      • MALAYSIA Oil Gas Sensors Market by End Use Type

        • Onshore
        • Offshore
      • THAILAND Outlook (USD Billion, 2019-2032)
      • THAILAND Oil Gas Sensors Market by Type

        • Pressure Sensors
        • Temperature Sensors
        • Flow Sensors
        • Level Sensors
        • Chemical Sensors
      • THAILAND Oil Gas Sensors Market by Application Type

        • Upstream
        • Midstream
        • Downstream
        • Refining
        • Processing
      • THAILAND Oil Gas Sensors Market by Technology Type

        • Wireless Sensors
        • Wired Sensors
        • Smart Sensors
        • Optical Sensors
      • THAILAND Oil Gas Sensors Market by End Use Type

        • Onshore
        • Offshore
      • INDONESIA Outlook (USD Billion, 2019-2032)
      • INDONESIA Oil Gas Sensors Market by Type

        • Pressure Sensors
        • Temperature Sensors
        • Flow Sensors
        • Level Sensors
        • Chemical Sensors
      • INDONESIA Oil Gas Sensors Market by Application Type

        • Upstream
        • Midstream
        • Downstream
        • Refining
        • Processing
      • INDONESIA Oil Gas Sensors Market by Technology Type

        • Wireless Sensors
        • Wired Sensors
        • Smart Sensors
        • Optical Sensors
      • INDONESIA Oil Gas Sensors Market by End Use Type

        • Onshore
        • Offshore
      • REST OF APAC Outlook (USD Billion, 2019-2032)
      • REST OF APAC Oil Gas Sensors Market by Type

        • Pressure Sensors
        • Temperature Sensors
        • Flow Sensors
        • Level Sensors
        • Chemical Sensors
      • REST OF APAC Oil Gas Sensors Market by Application Type

        • Upstream
        • Midstream
        • Downstream
        • Refining
        • Processing
      • REST OF APAC Oil Gas Sensors Market by Technology Type

        • Wireless Sensors
        • Wired Sensors
        • Smart Sensors
        • Optical Sensors
      • REST OF APAC Oil Gas Sensors Market by End Use Type

        • Onshore
        • Offshore
    • South America Outlook (USD Billion, 2019-2032)

      • South America Oil Gas Sensors Market by Type

        • Pressure Sensors
        • Temperature Sensors
        • Flow Sensors
        • Level Sensors
        • Chemical Sensors
      • South America Oil Gas Sensors Market by Application Type

        • Upstream
        • Midstream
        • Downstream
        • Refining
        • Processing
      • South America Oil Gas Sensors Market by Technology Type

        • Wireless Sensors
        • Wired Sensors
        • Smart Sensors
        • Optical Sensors
      • South America Oil Gas Sensors Market by End Use Type

        • Onshore
        • Offshore
      • South America Oil Gas Sensors Market by Regional Type

        • Brazil
        • Mexico
        • Argentina
        • Rest of South America
      • BRAZIL Outlook (USD Billion, 2019-2032)
      • BRAZIL Oil Gas Sensors Market by Type

        • Pressure Sensors
        • Temperature Sensors
        • Flow Sensors
        • Level Sensors
        • Chemical Sensors
      • BRAZIL Oil Gas Sensors Market by Application Type

        • Upstream
        • Midstream
        • Downstream
        • Refining
        • Processing
      • BRAZIL Oil Gas Sensors Market by Technology Type

        • Wireless Sensors
        • Wired Sensors
        • Smart Sensors
        • Optical Sensors
      • BRAZIL Oil Gas Sensors Market by End Use Type

        • Onshore
        • Offshore
      • MEXICO Outlook (USD Billion, 2019-2032)
      • MEXICO Oil Gas Sensors Market by Type

        • Pressure Sensors
        • Temperature Sensors
        • Flow Sensors
        • Level Sensors
        • Chemical Sensors
      • MEXICO Oil Gas Sensors Market by Application Type

        • Upstream
        • Midstream
        • Downstream
        • Refining
        • Processing
      • MEXICO Oil Gas Sensors Market by Technology Type

        • Wireless Sensors
        • Wired Sensors
        • Smart Sensors
        • Optical Sensors
      • MEXICO Oil Gas Sensors Market by End Use Type

        • Onshore
        • Offshore
      • ARGENTINA Outlook (USD Billion, 2019-2032)
      • ARGENTINA Oil Gas Sensors Market by Type

        • Pressure Sensors
        • Temperature Sensors
        • Flow Sensors
        • Level Sensors
        • Chemical Sensors
      • ARGENTINA Oil Gas Sensors Market by Application Type

        • Upstream
        • Midstream
        • Downstream
        • Refining
        • Processing
      • ARGENTINA Oil Gas Sensors Market by Technology Type

        • Wireless Sensors
        • Wired Sensors
        • Smart Sensors
        • Optical Sensors
      • ARGENTINA Oil Gas Sensors Market by End Use Type

        • Onshore
        • Offshore
      • REST OF SOUTH AMERICA Outlook (USD Billion, 2019-2032)
      • REST OF SOUTH AMERICA Oil Gas Sensors Market by Type

        • Pressure Sensors
        • Temperature Sensors
        • Flow Sensors
        • Level Sensors
        • Chemical Sensors
      • REST OF SOUTH AMERICA Oil Gas Sensors Market by Application Type

        • Upstream
        • Midstream
        • Downstream
        • Refining
        • Processing
      • REST OF SOUTH AMERICA Oil Gas Sensors Market by Technology Type

        • Wireless Sensors
        • Wired Sensors
        • Smart Sensors
        • Optical Sensors
      • REST OF SOUTH AMERICA Oil Gas Sensors Market by End Use Type

        • Onshore
        • Offshore
    • MEA Outlook (USD Billion, 2019-2032)

      • MEA Oil Gas Sensors Market by Type

        • Pressure Sensors
        • Temperature Sensors
        • Flow Sensors
        • Level Sensors
        • Chemical Sensors
      • MEA Oil Gas Sensors Market by Application Type

        • Upstream
        • Midstream
        • Downstream
        • Refining
        • Processing
      • MEA Oil Gas Sensors Market by Technology Type

        • Wireless Sensors
        • Wired Sensors
        • Smart Sensors
        • Optical Sensors
      • MEA Oil Gas Sensors Market by End Use Type

        • Onshore
        • Offshore
      • MEA Oil Gas Sensors Market by Regional Type

        • GCC Countries
        • South Africa
        • Rest of MEA
      • GCC COUNTRIES Outlook (USD Billion, 2019-2032)
      • GCC COUNTRIES Oil Gas Sensors Market by Type

        • Pressure Sensors
        • Temperature Sensors
        • Flow Sensors
        • Level Sensors
        • Chemical Sensors
      • GCC COUNTRIES Oil Gas Sensors Market by Application Type

        • Upstream
        • Midstream
        • Downstream
        • Refining
        • Processing
      • GCC COUNTRIES Oil Gas Sensors Market by Technology Type

        • Wireless Sensors
        • Wired Sensors
        • Smart Sensors
        • Optical Sensors
      • GCC COUNTRIES Oil Gas Sensors Market by End Use Type

        • Onshore
        • Offshore
      • SOUTH AFRICA Outlook (USD Billion, 2019-2032)
      • SOUTH AFRICA Oil Gas Sensors Market by Type

        • Pressure Sensors
        • Temperature Sensors
        • Flow Sensors
        • Level Sensors
        • Chemical Sensors
      • SOUTH AFRICA Oil Gas Sensors Market by Application Type

        • Upstream
        • Midstream
        • Downstream
        • Refining
        • Processing
      • SOUTH AFRICA Oil Gas Sensors Market by Technology Type

        • Wireless Sensors
        • Wired Sensors
        • Smart Sensors
        • Optical Sensors
      • SOUTH AFRICA Oil Gas Sensors Market by End Use Type

        • Onshore
        • Offshore
      • REST OF MEA Outlook (USD Billion, 2019-2032)
      • REST OF MEA Oil Gas Sensors Market by Type

        • Pressure Sensors
        • Temperature Sensors
        • Flow Sensors
        • Level Sensors
        • Chemical Sensors
      • REST OF MEA Oil Gas Sensors Market by Application Type

        • Upstream
        • Midstream
        • Downstream
        • Refining
        • Processing
      • REST OF MEA Oil Gas Sensors Market by Technology Type

        • Wireless Sensors
        • Wired Sensors
        • Smart Sensors
        • Optical Sensors
      • REST OF MEA Oil Gas Sensors Market by End Use Type

        • Onshore
        • Offshore


    Infographic

    Free Sample Request

    Kindly complete the form below to receive a free sample of this Report

    Get Free Sample

    Customer Strories

    “I am very pleased with how market segments have been defined in a relevant way for my purposes (such as "Portable Freezers & refrigerators" and "last-mile"). In general the report is well structured. Thanks very much for your efforts.”

    Victoria Milne

    Founder
    Case Study
    Chemicals and Materials