• Cat-intel
  • MedIntelliX
  • Resources
  • About Us
  • Hero Background
    English
    Chinese
    French
    Japanese
    Korean
    German
    Spanish

    PCB Design Software Market Trends

    ID: MRFR/ICT/4644-CR
    100 Pages
    Ankit Gupta
    May 2023

    PCB Design Software Market Research Report: Information By Component (Software/Tools (PCB CAM, Spice, Cable/Wire Harness, PCB Analytics Tools, AI), and Services), Design Complexities (Low-End Design, Medium-End Design, High-End Design), Type (PCB Layout, Schematic Capture), Deployment Type (Cloud, and On-Premise), Industry (Transportation, Consumer Electronics, Telecommunication, Semiconductors...

    Share:
    Download PDF ×

    We do not share your information with anyone. However, we may send you emails based on your report interest from time to time. You may contact us at any time to opt-out.

    PCB Design Software Market Infographic
    $ 4,950.0
    $ 5,950.0
    $ 7,250.0

    Market Trends

    Key Emerging Trends in the PCB Design Software Market

    PCB design software offers engineers the flexibility to simulate the current design on a computer, allowing them to identify and address issues in real-time. The software provides access to advanced features like auto-placement, auto-routing, and auto-tuning, streamlining the PCB fabrication process and accelerating production. This technology addresses traditional challenges in the PCB industry, such as input signals, desired output, and error tolerance, contributing significantly to industry growth. The increasing demand for PCBs from end-users is exerting substantial pressure on PCB manufacturers. To efficiently design PCBs, manage costs, deliver feature-rich products, achieve product differentiation, and expedite time-to-market, companies are intensifying their investments in the PCB design process. This strategic focus on PCB design is a key driver propelling the growth of the PCB design software market. An illustrative example is the system design tool feature in PCB design software, which facilitates defining and partitioning electronic systems from a logical abstract level to the PCB. Over 33% of best-in-class companies extensively use this software enabler, surpassing the industry average. Virtual prototyping is another heavily utilized feature among PCB manufacturers, minimizing re-spins and enabling the design of higher quality products at faster rates. This tool has become a standard part of product design for many companies, making PCB design software essential for numerous PCB providers. Furthermore, additional features such as design for manufacturability, design collaboration, and design data management are enhancing the necessity of this software, driving market growth globally. The capability to optimize designs for manufacturing, collaborate seamlessly on design projects, and efficiently manage design data has become crucial for the PCB industry. In conclusion, the adoption of PCB design software is instrumental in addressing industry challenges and driving efficiency in the PCB fabrication process. The market is propelled by the increasing demand for PCBs, leading companies to invest significantly in PCB design to meet various requirements such as cost-effectiveness, product differentiation, and swift time-to-market. The extensive use of features like system design tools and virtual prototyping highlights the integral role of PCB design software in the contemporary landscape of electronic product development.

    Market Summary

    As per Market Research Future Analysis, the PCB Design Software Market is projected to grow from USD 1966.92 Million in 2024 to USD 6736.62 Million by 2035, with a CAGR of 11.84% during the forecast period. The market was valued at USD 1966.92 Million in 2024. The growth is driven by the need to streamline product development and the extensive application of PCBs across various industries. Post-COVID-19, the market size was USD 1966.92 Million in 2024, indicating resilience despite economic challenges. The demand for integrated software solutions is increasing, with Altium leading in market share due to its comprehensive offerings.

    Key Market Trends & Highlights

    Key trends influencing the PCB Design Software Market include technological advancements and increasing demand across industries.

    • Market Size in 2024: USD 1966.92 Million; projected to reach USD 6736.62 Million by 2035. CAGR from 2025 to 2035: 11.84%; indicating robust growth post-pandemic. Largest market share by component: Software/Tools segment in 2022. Telecommunication industry holds the largest market share in PCB Design Software.

    Market Size & Forecast

    2024 Market Size USD 1966.92 Million
    2035 Market Size USD 6736.62 Million
    CAGR (2024-2035) 11.84%
    Largest Regional Market Share in 2024 North America

    Major Players

    <p>Cadence Design Systems, Inc.; Mentor Graphics; ZUKEN INC.; Altium Limited; CadSoft Computer Inc.; Novarm; Shanghai Tsingyue Software Co., Ltd; Forte Design Systems, Inc.; Synopsys, Inc.; Dassault Systemes SE; Ansys, Inc.</p>

    Market Trends

    <p>The ongoing evolution of technology and increasing demand for miniaturized electronic devices appear to drive the growth of the PCB design software market, reflecting a broader trend towards enhanced efficiency and innovation in electronic design processes.</p>

    U.S. Department of Commerce

    PCB Design Software Market Market Drivers

    Market Growth Projections

    The Global PCB Design Software Market Industry is projected to experience substantial growth over the next decade. With a market size of 1.97 USD Billion in 2024, it is anticipated to reach 6.74 USD Billion by 2035. This growth trajectory reflects a compound annual growth rate (CAGR) of 11.84% from 2025 to 2035, indicating a robust demand for PCB design solutions across various industries. Factors contributing to this growth include advancements in technology, increasing complexity of electronic devices, and the rising need for efficient design processes. As industries continue to innovate, the demand for PCB design software is likely to remain strong.

    Emergence of 5G Technology

    The rollout of 5G technology is poised to revolutionize telecommunications, creating substantial opportunities for the Global PCB Design Software Market Industry. The demand for high-speed data transfer and low latency necessitates the development of advanced PCBs that can handle the complexities of 5G infrastructure. As telecommunications companies invest heavily in 5G networks, the requirement for sophisticated PCB design software becomes increasingly apparent. This technological advancement is likely to drive market growth, as companies seek to optimize their designs for 5G applications, ensuring that they remain competitive in a rapidly evolving landscape.

    Growth of IoT Applications

    The proliferation of Internet of Things (IoT) devices significantly influences the Global PCB Design Software Market Industry. As more devices become interconnected, the demand for efficient and reliable PCB designs escalates. IoT applications require PCBs that can support wireless communication, sensor integration, and energy efficiency. The increasing adoption of IoT across various sectors, including healthcare, agriculture, and smart cities, drives the need for advanced PCB design tools. This trend suggests that the market will continue to expand, with a projected CAGR of 11.84% from 2025 to 2035, highlighting the importance of PCB design software in facilitating IoT innovations.

    Increased Focus on Miniaturization

    The trend towards miniaturization in electronics is a significant driver for the Global PCB Design Software Market Industry. As devices become smaller and more compact, the need for PCB design software that can facilitate high-density designs and multi-layer boards becomes paramount. This trend is particularly evident in sectors such as wearables and portable electronics, where space constraints are critical. The ability to create intricate designs that maximize functionality while minimizing size is essential for manufacturers. As a result, the demand for advanced PCB design tools that support miniaturization efforts is expected to grow, further propelling the market forward.

    Advancements in Automotive Electronics

    The automotive industry is undergoing a significant transformation, with the integration of advanced electronics in vehicles. This shift is a key driver for the Global PCB Design Software Market Industry, as modern vehicles increasingly rely on PCBs for functionalities such as infotainment systems, safety features, and electric vehicle components. The anticipated growth in automotive electronics is expected to contribute to the market's expansion, with projections indicating a market size of 6.74 USD Billion by 2035. Consequently, PCB design software must evolve to meet the unique requirements of automotive applications, fostering innovation and enhancing design capabilities.

    Rising Demand for Consumer Electronics

    The Global PCB Design Software Market Industry experiences a notable surge in demand driven by the increasing production of consumer electronics. As devices become more sophisticated, the need for advanced PCB design software that can accommodate complex layouts and high-density interconnections becomes critical. For instance, the global consumer electronics market is projected to reach 1.97 USD Billion in 2024, indicating a robust growth trajectory. This trend necessitates the adoption of innovative PCB design solutions that enhance efficiency and reduce time-to-market, thereby propelling the growth of the PCB design software sector.

    Market Segment Insights

    PCB Design Software Components Insights

    <p>On the basis of components, the PCB Design Software market has been divided into Software/Tools and Services. The Software/Tools segment accounted for the largest market share in 2022 and is projected to remain the same during the projected time period. Software or tools are main component of this market which are used by professionals, educators, hobbyists, and others to make a graphic representation and PCB layout by component placement, routing, packaging design and verification to describe the electrical circuits manufactured on a board.</p>

    <p>These solutions are used by several industries comprising IT &amp; electronics, mobile devices, healthcare &amp;<a href="https://www.marketresearchfuture.com/reports/life-science-analytics-market-8570"> life science</a>, automotive, telecommunication, transport &amp; logistics, aerospace and defense, research &amp; education, industrial controls automation, and others. The software/tool segment is classified into PCB CAM, PCB SPICE, Cable/Wire Harness, PCB Analysis Tools and PCB AI.</p>

    <p>January 2022&nbsp;Altium launched Nexar, a cloud-based partner platform connecting Altium 365 users with software partners, board fabricators, service providers, component distributors, and manufacturers. Launch of Altimade is the next evolutionary step from the same vision, allowing designers to connect with prototyping and manufacturing partners directly from their design environment.</p>

    PCB Design Software Design Complexities Insights

    <p>Based on design complexities the PCB Design Software market, has been bifurcated into Low-End Design, Medium-End Design, and High-End Design. The high-end design has largest market share. The commercial or professional PCB packages are mostly utilized by professionals for high-end design. These packages have a high-quality design environment and are involved with high end PCB making consumer and military electronics. The commercial packages are containing various features, for instance, single length tuning, pair routing capability, high speed routing and others. Such packages are featured with built-in simulation solutions along with hierarchical schematic entry.</p>

    <p>Some of the best <a href="https://www.marketresearchfuture.com/reports/product-design-development-service-market-29597">high-end design software</a> vendors are Altium Limited, OrCAD, Mentor WG, Pulsonix, The national instruments, Cadence and other.</p>

    PCB Design Software Type Insights

    <p>On the basis of type, the PCB Design Software market has been segmented into PCB Layout and Schematic Capture. PCB layout has largest market share. The PCB layout is a stage after the design of schematic diagram of a PCB. It comprises setting up the design tool, board outline, import of netlist, component placement, routing, silkscreen cleanup, DRC check, and generation of documents for production.</p>

    <p>PCB layout software greatly help the designers to make highly efficient PCBs due to number of benefits such as reduction of complications of design, early fixation of errors, saving of time &amp; money and ease of use. The growing demand of PCBs in various sectors is forcing PCB manufacturers to take help from this layout software for faster production rate, which is the major factor for the high growth of this segment.</p>

    PCB Design Software Deployment Insights

    <p>On the basis of deployment, the PCB Design Software market has been bifurcated into cloud and on-premise. On premise has the largest market share. On-premises or desktop software must be installed on local machine of a company. These types of software function without the need of internet connection. Some of the most widespread on-premise PCB design platforms are Altium Designer, CircuitMaker, Eagle, KiCad, and OrCAD. This software is heavy-duty software packages with a ton of features and require a license to run a full-featured version.</p>

    <p>Most of these are Windows, Mac, and Linux compatible and usually any PCB work will require regular <a href="https://www.marketresearchfuture.com/reports/storage-in-big-data-market-2651">data storage</a>, sharing, retrieval, and occasional software updates in the computer system itself.</p>

    PCB Design Software Industry Insights

    <p>The PCB Design Software Market, on the basis of Industry, has been divided into Transportation, Consumer Electronics, Telecommunication, semiconductors, Aerospace and Defence, Healthcare, Industrial Automation &amp; Control, and Education and Research. Telecommunication has the largest market share. Increasing demand for PCB design software in the telecommunication industry and increasing need to save time and production cost are key factors driving growth of the PCB Design Software Market. By using PCB design software in the telecommunication industry, engineers can digitally detect potential problems in cell towers,<a href="https://www.marketresearchfuture.com/reports/satellite-market-8025"> satellites</a>, high-speed routers and servers, and commercial phone technologies.</p>

    <p>In addition, PCB design software are used in mobile phone tower systems, wireless communication systems, cell and tower transmission electronics, and telephonic switching systems to boost signal strength. PCBs are necessary equipment for the telecommunications industry.</p>

    Get more detailed insights about PCB Design Software Market Research Report - Forecast to 2032

    Regional Insights

    By Region, the study segments the market into North America, Europe, Asia-Pacific, Middle East & Africa, and South America. Throughout the forecast period, the North American PCB Design Software market is expected to be dominant. This region's growth is expected to be spearheaded by economies such as Canada and the United States. North America is the dominating the global semiconductor market in terms of chip design and semiconductor R&D. In chip design, the major success factors in USA are access to highly skilled engineering human source and a strong innovation ecosystem, leading by universities.

    For instance,10 out of the top 20 semiconductor design companies (comprising both fabless and IDMs (Integrated Device Manufacturers)), along with 4 of the top 5 EDA and core IP enterprises by 2019 revenue, are headquartered in the US.

    Asia-Pacific is the fastest growing region. The increase in the scope of R&D expenditures in the semiconductor industry by various countries and growing purchaser surmise and flourish demand of consumer electronics are driving the growth of the EDA market in the Asia Pacific region. The positive PCB manufacturing in the region have significant market share, heavy demand of electronics products in emerging countries and government supports to provide favorable environment for semiconductor industry is driving the growth of PCB design software market in Asia-pacific.

    Europe is expected to register a significantly rapid revenue growth rate during the forecast period owing to increasing implementation of PCB design software in the electronics sector. Rising demand of PCB design software in the field of telecommunications is also boosting market growth. Germany is the most important actor in the EDA European market, followed by UK.

    Even in the case of the European industry, electronic components and systems are strong supporters of the development of innovation and productivity in the entire European market and the PCB manufacturers are mainly involved in producing high end PCBs with sophisticated design, but lack in low and medium end PCBs as market is acquired by Asian countries.

    In case of the Middle East and Africa, most of the electronics equipment demand is fulfilled by import of Asia-pacific region due to lack of financial and human resources, political unrest, lack of investment and high cost in developing required infrastructure. Still due to presence of number of emerging countries such as Nigeria, South Africa and Israel, there is steady growth in the demand of PCBs in this region which is expected to imitate and propel the growth of PCB design software market in this region.

    FIGURE 3: PCB DESIGN SOFTWARE MARKET VALUE BY REGION 2022 VS 2032 (USD Million)

    PCB DESIGN SOFTWARE MARKET VALUE BY REGION 2022 VS 2032

    Source: Secondary Research, Primary Research, Market Research Future Database, and Analyst Review

    Further, the countries considered in the scope of the PCB Design Software market are the US, Canada, Mexico, UK, Germany, France, Italy, Spain, Switzerland, Austria, Belgium, Denmark, Finland, Greece, Hungary, Italy, Luxembourg, Netherlands, Norway, Poland, Portugal, Slovakia, Sweden, Romania, Ireland, China, Japan, Singapore, Malaysia, Indonesia, Philippines, South Korea, Hong Kong, Macau, Singapore, Brunei, India, Australia & New Zealand, South Africa, Egypt, Nigeria, Saudi Arabia, Qatar, United Arab Emirates, Bahrain, Kuwait, and Oman, Brazil, Argentina, Chile, and others.

    Key Players and Competitive Insights

    Major market players are spending a lot of money on R&D to increase their product lines, which will help the PCB Design Software market grow even more. Market participants are also taking a range of strategic initiatives to grow their worldwide footprint, including new product launches, contractual agreements, mergers and acquisitions, increased investments, and collaboration with other organizations. Competitors in the PCB Design Software industry must offer cost-effective items to expand and survive in an increasingly competitive and rising market environment.

    Cadence Design Systems, Inc. product categories include Functional Verification, Digital integrated circuits (IC) Design and Signoff, Custom IC Design and Verification, System Interconnect and Analysis, and intellectual property (IP). Functional verification products are used to verify that the circuitry or the software designed to perform as intended. Digital IC design offerings are used to create representations of a digital circuit or an IC that can be verified for correctness prior to implementation. Custom IC design and verification offerings are used to create schematic and physical representations of circuits down to the transistor level for analog and memory designs.

    System Interconnect and Analysis offerings are used to develop printed circuit boards and IC packages. Design IP offerings consist of functional blocks, which customers integrate into their ICs for the development process.

    Key Companies in the PCB Design Software Market market include

    Industry Developments

    January 2022 Zuken and SnapEDA, a provider of verified online electronic components, are announcing a new capability that provides eCADstar users direct access to SnapEDA’s online library.

    June 2021 Cadence Design Systems, Inc debuted the Cadence Allegro X Design Platform, the industry’s first engineering platform for system design that unifies schematic, layout, analysis, design collaboration and data management. Built upon proven Allegro and OrCAD core technology, the new Allegro X platform revolutionizes and streamlines the system design process for engineers—offering unparalleled collaboration across all engineering disciplines, integration with best-in-class Cadence signoff-level simulation and analysis products, and greater layout performance.

    Future Outlook

    PCB Design Software Market Future Outlook

    <p>The PCB Design Software Market is projected to grow at 11.84% CAGR from 2025 to 2035, driven by advancements in automation, IoT integration, and demand for miniaturization.</p>

    New opportunities lie in:

    • <p>Develop AI-driven design tools to enhance efficiency and reduce errors. Expand cloud-based solutions for collaborative design and remote access. Invest in training programs for engineers to leverage advanced PCB design technologies.</p>

    <p>By 2035, the market is expected to exhibit robust growth, positioning itself as a leader in technological innovation.</p>

    Market Segmentation

    PCB Design Software Type Outlook

    • PCB Layout
    • Schematic Capture

    PCB Design Software Industry Outlook

    • Transportation
    • Consumer Electronics
    • Telecommunications
    • Semiconductors
    • Aerospace & Defense
    • Healthcare
    • Industrial Automation & Control
    • Education & Research

    PCB Design Software Regional Outlook

    • {""=>["US"
    • "Canada"
    • "Mexico"]}
    • {""=>["Germany"
    • "France"
    • "UK"
    • "Rest of Europe"]}
    • {""=>["China"
    • "Japan"
    • "India"
    • "Rest of Asia-Pacific"]}

    PCB Design Software Component Outlook

    • {""=>["PCB CAM"
    • "PCB SPICE"
    • "Cable/Wire Harness"
    • "PCB Analysis Tools"
    • "PCB AI"]}

    PCB Design Software Deployment Type Outlook

    • Cloud
    • On-Premise

    PCB Design Software Design Complexity Outlook

    • Low-End Design
    • Medium-End Design
    • High-End Design

    Report Scope

    Report Attribute/Metric Details
    Market Size 2024 USD 1966.92 Million
    Market Size 2035 6736.62
    Compound Annual Growth Rate (CAGR) 11.84% (2025 - 2035)
    Base Year 2024
    Forecast Period 2025 - 2035
    Historical Data 2019-2021
    Forecast Units Value (USD Million)
    Report Coverage Revenue Forecast, Competitive Landscape, Growth Factors, and Trends
    Segments Covered Components, Design Complexities, Deployment Type, Industry, and Region
    Geographies Covered North America, Europe, Asia Pacific, Middle East & Africa, and South America
    Countries Covered The U.S, Canada, Mexico, Germany, France, UK, China, Japan, India, Australia, South Korea, UAE, and Brazil
    Key Companies Profiled Mentor Graphics (US), Cadence Design Systems, Inc. (US), ZUKEN INC. (Japan), Altium Limited (US), CadSoft Computer Inc. (US), Novarm (US), Shanghai Tsingyue Software Co., Ltd (China), Forte Design Systems, Inc. (US), Synopsys, Inc.(US), Dassault Systemes SE (US), Westdev Ltd (US), and Ansys, Inc. (US)., and other
    Key Market Opportunities Increasing Demand for Adoption Of New Technologies
    Key Market Dynamics Rise In Need to Reduce Time And Eliminate The Issues Faced During Product Development Extensive Application of PCBS In Various Industries
    Market Size 2025 2199.84

    Market Highlights

    Author

    Ankit Gupta
    Senior Research Analyst

    She holds an experience of about 6+ years in market research and business consulting, working under the spectrum of information communication technology, telecommunications and semiconductor domains. aarti conceptualizes and implements a scalable business strategy and provides strategic leadership to the clients. her expertise lies in market estimation, competitive intelligence, pipeline analysis, customer assessment, etc.

    Leave a Comment

    Latest Comments

    John Doe
    john@example.com

    This is a great article! Really helped me understand the topic better.

    Posted on July 23, 2025, 10:15 AM
    Jane Smith
    jane@domain.com

    Thanks for sharing this. I’ve bookmarked it for later reference.

    Posted on July 22, 2025, 7:45 PM

    FAQs

    How much is the PCB Design Software market?

    The PCB Design Software market Size was USD 1757.75 Million in 2022

    What is the market size for 2030, for the PCB Design Software Market?

    Market Size for PCB Design Software is USD 4816.12 Million in 2032

    What is the growth rate of the PCB Design Software market?

    Growth Rate of the PCB Design Software Market 11.84% in 2024-2032

    Which region held the largest market share in the PCB Design Software market?

    North America region is largest market share in the PCB Design Software market

    Who are the prominent players in the PCB Design Software market?

    Mentor Graphics (US), Cadence Design Systems, Inc. (US), ZUKEN INC. (Japan), Altium Limited (US), CadSoft Computer Inc. (US), Novarm (US), Shanghai Tsingyue Software Co., Ltd (China), Forte Design Systems, Inc. (US), Synopsys, Inc.(US), Dassault Systemes SE (US), Westdev Ltd (US), and Ansys, Inc. (US), and other.

    1. --- "
    2. Table of Contents
    3. Executive Summary 17
      1. MARKET ATTRACTIVENESS ANALYSIS 19
        1. GLOBAL PCB DESIGN SOFTWARE MARKET, BY COMPONENT 20
        2. GLOBAL PCB DESIGN SOFTWARE MARKET, BY DESIGN COMPLEXITY 21
        3. GLOBAL PCB DESIGN SOFTWARE MARKET, BY TYPE 22
        4. GLOBAL PCB DESIGN SOFTWARE MARKET, BY DEPLOYMENT TYPE 23
        5. GLOBAL PCB DESIGN SOFTWARE MARKET, BY INDUSTRY 24
        6. GLOBAL PCB DESIGN SOFTWARE MARKET, BY REGION 25
    4. Market Introduction 26
      1. DEFINITION 26
      2. Scope of the Study 26
      3. MARKET STRUCTURE 27
    5. Research Methodology 28
      1. RESEARCH PROCESS 28
      2. PRIMARY RESEARCH 29
      3. SECONDARY RESEARCH 30
      4. MARKET SIZE ESTIMATION 30
      5. TOP DOWN & Bottom-up Approach 31
      6. FORECAST MODEL 32
      7. LIST OF ASSUMPTIONS 33
    6. MARKET DYNAMICS 34
      1. DRIVERS 34
        1. RISE IN NEED TO REDUCE TIME AND ELIMINATE THE ISSUES FACED DURING PRODUCT DEVELOPMENT 34
        2. EXTENSIVE APPLICATION OF PCBS IN VARIOUS INDUSTRIES 35
        3. DRIVER IMPACT ANALYSIS 36
      2. RESTRAINTS 36
        1. RAPID INTRODUCTION OF NEW TECHNOLOGIES 36
        2. RESTRAINT IMPACT ANALYSIS 37
      3. OPPORTUNITIES 37
        1. INCREASING DEMAND FOR ADOPTION OF NEW TECHNOLOGIES 37
      4. CLIENT REQUIREMENTS 38
        1. PCB EMI ANALYSIS 38
        2. PCB SIGNAL INTEGRITY (SI) ANALYSIS 40
        3. PCB THERMAL ANALYSIS 43
        4. CUSTOMER CHALLENGES IN THE PCB SOFTWARE MARKET 44
        5. UNMET CUSTOMER SOLUTION NEEDS IN THE PCB SOFTWARE MARKET 46
        6. SEGMENT OR AREAS THAT ARE OVER-SERVED AND DIFFICULT TO PENETRATE AND MARKETS THAT ARE UNDERSERVED 46
    7. MARKET FACTOR ANALYSIS 48
      1. SUPPLY CHAIN ANALYSIS 48
        1. RESEARCH AND DEVELOPMENT 49
        2. ELECTRONICS MANUFACTURING SERVICES 49
        3. END PRODUCT ASSEMBLY 49
        4. SERVICES 49
      2. PORTER’S FIVE FORCES MODEL 50
        1. THREAT OF NEW ENTRANTS 50
        2. BARGAINING POWER OF SUPPLIERS 51
        3. THREAT OF SUBSTITUTES 51
        4. BARGAINING POWER OF BUYERS 51
        5. INTENSITY OF RIVALRY 51
      3. IMPACT OF COVID-19 ON GLOBAL PCB DESIGN SOFTWARE MARKET 52
    8. GLOBAL PCB DESIGN SOFTWARE MARKET, BY COMPONENT 53
      1. OVERVIEW 53
        1. GLOBAL PCB DESIGN SOFTWARE MARKET ESTIMATES & FORECAST, BY COMPONENT, 2019–2032 54
      2. SOFTWARE/TOOLS 55
        1. PCB CAM 55
        2. PCB SPICE 55
        3. CABLE/WIRE HARNESS 55
        4. PCB ANALYSIS TOOLS 55
        5. PCB AI 56
        6. SOFTWARE/TOOLS: MARKET ESTIMATES & FORECAST, BY REGION, 2019–2032 56
      3. SERVICES 57
        1. SERVICES: MARKET ESTIMATES & FORECAST, BY REGION, 2019–2032 57
    9. GLOBAL PCB DESIGN SOFTWARE MARKET, BY DESIGN COMPLEXITY 58
      1. OVERVIEW 58
        1. GLOBAL PCB DESIGN SOFTWARE MARKET ESTIMATES & FORECAST, BY DESIGN COMPLEXITY, 2019–2032 59
      2. LOW-END DESIGN 60
        1. LOW-END DESIGN: MARKET ESTIMATES & FORECAST, BY REGION, 2019–2032 60
      3. MEDIUM-END DESIGN 61
        1. MEDIUM-END DESIGN: MARKET ESTIMATES & FORECAST, BY REGION, 2019–2032 61
      1. HIGH-END DESIGN 62
        1. HIGH -END DESIGN: MARKET ESTIMATES & FORECAST, BY REGION, 2019–2032 62
    10. GLOBAL PCB DESIGN SOFTWARE MARKET, BY TYPE 63
      1. OVERVIEW 63
        1. GLOBAL PCB DESIGN SOFTWARE MARKET ESTIMATES & FORECAST, BY TYPE, 2019–2032 64
      2. PCB LAYOUT 65
        1. PCB LAYOUT: MARKET ESTIMATES & FORECAST, BY REGION, 2019–2032 65
      3. SCHEMATIC CAPTURE 66
        1. SCHEMATIC CAPTURE: MARKET ESTIMATES & FORECAST, BY REGION, 2019–2032 66
    11. GLOBAL PCB DESIGN SOFTWARE MARKET, BY DEPLOYMENT TYPE 67
      1. OVERVIEW 67
        1. GLOBAL PCB DESIGN SOFTWARE MARKET ESTIMATES & FORECAST, BY DEPLOYMENT TYPE, 2019–2032 68
      2. CLOUD 69
        1. CLOUD: MARKET ESTIMATES & FORECAST, BY REGION, 2019–2032 69
      3. ON-PREMISE 70
        1. ON-PREMISE: MARKET ESTIMATES & FORECAST, BY REGION, 2019–2032 70
    12. GLOBAL PCB DESIGN SOFTWARE MARKET, BY INDUSTRY 71
      1. OVERVIEW 71
        1. GLOBAL PCB DESIGN SOFTWARE MARKET ESTIMATES & FORECAST, BY INDUSTRY, 2019–2032 72
      2. TRANSPORTATION 73
        1. TRANSPORTATION: MARKET ESTIMATES & FORECAST, BY REGION, 2019–2032 73
      3. CONSUMER ELECTRONICS 74
        1. CONSUMER ELECTRONICS: MARKET ESTIMATES & FORECAST, BY REGION, 2019–2032 74
      4. TELECOMMUNICATIONS 75
        1. TELECOMMUNICATIONS: MARKET ESTIMATES & FORECAST, BY REGION, 2019–2032 75
      5. SEMICONDUCTORS 76
        1. SEMICONDUCTORS: MARKET ESTIMATES & FORECAST, BY REGION, 2019–2032 76
      6. AEROSPACE & DEFENSE 77
        1. AEROSPACE & DEFENSE: MARKET ESTIMATES & FORECAST, BY REGION, 2019–2032 77
      7. HEALTHCARE 78
        1. HEALTHCARE: MARKET ESTIMATES & FORECAST, BY REGION, 2019–2032 78
      8. INDUSTRIAL AUTOMATION & CONTROL 79
        1. INDUSTRIAL AUTOMATION & CONTROL: MARKET ESTIMATES & FORECAST, BY REGION, 2019–2032 79
      9. EDUCATION & RESEARCH 80
        1. EDUCATION & RESEARCH: MARKET ESTIMATES & FORECAST, BY REGION, 2019–2032 80
    13. GLOBAL PCB DESIGN SOFTWARE, BY REGION 81
      1. OVERVIEW 81
        1. GLOBAL PCB DESIGN SOFTWARE MARKET ESTIMATES & FORECAST, BY REGION, 2019–2032 82
      2. NORTH AMERICA 83
        1. NORTH AMERICA PCB DESIGN SOFTWARE MARKET ESTIMATES & FORECAST, BY COUNTRY, 2019–2032 84
        2. US 86
        3. CANADA 88
        4. MEXICO 90
      3. EUROPE 93
        1. EUROPE PCB DESIGN SOFTWARE MARKET ESTIMATES & FORECAST, BY COUNTRY, 2019–2032 94
        2. GERMANY 96
        3. UK 98
        4. FRANCE 100
        5. ITALY 102
        6. REST OF EUROPE 104
      4. ASIA-PACIFIC 107
        1. ASIA-PACIFIC PCB DESIGN SOFTWARE MARKET ESTIMATES & FORECAST, BY COUNTRY, 2019–2032 108
        2. CHINA 110
        3. INDIA 112
        4. JAPAN 114
        5. SOUTH KOREA 116
        6. REST OF ASIA-PACIFIC 118
      5. MIDDLE EAST & AFRICA 121
      6. SOUTH AMERICA 124
    14. Competitive Landscape 127
      1. COMPETITIVE OVERVIEW 127
      2. GLOBAL PCB DESIGN SOFTWARE MARKET: COMPANY SHARE ANALYSIS 127
      3. MAJOR GROWTH STRATEGY IN THE GLOBAL PCB DESIGN SOFTWARE MARKET 128
      4. COMPETITIVE BENCHMARKING 129
    15. COMPANY PROFILES 130
      1. MENTOR GRAPHICS 130
        1. COMPANY OVERVIEW 130
        2. FINANCIAL OVERVIEW 130
        3. PRODUCTS OFFERED 131
        4. KEY DEVELOPMENTS 131
        5. KEY STRATEGIES 131
      2. CADENCE DESIGN SYSTEMS 132
        1. COMPANY OVERVIEW 132
        2. FINANCIAL OVERVIEW 133
        3. PRODUCTS OFFERED 134
        4. KEY DEVELOPMENTS 134
        5. SWOT ANALYSIS 135
        6. KEY STRATEGIES 135
      3. ZUKEN INC 136
        1. COMPANY OVERVIEW 136
        2. FINANCIAL OVERVIEW 137
        3. PRODUCTS OFFERED 137
        4. KEY DEVELOPMENTS 138
        5. SWOT ANALYSIS 139
        6. KEY STRATEGIES 139
      4. ALTIUM 140
        1. COMPANY OVERVIEW 140
        2. FINANCIAL OVERVIEW 141
        3. PRODUCTS OFFERED 141
        4. KEY DEVELOPMENTS 142
        5. SWOT ANALYSIS 143
        6. KEY STRATEGIES 143
      5. CADSOFT (AUTODESK INC.) 144
        1. COMPANY OVERVIEW 144
        2. FINANCIAL OVERVIEW 145
        3. PRODUCTS OFFERED 145
        4. KEY DEVELOPMENTS 146
        5. SWOT ANALYSIS 146
        6. KEY STRATEGIES 146
      6. NOVARM 147
        1. COMPANY OVERVIEW 147
        2. FINANCIAL OVERVIEW 147
        3. PRODUCTS OFFERED 147
        4. KEY DEVELOPMENTS 147
        5. KEY STRATEGIES 147
      7. SHANGHAI TSINGYUE 148
        1. COMPANY OVERVIEW 148
        2. FINANCIAL OVERVIEW 148
        3. PRODUCTS OFFERED 148
        4. KEY DEVELOPMENTS 149
        5. KEY STRATEGIES 149
      8. FORTE DESIGN SYSTEMS INC. 150
        1. COMPANY OVERVIEW 150
        2. FINANCIAL OVERVIEW 150
        3. PRODUCTS OFFERED 150
        4. KEY DEVELOPMENTS 150
        5. KEY STRATEGIES 150
      9. SYNOPSYS 151
        1. COMPANY OVERVIEW 151
        2. FINANCIAL OVERVIEW 152
        3. PRODUCTS OFFERED 152
        4. KEY DEVELOPMENTS 153
        5. SWOT ANALYSIS 153
        6. KEY STRATEGIES 154
      10. SOLIDWORKS 155
        1. COMPANY OVERVIEW 155
        2. FINANCIAL OVERVIEW 155
        3. PRODUCTS OFFERED 156
        4. KEY DEVELOPMENTS 156
        5. SWOT ANALYSIS 156
        6. KEY STRATEGIES 156
      11. WESTDEV LTD. 157
        1. COMPANY OVERVIEW 157
        2. FINANCIAL OVERVIEW 157
        3. PRODUCTS OFFERED 157
        4. KEY DEVELOPMENTS 158
        5. KEY STRATEGIES 158
      12. ANSYS 159
        1. COMPANY OVERVIEW 159
        2. FINANCIAL OVERVIEW 160
        3. PRODUCTS OFFERED 161
        4. KEY DEVELOPMENTS 161
        5. SWOT ANALYSIS 162
        6. KEY STRATEGIES 162
    16. ANALYST VIEW 163
    17. APPENDIX 170
      1. REFERENCES 170
      2. RELATED REPORTS 170
    18. List of Tables and Figures
      1. LIST OF TABLES
      2. TABLE 1 LIST OF ASSUMPTIONS 33
      3. TABLE 2 GLOBAL PCB DESIGN SOFTWARE MARKET ESTIMATES & FORECAST, BY COMPONENT, 2019–2032 (USD MILLION) 54
      4. TABLE 3 SOFTWARE/TOOLS: MARKET ESTIMATES & FORECAST, BY REGION, 2019–2032 (USD MILLION) 56
      5. TABLE 4 SERVICES: MARKET ESTIMATES & FORECAST, BY REGION, 2019–2032 (USD MILLION) 57
      6. TABLE 5 GLOBAL PCB DESIGN SOFTWARE MARKET ESTIMATES & FORECAST, BY DESIGN COMPLEXITY, 2019–2032 (USD MILLION) 59
      7. TABLE 6 LOW-END DESIGN: MARKET ESTIMATES & FORECAST, BY REGION, 2019–2032 (USD MILLION) 60
      8. TABLE 7 MEDIUM-END DESIGN: MARKET ESTIMATES & FORECAST, BY REGION, 2019–2032 (USD MILLION) 61
      9. TABLE 8 HIGH -END DESIGN: MARKET ESTIMATES & FORECAST, BY REGION, 2019–2032 (USD MILLION) 62
      10. TABLE 9 GLOBAL PCB DESIGN SOFTWARE MARKET ESTIMATES & FORECAST, BY TYPE, 2019–2032 (USD MILLION) 64
      11. TABLE 10 PCB LAYOUT: MARKET ESTIMATES & FORECAST, BY REGION, 2019–2032 (USD MILLION) 65
      12. TABLE 11 SCHEMATIC CAPTURE: MARKET ESTIMATES & FORECAST, BY REGION, 2019–2032 (USD MILLION) 66
      13. TABLE 12 GLOBAL PCB DESIGN SOFTWARE MARKET ESTIMATES & FORECAST, BY DEPLOYMENT TYPE, 2019–2032 (USD MILLION) 68
      14. TABLE 13 CLOUD: MARKET ESTIMATES & FORECAST, BY REGION, 2019–2032 (USD MILLION) 69
      15. TABLE 14 ON-PREMISE: MARKET ESTIMATES & FORECAST, BY REGION, 2019–2032 (USD MILLION) 70
      16. TABLE 15 GLOBAL PCB DESIGN SOFTWARE MARKET ESTIMATES & FORECAST, BY INDUSTRY, 2019–2032 (USD MILLION) 72
      17. TABLE 16 TRANSPORTATION: MARKET ESTIMATES & FORECAST, BY REGION, 2019–2032 (USD MILLION) 73
      18. TABLE 17 CONSUMER ELECTRONICS: MARKET ESTIMATES & FORECAST, BY REGION, 2019–2032 (USD MILLION) 74
      19. TABLE 18 TELECOMMUNICATIONS: MARKET ESTIMATES & FORECAST, BY REGION, 2019–2032 (USD MILLION) 75
      20. TABLE 19 SEMICONDUCTORS: MARKET ESTIMATES & FORECAST, BY REGION, 2019–2032 (USD MILLION) 76
      21. TABLE 20 AEROSPACE & DEFENSE: MARKET ESTIMATES & FORECAST, BY REGION, 2019–2032 (USD MILLION) 77
      22. TABLE 21 HEALTHCARE: MARKET ESTIMATES & FORECAST, BY REGION, 2019–2032 (USD MILLION) 78
      23. TABLE 22 INDUSTRIAL AUTOMATION & CONTROL: MARKET ESTIMATES & FORECAST, BY REGION, 2019–2032 (USD MILLION) 79
      24. TABLE 23 EDUCATION & RESEARCH: MARKET ESTIMATES & FORECAST, BY REGION, 2019–2032 (USD MILLION) 80
      25. TABLE 24 GLOBAL PCB DESIGN SOFTWARE MARKET ESTIMATES & FORECAST, BY REGION, 2019–2032 (USD MILLION) 82
      26. TABLE 25 NORTH AMERICA: MARKET ESTIMATES & FORECAST, BY COUNTRY, 2019–2032 (USD MILLION) 84
      27. TABLE 26 NORTH AMERICA: MARKET ESTIMATES, BY COMPONENT, 2019–2032 (USD MILLION) 84
      28. TABLE 27 NORTH AMERICA: MARKET ESTIMATES, BY DESIGN COMPLEXITY, 2019–2032 (USD MILLION) 85
      29. TABLE 28 NORTH AMERICA: MARKET ESTIMATES, BY TYPE, 2019–2032 (USD MILLION) 85
      30. TABLE 29 NORTH AMERICA: MARKET ESTIMATES, BY DEPLOYMENT TYPE, 2019–2032 (USD MILLION) 85
      31. TABLE 30 NORTH AMERICA: MARKET ESTIMATES, BY INDUSTRY, 2019–2032 (USD MILLION) 86
      32. TABLE 31 US: MARKET ESTIMATES, BY COMPONENT, 2019–2032 (USD MILLION) 86
      33. TABLE 32 US: MARKET ESTIMATES, BY DESIGN COMPLEXITY, 2019–2032 (USD MILLION) 87
      34. TABLE 33 US: MARKET ESTIMATES, BY TYPE, 2019–2032 (USD MILLION) 87
      35. TABLE 34 US: MARKET ESTIMATES, BY DEPLOYMENT TYPE, 2019–2032 (USD MILLION) 87
      36. TABLE 35 US: MARKET ESTIMATES, BY INDUSTRY, 2019–2032 (USD MILLION) 88
      37. TABLE 36 CANADA: MARKET ESTIMATES, BY COMPONENT, 2019–2032 (USD MILLION) 88
      38. TABLE 37 CANADA: MARKET ESTIMATES, BY DESIGN COMPLEXITY, 2019–2032 (USD MILLION) 89
      39. TABLE 38 CANADA: MARKET ESTIMATES, BY TYPE, 2019–2032 (USD MILLION) 89
      40. TABLE 39 CANADA: MARKET ESTIMATES, BY DEPLOYMENT TYPE, 2019–2032 (USD MILLION) 89
      41. TABLE 40 CANADA: MARKET ESTIMATES, BY INDUSTRY, 2019–2032 (USD MILLION) 90
      42. TABLE 41 MEXICO: MARKET ESTIMATES, BY COMPONENT, 2019–2032 (USD MILLION) 90
      43. TABLE 42 MEXICO: MARKET ESTIMATES, BY DESIGN COMPLEXITY, 2019–2032 (USD MILLION) 91
      44. TABLE 43 MEXICO: MARKET ESTIMATES, BY TYPE, 2019–2032 (USD MILLION) 91
      45. TABLE 44 MEXICO: MARKET ESTIMATES, BY DEPLOYMENT TYPE, 2019–2032 (USD MILLION) 91
      46. TABLE 45 MEXICO: MARKET ESTIMATES, BY INDUSTRY, 2019–2032 (USD MILLION) 92
      47. TABLE 46 EUROPE: MARKET ESTIMATES & FORECAST, BY COUNTRY, 2019–2032 (USD MILLION) 94
      48. TABLE 47 EUROPE: MARKET ESTIMATES, BY COMPONENT, 2019–2032 (USD MILLION) 94
      49. TABLE 48 EUROPE: MARKET ESTIMATES, BY DESIGN COMPLEXITY, 2019–2032 (USD MILLION) 95
      50. TABLE 49 EUROPE: MARKET ESTIMATES, BY TYPE, 2019–2032 (USD MILLION) 95
      51. TABLE 50 EUROPE: MARKET ESTIMATES, BY DEPLOYMENT TYPE, 2019–2032 (USD MILLION) 95
      52. TABLE 51 EUROPE: MARKET ESTIMATES, BY INDUSTRY, 2019–2032 (USD MILLION) 96
      53. TABLE 52 GERMANY: MARKET ESTIMATES, BY COMPONENT, 2019–2032 (USD MILLION) 96
      54. TABLE 53 GERMANY: MARKET ESTIMATES, BY DESIGN COMPLEXITY, 2019–2032 (USD MILLION) 97
      55. TABLE 54 GERMANY: MARKET ESTIMATES, BY TYPE, 2019–2032 (USD MILLION) 97
      56. TABLE 55 GERMANY: MARKET ESTIMATES, BY DEPLOYMENT TYPE, 2019–2032 (USD MILLION) 97
      57. TABLE 56 GERMANY: MARKET ESTIMATES, BY INDUSTRY, 2019–2032 (USD MILLION) 98
      58. TABLE 57 UK: MARKET ESTIMATES, BY COMPONENT, 2019–2032 (USD MILLION) 98
      59. TABLE 58 UK: MARKET ESTIMATES, BY DESIGN COMPLEXITY, 2019–2032 (USD MILLION) 99
      60. TABLE 59 UK: MARKET ESTIMATES, BY TYPE, 2019–2032 (USD MILLION) 99
      61. TABLE 60 UK: MARKET ESTIMATES, BY DEPLOYMENT TYPE, 2019–2032 (USD MILLION) 99
      62. TABLE 61 UK: MARKET ESTIMATES, BY INDUSTRY, 2019–2032 (USD MILLION) 100
      63. TABLE 62 FRANCE: MARKET ESTIMATES, BY COMPONENT, 2019–2032 (USD MILLION) 100
      64. TABLE 63 FRANCE: MARKET ESTIMATES, BY DESIGN COMPLEXITY, 2019–2032 (USD MILLION) 101
      65. TABLE 64 FRANCE: MARKET ESTIMATES, BY TYPE, 2019–2032 (USD MILLION) 101
      66. TABLE 65 FRANCE: MARKET ESTIMATES, BY DEPLOYMENT TYPE, 2019–2032 (USD MILLION) 101
      67. TABLE 66 FRANCE: MARKET ESTIMATES, BY INDUSTRY, 2019–2032 (USD MILLION) 102
      68. TABLE 67 ITALY: MARKET ESTIMATES, BY COMPONENT, 2019–2032 (USD MILLION) 102
      69. TABLE 68 ITALY: MARKET ESTIMATES, BY DESIGN COMPLEXITY, 2019–2032 (USD MILLION) 103
      70. TABLE 69 ITALY: MARKET ESTIMATES, BY TYPE, 2019–2032 (USD MILLION) 103
      71. TABLE 70 ITALY: MARKET ESTIMATES, BY DEPLOYMENT TYPE, 2019–2032 (USD MILLION) 103
      72. TABLE 71 ITALY: MARKET ESTIMATES, BY INDUSTRY, 2019–2032 (USD MILLION) 104
      73. TABLE 72 REST OF EUROPE: MARKET ESTIMATES, BY COMPONENT, 2019–2032 (USD MILLION) 104
      74. TABLE 73 REST OF EUROPE: MARKET ESTIMATES, BY DESIGN COMPLEXITY, 2019–2032 (USD MILLION) 105
      75. TABLE 74 REST OF EUROPE: MARKET ESTIMATES, BY TYPE, 2019–2032 (USD MILLION) 105
      76. TABLE 75 REST OF EUROPE: MARKET ESTIMATES, BY DEPLOYMENT TYPE, 2019–2032 (USD MILLION) 105
      77. TABLE 76 REST OF EUROPE: MARKET ESTIMATES, BY INDUSTRY, 2019–2032 (USD MILLION) 106
      78. TABLE 77 ASIA-PACIFIC: MARKET ESTIMATES & FORECAST, BY COUNTRY, 2019–2032 (USD MILLION) 108
      79. TABLE 78 ASIA-PACIFIC: MARKET ESTIMATES, BY COMPONENT, 2019–2032 (USD MILLION) 108
      80. TABLE 79 ASIA-PACIFIC: MARKET ESTIMATES, BY DESIGN COMPLEXITY, 2019–2032 (USD MILLION) 109
      81. TABLE 80 ASIA-PACIFIC: MARKET ESTIMATES, BY TYPE, 2019–2032 (USD MILLION) 109
      82. TABLE 81 ASIA-PACIFIC: MARKET ESTIMATES, BY DEPLOYMENT TYPE, 2019–2032 (USD MILLION) 109
      83. TABLE 82 ASIA-PACIFIC: MARKET ESTIMATES, BY INDUSTRY, 2019–2032 (USD MILLION) 110
      84. TABLE 83 CHINA: MARKET ESTIMATES, BY COMPONENT, 2019–2032 (USD MILLION) 110
      85. TABLE 84 CHINA: MARKET ESTIMATES, BY DESIGN COMPLEXITY, 2019–2032 (USD MILLION) 111
      86. TABLE 85 CHINA: MARKET ESTIMATES, BY TYPE, 2019–2032 (USD MILLION) 111
      87. TABLE 86 CHINA: MARKET ESTIMATES, BY DEPLOYMENT TYPE, 2019–2032 (USD MILLION) 111
      88. TABLE 87 CHINA: MARKET ESTIMATES, BY INDUSTRY, 2019–2032 (USD MILLION) 112
      89. TABLE 88 INDIA: MARKET ESTIMATES, BY COMPONENT, 2019–2032 (USD MILLION) 112
      90. TABLE 89 INDIA: MARKET ESTIMATES, BY DESIGN COMPLEXITY, 2019–2032 (USD MILLION) 113
      91. TABLE 90 INDIA: MARKET ESTIMATES, BY TYPE, 2019–2032 (USD MILLION) 113
      92. TABLE 91 INDIA: MARKET ESTIMATES, BY DEPLOYMENT TYPE, 2019–2032 (USD MILLION) 113
      93. TABLE 92 INDIA: MARKET ESTIMATES, BY INDUSTRY, 2019–2032 (USD MILLION) 114
      94. TABLE 93 JAPAN: MARKET ESTIMATES, BY COMPONENT, 2019–2032 (USD MILLION) 114
      95. TABLE 94 JAPAN: MARKET ESTIMATES, BY DESIGN COMPLEXITY, 2019–2032 (USD MILLION) 115
      96. TABLE 95 JAPAN: MARKET ESTIMATES, BY TYPE, 2019–2032 (USD MILLION) 115
      97. TABLE 96 JAPAN: MARKET ESTIMATES, BY DEPLOYMENT TYPE, 2019–2032 (USD MILLION) 115
      98. TABLE 97 JAPAN: MARKET ESTIMATES, BY INDUSTRY, 2019–2032 (USD MILLION) 116
      99. TABLE 98 SOUTH KOREA: MARKET ESTIMATES, BY COMPONENT, 2019–2032 (USD MILLION) 116
      100. TABLE 99 SOUTH KOREA: MARKET ESTIMATES, BY DESIGN COMPLEXITY, 2019–2032 (USD MILLION) 117
      101. TABLE 100 SOUTH KOREA: MARKET ESTIMATES, BY TYPE, 2019–2032 (USD MILLION) 117
      102. TABLE 101 SOUTH KOREA: MARKET ESTIMATES, BY DEPLOYMENT TYPE, 2019–2032 (USD MILLION) 117
      103. TABLE 102 SOUTH KOREA: MARKET ESTIMATES, BY INDUSTRY, 2019–2032 (USD MILLION) 118
      104. TABLE 103 REST OF ASIA-PACIFIC: MARKET ESTIMATES, BY COMPONENT, 2019–2032 (USD MILLION) 118
      105. TABLE 104 REST OF ASIA-PACIFIC: MARKET ESTIMATES, BY DESIGN COMPLEXITY, 2019–2032 (USD MILLION) 119
      106. TABLE 105 REST OF ASIA-PACIFIC: MARKET ESTIMATES, BY TYPE, 2019–2032 (USD MILLION) 119
      107. TABLE 106 REST OF ASIA-PACIFIC: MARKET ESTIMATES, BY DEPLOYMENT TYPE, 2019–2032 (USD MILLION) 119
      108. TABLE 107 REST OF ASIA-PACIFIC: MARKET ESTIMATES, BY INDUSTRY, 2019–2032 (USD MILLION) 120
      109. TABLE 108 MIDDLE EAST & AFRICA: MARKET ESTIMATES, BY COMPONENT, 2019–2032 (USD MILLION) 121
      110. TABLE 109 MIDDLE EAST & AFRICA: MARKET ESTIMATES, BY DESIGN COMPLEXITY, 2019–2032 (USD MILLION) 121
      111. TABLE 110 MIDDLE EAST & AFRICA: MARKET ESTIMATES, BY TYPE, 2019–2032 (USD MILLION) 122
      112. TABLE 111 MIDDLE EAST & AFRICA: MARKET ESTIMATES, BY DEPLOYMENT TYPE, 2019–2032 (USD MILLION) 122
      113. TABLE 112 MIDDLE EAST & AFRICA: MARKET ESTIMATES, BY INDUSTRY, 2019–2032 (USD MILLION) 123
      114. TABLE 113 SOUTH AMERICA: MARKET ESTIMATES, BY COMPONENT, 2019–2032 (USD MILLION) 124
      115. TABLE 114 SOUTH AMERICA: MARKET ESTIMATES, BY DESIGN COMPLEXITY, 2019–2032 (USD MILLION) 124
      116. TABLE 115 SOUTH AMERICA: MARKET ESTIMATES, BY TYPE, 2019–2032 (USD MILLION) 125
      117. TABLE 116 SOUTH AMERICA: MARKET ESTIMATES, BY DEPLOYMENT TYPE, 2019–2032 (USD MILLION) 125
      118. TABLE 117 SOUTH AMERICA: MARKET ESTIMATES, BY INDUSTRY, 2019–2032 (USD MILLION) 126
      119. TABLE 118 MENTOR GRAPHICS: PRODUCTS OFFERED 131
      120. TABLE 119 MENTOR GRAPHICS: KEY DEVELOPMENTS 131
      121. TABLE 120 CADENCE DESIGN SYSTEMS: PRODUCTS OFFERED 134
      122. TABLE 121 CADENCE DESIGN SYSTEMS: KEY DEVELOPMENTS 134
      123. TABLE 122 ZUKEN INC: PRODUCTS OFFERED 137
      124. TABLE 123 ZUKEN INC: KEY DEVELOPMENTS 138
      125. TABLE 124 ALTIUM: PRODUCTS OFFERED 141
      126. TABLE 125 ALTIUM: KEY DEVELOPMENTS 142
      127. TABLE 126 CADSOFT (AUTODESK INC.): PRODUCTS OFFERED 145
      128. TABLE 127 NOVARM: PRODUCTS OFFERED 147
      129. TABLE 128 SHANGHAI TSINGYUE: PRODUCTS OFFERED 148
      130. TABLE 129 FORTE DESIGN SYSTEMS INC: PRODUCTS OFFERED 150
      131. TABLE 130 SYNOPSYS: PRODUCTS OFFERED 152
      132. TABLE 131 SYNOPSYS: KEY DEVELOPMENTS 153
      133. TABLE 132 SOLIDWORKS: PRODUCTS OFFERED 156
      134. TABLE 133 WESTDEV LTD: PRODUCTS OFFERED 157
      135. TABLE 134 WESTDEV LTD: KEY DEVELOPMENTS 158
      136. TABLE 135 ANSYS, INC: PRODUCTS OFFERED 161
      137. TABLE 136 ANSYS, INC: KEY DEVELOPMENTS 161   LIST OF FIGURES
      138. FIGURE 1 MARKET SYNOPSIS 18
      139. FIGURE 2 MARKET ATTRACTIVENESS ANALYSIS: GLOBAL PCB DESIGN SOFTWARE MARKET, 2022 19
      140. FIGURE 3 GLOBAL PCB DESIGN SOFTWARE MARKET ANALYSIS, BY COMPONENT, 2022 20
      141. FIGURE 4 GLOBAL PCB DESIGN SOFTWARE MARKET ANALYSIS, BY DESIGN COMPLEXITY, 2022 21
      142. FIGURE 5 GLOBAL PCB DESIGN SOFTWARE MARKET ANALYSIS, BY TYPE, 2022 22
      143. FIGURE 6 GLOBAL PCB DESIGN SOFTWARE MARKET ANALYSIS, BY DEPLOYMENT TYPE, 2022 23
      144. FIGURE 7 GLOBAL PCB DESIGN SOFTWARE MARKET ANALYSIS, BY INDUSTRY, 2022 24
      145. FIGURE 8 GLOBAL PCB DESIGN SOFTWARE MARKET ANALYSIS, BY REGION, 2022 25
      146. FIGURE 9 GLOBAL PCB DESIGN SOFTWARE MARKET: STRUCTURE 27
      147. FIGURE 10 RESEARCH PROCESS OF MRFR 28
      148. FIGURE 11 DROC ANALYSIS OF GLOBAL PCB DESIGN SOFTWARE MARKET 34
      149. FIGURE 12 DRIVER IMPACT ANALYSIS 36
      150. FIGURE 13 RESTRAINT IMPACT ANALYSIS 37
      151. FIGURE 14 SUPPLY CHAIN: GLOBAL PCB DESIGN SOFTWARE MARKET 48
      152. FIGURE 16 GLOBAL PCB DESIGN SOFTWARE MARKET, BY COMPONENT, 2022 (% SHARE) 53
      153. FIGURE 17 GLOBAL PCB DESIGN SOFTWARE MARKET, BY COMPONENT, 2019–2032 (USD MILLION) 54
      154. FIGURE 18 GLOBAL PCB DESIGN SOFTWARE MARKET, BY DESIGN COMPLEXITY, 2022 (% SHARE) 58
      155. FIGURE 19 GLOBAL PCB DESIGN SOFTWARE MARKET, BY DESIGN COMPLEXITY, 2019–2032 (USD MILLION) 59
      156. FIGURE 20 GLOBAL PCB DESIGN SOFTWARE MARKET, BY TYPE, 2022 (% SHARE) 63
      157. FIGURE 21 GLOBAL PCB DESIGN SOFTWARE MARKET, BY TYPE, 2019–2032 (USD MILLION) 64
      158. FIGURE 22 GLOBAL PCB DESIGN SOFTWARE MARKET, BY DEPLOYMENT TYPE, 2022 (% SHARE) 67
      159. FIGURE 23 GLOBAL PCB DESIGN SOFTWARE MARKET, BY DEPLOYMENT TYPE, 2019–2032 (USD MILLION) 68
      160. FIGURE 24 GLOBAL PCB DESIGN SOFTWARE MARKET, BY INDUSTRY, 2022 (% SHARE) 71
      161. FIGURE 25 GLOBAL PCB DESIGN SOFTWARE MARKET, BY INDUSTRY, 2019–2032 (USD MILLION) 72
      162. FIGURE 26 GLOBAL PCB DESIGN SOFTWARE MARKET, BY REGION, 2022 (% SHARE) 81
      163. FIGURE 27 
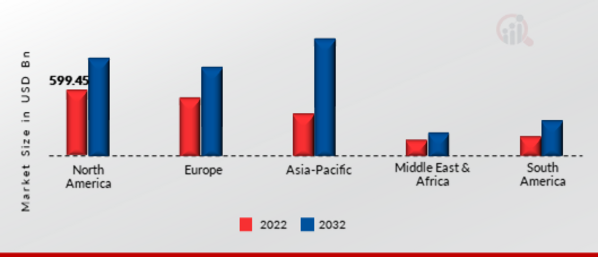
GLOBAL PCB DESIGN SOFTWARE MARKET, BY REGION, 2019–2032 (USD MILLION) 82
      164. FIGURE 28 NORTH AMERICA: PCB DESIGN SOFTWARE MARKET SHARE, BY COUNTRY, 2022 (% SHARE) 83
      165. FIGURE 29 EUROPE: PCB DESIGN SOFTWARE MARKET SHARE, BY COUNTRY, 2022 (% SHARE) 93
      166. FIGURE 30 ASIA-PACIFIC: PCB DESIGN SOFTWARE MARKET SHARE, BY COUNTRY, 2022 (% SHARE) 107
      167. FIGURE 31 GLOBAL PCB DESIGN SOFTWARE MAJOR PLAYERS MARKET SHARE ANALYSIS, 2022 (% SHARE) 127
      168. FIGURE 32 CADENCE DESIGN SYSTEMS: FINANCIAL OVERVIEW SNAPSHOT 133
      169. FIGURE 33 CADENCE DESIGN SYSTEMS: SWOT ANALYSIS 135
      170. FIGURE 34 ZUKEN INC: FINANCIAL OVERVIEW SNAPSHOT 137
      171. FIGURE 35 ZUKEN INC: SWOT ANALYSIS 139
      172. FIGURE 36 ALTIUM: FINANCIAL OVERVIEW SNAPSHOT 141
      173. FIGURE 37 ALTIUM: SWOT ANALYSIS 143
      174. FIGURE 38 AUTODESK INC.: FINANCIAL OVERVIEW SNAPSHOT 145
      175. FIGURE 39 CADSOFT (AUTODESK INC.): SWOT ANALYSIS 146
      176. FIGURE 40 SYNOPSYS: FINANCIAL OVERVIEW SNAPSHOT 152
      177. FIGURE 41 SYNOPSYS: SWOT ANALYSIS 153
      178. FIGURE 42 DASSAULT SYSTEMES: FINANCIAL OVERVIEW SNAPSHOT 155
      179. FIGURE 43 DASSAULT SYSTEMES: SWOT ANALYSIS 156
      180. FIGURE 44 ANSYS, INC: FINANCIAL OVERVIEW SNAPSHOT 160
      181. FIGURE 45 ANSYS, INC: SWOT ANALYSIS 162
      182. FIGURE 46 GLOBAL PCB DESIGN SOFTWARE MARKET, BY REGION, 2022 (% SHARE) 165"

    PCB Design Software Market Segmentation

    Global PCB Design Software, By Component Outlook (USD Million, 2019–2032)

    Software/Tools

    PCB CAM

    PCB SPICE

    Cable/Wire Harness

    PCB Analysis Tools

    PCB AI

    Services

    Global PCB Design Software, By Design Complexity (USD Million, 2019–2032)

    Low-End Design

    Medium-End Design

    High-End Design

    Global PCB Design Software, By Type Outlook (USD Million, 2019–2032)

    PCB Layout

    Schematic Capture

    Global PCB Design Software, By Deployment Type Outlook (USD Million, 2019–2032)

    Cloud

    On-Premise

    Global PCB Design Software, By Industry Outlook (USD Million, 2019–2032)

    Transportation

    Consumer Electronics

    Telecommunications

    Semiconductors

    Aerospace & Defense

    Healthcare

    Industrial Automation & Control

    Education & Research

    Global PCB Design Software Regional Outlook (USD Million, 2019–2032)

    North America Outlook (USD Million, 2019–2032)

    North America PCB Design Software, By Component Outlook (USD Million, 2019–2032)

    Software/Tools

    PCB CAM

    PCB SPICE

    Cable/Wire Harness

    PCB Analysis Tools

    PCB AI

    Services

    North America PCB Design Software, By Design Complexity (USD Million, 2019–2032)

    Low-End Design

    Medium-End Design

    High-End Design

    North America PCB Design Software, By Type Outlook (USD Million, 2019–2032)

    PCB Layout

    Schematic Capture

    North America PCB Design Software, By Deployment Type Outlook (USD Million, 2019–2032)

    Cloud

    On-Premise

    North America PCB Design Software, By Industry Outlook (USD Million, 2019–2032)

    Transportation

    Consumer Electronics

    Telecommunications

    Semiconductors

    Aerospace & Defense

    Healthcare

    Industrial Automation & Control

    Education & Research


    US Outlook (USD Million, 2019–2032)

    US PCB Design Software, By Component Outlook (USD Million, 2019–2032)

    Software/Tools

    PCB CAM

    PCB SPICE

    Cable/Wire Harness

    PCB Analysis Tools

    PCB AI

    Services

    US PCB Design Software, By Design Complexity (USD Million, 2019–2032)

    Low-End Design

    Medium-End Design

    High-End Design

    US PCB Design Software, By Type Outlook (USD Million, 2019–2032)

    PCB Layout

    Schematic Capture

    US PCB Design Software, By Deployment Type Outlook (USD Million, 2019–2032)

    Cloud

    On-Premise

    US PCB Design Software, By Industry Outlook (USD Million, 2019–2032)

    Transportation

    Consumer Electronics

    Telecommunications

    Semiconductors

    Aerospace & Defense

    Healthcare

    Industrial Automation & Control

    Education & Research

    Canada Outlook (USD Million, 2019–2032)

    Canada PCB Design Software, By Component Outlook (USD Million, 2019–2032)

    Software/Tools

    PCB CAM

    PCB SPICE

    Cable/Wire Harness

    PCB Analysis Tools

    PCB AI

    Services

    Canada PCB Design Software, By Design Complexity (USD Million, 2019–2032)

    Low-End Design

    Medium-End Design

    High-End Design

    Canada PCB Design Software, By Type Outlook (USD Million, 2019–2032)

    PCB Layout

    Schematic Capture

    Canada PCB Design Software, By Deployment Type Outlook (USD Million, 2019–2032)

    Cloud

    On-Premise

    Canada PCB Design Software, By Industry Outlook (USD Million, 2019–2032)

    Transportation

    Consumer Electronics

    Telecommunications

    Semiconductors

    Aerospace & Defense

    Healthcare

    Industrial Automation & Control

    Education & Research

    Mexico Outlook (USD Million, 2019–2032)

    Mexico PCB Design Software, By Component Outlook (USD Million, 2019–2032)

    Software/Tools

    PCB CAM

    PCB SPICE

    Cable/Wire Harness

    PCB Analysis Tools

    PCB AI

    Services

    Mexico PCB Design Software, By Design Complexity (USD Million, 2019–2032)

    Low-End Design

    Medium-End Design

    High-End Design

    Mexico PCB Design Software, By Type Outlook (USD Million, 2019–2032)

    PCB Layout

    Schematic Capture

    Mexico PCB Design Software, By Deployment Type Outlook (USD Million, 2019–2032)

    Cloud

    On-Premise

    Mexico PCB Design Software, By Industry Outlook (USD Million, 2019–2032)

    Transportation

    Consumer Electronics

    Telecommunications

    Semiconductors

    Aerospace & Defense

    Healthcare

    Industrial Automation & Control

    Education & Research


    Europe Outlook (USD Million, 2019–2032)

    Europe PCB Design Software, By Component Outlook (USD Million, 2019–2032)

    Software/Tools

    PCB CAM

    PCB SPICE

    Cable/Wire Harness

    PCB Analysis Tools

    PCB AI

    Services

    Europe PCB Design Software, By Design Complexity (USD Million, 2019–2032)

    Low-End Design

    Medium-End Design

    High-End Design

    Europe PCB Design Software, By Type Outlook (USD Million, 2019–2032)

    PCB Layout

    Schematic Capture

    Europe PCB Design Software, By Deployment Type Outlook (USD Million, 2019–2032)

    Cloud

    On-Premise

    Europe PCB Design Software, By Industry Outlook (USD Million, 2019–2032)

    Transportation

    Consumer Electronics

    Telecommunications

    Semiconductors

    Aerospace & Defense

    Healthcare

    Industrial Automation & Control

    Education & Research


    Germany Outlook (USD Million, 2019–2032)

    Germany PCB Design Software, By Component Outlook (USD Million, 2019–2032)

    Software/Tools

    PCB CAM

    PCB SPICE

    Cable/Wire Harness

    PCB Analysis Tools

    PCB AI

    Services

    Germany PCB Design Software, By Design Complexity (USD Million, 2019–2032)

    Low-End Design

    Medium-End Design

    High-End Design

    Germany PCB Design Software, By Type Outlook (USD Million, 2019–2032)

    PCB Layout

    Schematic Capture

    Germany PCB Design Software, By Deployment Type Outlook (USD Million, 2019–2032)

    Cloud

    On-Premise

    Germany PCB Design Software, By Industry Outlook (USD Million, 2019–2032)

    Transportation

    Consumer Electronics

    Telecommunications

    Semiconductors

    Aerospace & Defense

    Healthcare

    Industrial Automation & Control

    Education & Research


    France Outlook (USD Million, 2019–2032)

    France PCB Design Software, By Component Outlook (USD Million, 2019–2032)

    Software/Tools

    PCB CAM

    PCB SPICE

    Cable/Wire Harness

    PCB Analysis Tools

    PCB AI

    Services

    France PCB Design Software, By Design Complexity (USD Million, 2019–2032)

    Low-End Design

    Medium-End Design

    High-End Design

    France PCB Design Software, By Type Outlook (USD Million, 2019–2032)

    PCB Layout

    Schematic Capture

    France PCB Design Software, By Deployment Type Outlook (USD Million, 2019–2032)

    Cloud

    On-Premise

    France PCB Design Software, By Industry Outlook (USD Million, 2019–2032)

    Transportation

    Consumer Electronics

    Telecommunications

    Semiconductors

    Aerospace & Defense

    Healthcare

    Industrial Automation & Control

    Education & Research


    UK Outlook (USD Million, 2019–2032)

    UK PCB Design Software, By Component Outlook (USD Million, 2019–2032)

    Software/Tools

    PCB CAM

    PCB SPICE

    Cable/Wire Harness

    PCB Analysis Tools

    PCB AI

    Services

    UK PCB Design Software, By Design Complexity (USD Million, 2019–2032)

    Low-End Design

    Medium-End Design

    High-End Design

    UK PCB Design Software, By Type Outlook (USD Million, 2019–2032)

    PCB Layout

    Schematic Capture

    UK PCB Design Software, By Deployment Type Outlook (USD Million, 2019–2032)

    Cloud

    On-Premise

    UK PCB Design Software, By Industry Outlook (USD Million, 2019–2032)

    Transportation

    Consumer Electronics

    Telecommunications

    Semiconductors

    Aerospace & Defense

    Healthcare

    Industrial Automation & Control

    Education & Research


    Italy Outlook (USD Million, 2019–2032)

    Italy PCB Design Software, By Component Outlook (USD Million, 2019–2032)

    Software/Tools

    PCB CAM

    PCB SPICE

    Cable/Wire Harness

    PCB Analysis Tools

    PCB AI

    Services

    Italy PCB Design Software, By Design Complexity (USD Million, 2019–2032)

    Low-End Design

    Medium-End Design

    High-End Design

    Italy PCB Design Software, By Type Outlook (USD Million, 2019–2032)

    PCB Layout

    Schematic Capture

    Italy PCB Design Software, By Deployment Type Outlook (USD Million, 2019–2032)

    Cloud

    On-Premise

    Italy PCB Design Software, By Industry Outlook (USD Million, 2019–2032)

    Transportation

    Consumer Electronics

    Telecommunications

    Semiconductors

    Aerospace & Defense

    Healthcare

    Industrial Automation & Control

    Education & Research


    Rest of Europe Outlook (USD Million, 2019–2032)

    Rest of Europe PCB Design Software, By Component Outlook (USD Million, 2019–2032)

    Software/Tools

    PCB CAM

    PCB SPICE

    Cable/Wire Harness

    PCB Analysis Tools

    PCB AI

    Services

    Rest of Europe PCB Design Software, By Design Complexity (USD Million, 2019–2032)

    Low-End Design

    Medium-End Design

    High-End Design

    Rest of Europe PCB Design Software, By Type Outlook (USD Million, 2019–2032)

    PCB Layout

    Schematic Capture

    Rest of Europe PCB Design Software, By Deployment Type Outlook (USD Million, 2019–2032)

    Cloud

    On-Premise

    Rest of Europe PCB Design Software, By Industry Outlook (USD Million, 2019–2032)

    Transportation

    Consumer Electronics

    Telecommunications

    Semiconductors

    Aerospace & Defense

    Healthcare

    Industrial Automation & Control

    Education & Research


    Asia-Pacific Outlook (USD Million, 2019–2032)

    Asia-Pacific PCB Design Software, By Component Outlook (USD Million, 2019–2032)

    Software/Tools

    PCB CAM

    PCB SPICE

    Cable/Wire Harness

    PCB Analysis Tools

    PCB AI

    Services

    Asia-Pacific PCB Design Software, By Design Complexity (USD Million, 2019–2032)

    Low-End Design

    Medium-End Design

    High-End Design

    Asia-Pacific PCB Design Software, By Type Outlook (USD Million, 2019–2032)

    PCB Layout

    Schematic Capture

    Asia-Pacific PCB Design Software, By Deployment Type Outlook (USD Million, 2019–2032)

    Cloud

    On-Premise

    Asia-Pacific PCB Design Software, By Industry Outlook (USD Million, 2019–2032)

    Transportation

    Consumer Electronics

    Telecommunications

    Semiconductors

    Aerospace & Defense

    Healthcare

    Industrial Automation & Control

    Education & Research


    China Outlook (USD Million, 2019–2032)

    China PCB Design Software, By Component Outlook (USD Million, 2019–2032)

    Software/Tools

    PCB CAM

    PCB SPICE

    Cable/Wire Harness

    PCB Analysis Tools

    PCB AI

    Services

    China PCB Design Software, By Design Complexity (USD Million, 2019–2032)

    Low-End Design

    Medium-End Design

    High-End Design

    China PCB Design Software, By Type Outlook (USD Million, 2019–2032)

    PCB Layout

    Schematic Capture

    China PCB Design Software, By Deployment Type Outlook (USD Million, 2019–2032)

    Cloud

    On-Premise

    China PCB Design Software, By Industry Outlook (USD Million, 2019–2032)

    Transportation

    Consumer Electronics

    Telecommunications

    Semiconductors

    Aerospace & Defense

    Healthcare

    Industrial Automation & Control

    Education & Research


    India Outlook (USD Million, 2019–2032)

    India PCB Design Software, By Component Outlook (USD Million, 2019–2032)

    Software/Tools

    PCB CAM

    PCB SPICE

    Cable/Wire Harness

    PCB Analysis Tools

    PCB AI

    Services

    India PCB Design Software, By Design Complexity (USD Million, 2019–2032)

    Low-End Design

    Medium-End Design

    High-End Design

    India PCB Design Software, By Type Outlook (USD Million, 2019–2032)

    PCB Layout

    Schematic Capture

    India PCB Design Software, By Deployment Type Outlook (USD Million, 2019–2032)

    Cloud

    On-Premise

    India PCB Design Software, By Industry Outlook (USD Million, 2019–2032)

    Transportation

    Consumer Electronics

    Telecommunications

    Semiconductors

    Aerospace & Defense

    Healthcare

    Industrial Automation & Control

    Education & Research


    Japan Outlook (USD Million, 2019–2032)

    Japan PCB Design Software, By Component Outlook (USD Million, 2019–2032)

    Software/Tools

    PCB CAM

    PCB SPICE

    Cable/Wire Harness

    PCB Analysis Tools

    PCB AI

    Services

    Japan PCB Design Software, By Design Complexity (USD Million, 2019–2032)

    Low-End Design

    Medium-End Design

    High-End Design

    Japan PCB Design Software, By Type Outlook (USD Million, 2019–2032)

    PCB Layout

    Schematic Capture

    Japan PCB Design Software, By Deployment Type Outlook (USD Million, 2019–2032)

    Cloud

    On-Premise

    Japan PCB Design Software, By Industry Outlook (USD Million, 2019–2032)

    Transportation

    Consumer Electronics

    Telecommunications

    Semiconductors

    Aerospace & Defense

    Healthcare

    Industrial Automation & Control

    Education & Research

    South Korea Outlook (USD Million, 2019–2032)

    South Korea PCB Design Software, By Component Outlook (USD Million, 2019–2032)

    Software/Tools

    PCB CAM

    PCB SPICE

    Cable/Wire Harness

    PCB Analysis Tools

    PCB AI

    Services

    South Korea PCB Design Software, By Design Complexity (USD Million, 2019–2032)

    Low-End Design

    Medium-End Design

    High-End Design

    South Korea PCB Design Software, By Type Outlook (USD Million, 2019–2032)

    PCB Layout

    Schematic Capture

    South Korea PCB Design Software, By Deployment Type Outlook (USD Million, 2019–2032)

    Cloud

    On-Premise

    South Korea PCB Design Software, By Industry Outlook (USD Million, 2019–2032)

    Transportation

    Consumer Electronics

    Telecommunications

    Semiconductors

    Aerospace & Defense

    Healthcare

    Industrial Automation & Control

    Education & Research


    Rest of Asia-Pacific Outlook (USD Million, 2019–2032)

    Rest of Asia-Pacific PCB Design Software, By Component Outlook (USD Million, 2019–2032)

    Software/Tools

    PCB CAM

    PCB SPICE

    Cable/Wire Harness

    PCB Analysis Tools

    PCB AI

    Services

    Rest of Asia-Pacific PCB Design Software, By Design Complexity (USD Million, 2019–2032)

    Low-End Design

    Medium-End Design

    High-End Design

    Rest of Asia-Pacific PCB Design Software, By Type Outlook (USD Million, 2019–2032)

    PCB Layout

    Schematic Capture

    Rest of Asia-Pacific PCB Design Software, By Deployment Type Outlook (USD Million, 2019–2032)

    Cloud

    On-Premise

    Rest of Asia-Pacific PCB Design Software, By Industry Outlook (USD Million, 2019–2032)

    Transportation

    Consumer Electronics

    Telecommunications

    Semiconductors

    Aerospace & Defense

    Healthcare

    Industrial Automation & Control

    Education & Research


    Middle East & Africa Outlook (USD Million, 2019–2032)

    Middle East & Africa PCB Design Software, By Component Outlook (USD Million, 2019–2032)

    Software/Tools

    PCB CAM

    PCB SPICE

    Cable/Wire Harness

    PCB Analysis Tools

    PCB AI

    Services

    Middle East & Africa PCB Design Software, By Design Complexity (USD Million, 2019–2032)

    Low-End Design

    Medium-End Design

    High-End Design

    Middle East & Africa PCB Design Software, By Type Outlook (USD Million, 2019–2032)

    PCB Layout

    Schematic Capture

    Middle East & Africa PCB Design Software, By Deployment Type Outlook (USD Million, 2019–2032)

    Cloud

    On-Premise

    Middle East & Africa PCB Design Software, By Industry Outlook (USD Million, 2019–2032)

    Transportation

    Consumer Electronics

    Telecommunications

    Semiconductors

    Aerospace & Defense

    Healthcare

    Industrial Automation & Control

    Education & Research

    South America Outlook (USD Million, 2019–2032)

    South America PCB Design Software, By Component Outlook (USD Million, 2019–2032)

    Software/Tools

    PCB CAM

    PCB SPICE

    Cable/Wire Harness

    PCB Analysis Tools

    PCB AI

    Services

    South America PCB Design Software, By Design Complexity (USD Million, 2019–2032)

    Low-End Design

    Medium-End Design

    High-End Design

    South America PCB Design Software, By Type Outlook (USD Million, 2019–2032)

    PCB Layout

    Schematic Capture

    South America PCB Design Software, By Deployment Type Outlook (USD Million, 2019–2032)

    Cloud

    On-Premise

    South America PCB Design Software, By Industry Outlook (USD Million, 2019–2032)

    Transportation

    Consumer Electronics

    Telecommunications

    Semiconductors

    Aerospace & Defense

    Healthcare

    Industrial Automation & Control

    Education & Research

    Infographic

    Free Sample Request

    Kindly complete the form below to receive a free sample of this Report

    Get Free Sample

    Customer Strories

    “I am very pleased with how market segments have been defined in a relevant way for my purposes (such as "Portable Freezers & refrigerators" and "last-mile"). In general the report is well structured. Thanks very much for your efforts.”

    Victoria Milne

    Founder
    Case Study
    Chemicals and Materials