• Cat-intel
  • MedIntelliX
  • Resources
  • About Us
  • Hero Background
    English
    Chinese
    French
    Japanese
    Korean
    German
    Spanish

    Vapor Recovery Units Market Size

    ID: MRFR/E&P/8543-CR
    155 Pages
    Anshula Mandaokar
    February 2021

    Vapor Recovery Units Market Research Report Information By Horsepower (Up to 50 HP, 51-200 HP, 201-500 HP, 501-1000 HP, Above 1000 HP), By Application (Oil Tank Vapors, Marine Loading Terminals, Barge Degassing, Truck Loading, Vapor Particulate Filter, Railcar Loading, Storage Terminals), By End-Use (Oil & Gas, Landfill, Chemicals & Petrochemicals, Pharmaceuticals) And By Region (North ...

    Share:
    Download PDF ×

    We do not share your information with anyone. However, we may send you emails based on your report interest from time to time. You may contact us at any time to opt-out.

    Vapor Recovery Units Market Infographic
    $ 4,950.0
    $ 5,950.0
    $ 7,250.0

    Vapor Recovery Units Size

    Vapor Recovery Units Market Growth Projections and Opportunities

    The storage of oil within the oil and gas industry offers a significant opportunity for the market of vapor recovery units. These units play a crucial role when installed on onshore oil storage tanks, as they help recover volatile organic compound (VOC) emissions from the tanks. This process is essential for both environmental and economic reasons. In simple terms, the vapor recovery units function by drawing out hydrocarbon vapors from the oil storage tanks under low pressure, typically ranging from 4 ounces to 2 pounds per square inch (psi). Once extracted, these vapors are directed to a separator suction scrubber, also known as a knock-out pot. This scrubber serves the purpose of separating any liquids that may be concentrated in the piping network. From the knock-out pot, the vapors then pass through a compressor that facilitates the low-pressure suction for the entire system. The vapor recovery units are designed with a control pilot to prevent the formation of a vacuum in the top of the storage tank. This is a critical safety measure to ensure the stability of the entire system. After passing through the compressor, the vapors are metered and removed from the system. There are two main destinations for these recovered vapors: pipeline sale or onsite fuel supply. This means that the hydrocarbon vapors, which would otherwise contribute to environmental pollution, are efficiently captured and repurposed for further use, contributing to sustainable practices within the industry. One notable feature of vapor recovery units is their high efficiency. These units are capable of recovering more than 95% of the hydrocarbon vapors from the storage tanks. This not only helps in environmental conservation by preventing the release of harmful compounds into the atmosphere but also has economic benefits by reclaiming valuable hydrocarbons that can be utilized in various applications. In the context of geographical usage, several countries in the Middle East, including Saudi Arabia, the UAE, and Qatar, have embraced the adoption of vapor recovery units. This trend is particularly prominent because these countries are key players in the global oil and gas industry. By incorporating vapor recovery units into their oil storage facilities, they demonstrate a commitment to sustainable and responsible practices in the extraction and storage of oil. The widespread use of vapor recovery units in these regions can be attributed to the presence of significant market players in the oil and gas industry. These companies recognize the importance of implementing advanced technologies to minimize the environmental impact of their operations. vapor recovery units play a crucial role in the oil and gas industry, especially in the storage of oil. By efficiently capturing and repurposing hydrocarbon vapors, these units contribute to both environmental preservation and economic sustainability. The high efficiency of vapor recovery units, recovering over 95% of the vapors, makes them a valuable asset in mitigating the environmental impact of the oil and gas sector. The adoption of these units in key regions such as the Middle East signifies a positive shift towards responsible and sustainable practices within the industry.

    Vapor Recovery Units Market Size Graph

    Market Summary

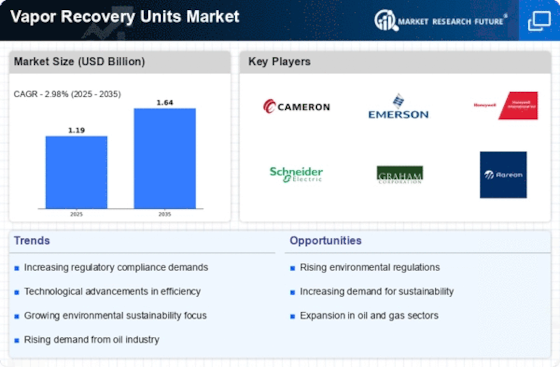
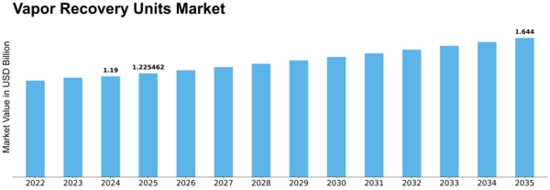
    As per Market Research Future Analysis, the Global Vapor Recovery Units Market was valued at USD 1.19 Billion in 2024 and is projected to grow to USD 1.64 Billion by 2035, with a CAGR of 2.98% from 2025 to 2035. Key drivers include rising manufacturing costs and stringent environmental regulations aimed at reducing VOC emissions. Technological advancements, particularly in membrane separation technology, are enhancing recovery rates and reducing maintenance costs, further propelling market growth.

    Key Market Trends & Highlights

    The Vapor Recovery Units Market is witnessing significant trends driven by technology and regulatory frameworks.

    • Technological advances are shifting consumer demand from traditional condensation to membrane separation technology.
    • The oil and gas sector is expected to be the largest demand driver due to increasing environmental regulations.
    • Asia-Pacific is projected to experience rapid market growth, with China holding the largest market share.

    Market Size & Forecast

    2024 Market Size USD 1.19 Billion
    2035 Market Size USD 1.64 Billion
    CAGR (2024-2035) 2.98%
    Largest Regional Market Share in 2024 Asia-Pacific.

    Major Players

    Key players include Whirlwind Methane Recovery Systems, LLC (US), Dover (India), BORSIG GmbH (Germany), John Zink Hamworthy (US), and Hy-Bon/EDI (US).

    Market Trends

    Technological advances will propel market growth.

    Market CAGR for vapor recovery unit is being driven by the rate of technical invention and advancement is unending. New technology is rapidly expanding in the vapour recovery unit sector. Because of new technologies, consumer demand has evolved from the traditional condensation approach employed in vapour recovery units to a new membrane separation technology. In membrane separation technology, a semipermeable membrane is utilised for filtering. Condensation technology paired with membrane separation technology has proven to be exceptionally effective and efficient in increasing recovery rates while decreasing maintenance costs.

    Innovative approaches and technologies may fuel the expansion of the vapour recovery units market over the forecast period.

    Various industries are responsible for the release of volatile organic compounds into the environment, where they mix with the air. These substances pose a threat to the environment as hazardous air pollutants. Government authorities in numerous countries have passed strict environmental regulations in an effort to stop the negative effects of VOC emissions. These regulatory measures have required crude oil producers and the petroleum industry to install vapour recovery units in each of their operations.

    For instance, the United States Environmental Protection Agency (EPA) issued a set of guidelines in May 2021 to minimise VOC, methane, and harmful air emissions in the oil and natural gas business. According to the revised guidelines, methane emissions in the country's oil and gas industry must be lowered by 40-45% by 2032 compared to 2019 levels.

    Crude oil tanks hold light hydrocarbons like methane, natural gas liquids, hazardous air pollutants (HAP) and some inert gases. During storage, these hydrocarbons vaporise and amass in the storage area. These vapours are released into the atmosphere as the liquid level in the tank changes. These vaporised hydrocarbons are collected and stored using vapour recovery machines. In onsite operations, these hydrocarbons can be used and sold as fuel. All of this adds up to significant cost savings and a reduction in methane emissions. Thus, driving the Vapor Recovery Units Market revenue.

    The increasing regulatory emphasis on emissions reduction and the transition towards sustainable energy practices appear to drive the demand for vapor recovery units across various industrial sectors.

    U.S. Environmental Protection Agency

    Vapor Recovery Units Market Market Drivers

    Regulatory Compliance

    The Global Vapor Recovery Units Market Industry is significantly driven by stringent environmental regulations aimed at reducing volatile organic compound emissions. Governments worldwide are enforcing laws that mandate the installation of vapor recovery systems in various sectors, including oil and gas, chemical manufacturing, and waste management. For instance, the U.S. Environmental Protection Agency has established guidelines that require vapor recovery units to be implemented at specific facilities. This regulatory landscape not only compels companies to adopt these technologies but also fosters a competitive market environment, as compliance becomes essential for operational continuity.

    Market Growth Projections

    The Global Vapor Recovery Units Market Industry is poised for growth, with projections indicating a market size of 1.19 USD Billion by 2024 and an anticipated increase to 1.64 USD Billion by 2035. This growth trajectory reflects a compound annual growth rate of 2.95% from 2025 to 2035. The increasing adoption of vapor recovery technologies across various sectors, driven by regulatory compliance and environmental awareness, suggests a robust market outlook. As industries continue to prioritize sustainability and emissions reduction, the demand for vapor recovery units is likely to remain strong, supporting the overall growth of the market.

    Technological Advancements

    Innovations in vapor recovery technology are propelling the Global Vapor Recovery Units Market Industry forward. Enhanced designs and improved materials are leading to more efficient systems that can capture a higher percentage of emissions. For example, advancements in membrane technology and carbon adsorption systems have shown promising results in increasing recovery rates. As these technologies evolve, they not only reduce operational costs but also improve the overall effectiveness of vapor recovery units. This trend suggests a growing market potential, as industries seek to adopt the latest technologies to meet regulatory demands and enhance sustainability.

    Rising Oil and Gas Production

    The resurgence in oil and gas production globally is a key driver for the Global Vapor Recovery Units Market Industry. As extraction and refining activities increase, so does the need for effective vapor recovery solutions to manage emissions. The International Energy Agency projects that global oil production will continue to rise, necessitating the implementation of vapor recovery units to comply with environmental regulations. This growth in the oil and gas sector is expected to contribute to the market's expansion, with projections indicating that the market could reach 1.19 USD Billion by 2024, reflecting a robust demand for vapor recovery technologies.

    Growing Environmental Awareness

    There is a notable increase in environmental consciousness among consumers and industries, which is influencing the Global Vapor Recovery Units Market Industry. Companies are increasingly recognizing the importance of sustainability and the role of vapor recovery units in minimizing their environmental footprint. This shift in mindset is prompting investments in cleaner technologies and practices. As a result, businesses are more likely to adopt vapor recovery systems to align with consumer expectations and corporate social responsibility goals. This trend is likely to drive market growth, as organizations strive to enhance their sustainability profiles and reduce emissions.

    Economic Growth in Emerging Markets

    Emerging economies are experiencing rapid industrialization, which is positively impacting the Global Vapor Recovery Units Market Industry. As countries like India and Brazil expand their industrial bases, the demand for vapor recovery units is expected to rise significantly. These nations are increasingly adopting stringent environmental regulations, similar to those in developed markets, to combat pollution. This trend indicates a potential market growth trajectory, with the Global Vapor Recovery Units Market projected to reach 1.64 USD Billion by 2035. The compound annual growth rate of 2.95% from 2025 to 2035 suggests a sustained demand for vapor recovery solutions in these regions.

    Market Segment Insights

    Vapor Recovery Units Horsepower Insights

    The Vapor Recovery Units Market segmentation, based on horsepower includes Up to 50 HP, 51-200 HP, 201-500 HP, 501-1000 HP, Above 1000 HP. In 2022, up to 50 HP category had a large market share. Maximum gas flow can be achieved with as little as 50 HP. These compressors have a unique direct-drive rotor shape that delivers constant and dependable performance.

    Vapor Recovery Units Application Insights

    The Vapor Recovery Units Market segmentation, based on application, includes Oil Tank Vapors, Marine Loading Terminals, Barge Degassing, Truck Loading, Vapor Particulate Filter, Railcar Loading, and Storage Terminals. Storage terminals category  maintained a substantial market share. Tanks, pipes, and other vapour recovery unit storage terminal components are used to store recovered gas. A tank with a big capacity for storing natural gas extracted from pipelines or wells might be underground or above ground. The procedure involves removing methane molecules from raw natural gas in order to produce liquefied petroleum gas (LPG), often known as propane.

    Vapor Recovery Units End-Use Insights

    The Vapor Recovery Units Market segmentation, based on end-use, includes vapor recovery unit oil and gas, Landfill, Chemicals & Petrochemicals, and Pharmaceuticals. During the forecast period, the oil and gas category is likely to be the largest demand driver for vapour recovery units in the market, Because of causes such as increasing environmental restrictions, higher refining throughput, and rising oil and gas demand. Vapour recovery units for the oil and gas sector can range in size from tiny desktop devices for tiny gas streams to massive packages capable of handling millions of cubic feet of gas per day.

    Figure1: Vapor Recovery Units Market, by End-Use, 2024 & 2032 (USD Billion)

    Source: Secondary Research, Primary Research, Market Research Future Database and Analyst Review

    Get more detailed insights about Vapor Recovery Units Market Research Report - Global Forecast till 2032

    Regional Insights

    By region, the study provides the market insights into North America, Europe, Asia-Pacific and Rest of the World. During the projected period, the Asia Pacific vapour recovery unit market is expected to rise rapidly. more oil and gas development, stricter pollution restrictions, and more manufacturing activity all contribute to the region's vapour recovery units market growth. Furthermore, industrial growth, an increase in the use of these recovery units in gas stations, and the strengthening of the petrochemical, chemical, and pharmaceutical industries all result in increased demand for vapour recovery units.

    Moreover, China’s Vapor Recovery Units Market held the largest market share, and the Indian Vapor Recovery Units Market was the fastest growing market in the Asia-Pacific region.

    Further, the major countries studiedin the market reportare The US, Canada, German, France, the UK, Italy, Spain, China, Japan, India, Australia, South Korea, and Brazil.

    Figure 2: Vapor Recovery Units Market Share By Region 2022 (USD Billion)

    Vapor Recovery Units Market Share By Region 2022

    Source: Secondary Research, Primary Research, Market Research Future Database and Analyst Review

    Europe Vapor Recovery Units Market accounts for the second-largest market share due to the rapid industrialisation, the discovery of new shale oil and gas fields, stringent government regulations imposed on VOC emissions in the region's countries Further, the German Vapor Recovery Units Market held the largest market share, and the UK Vapor Recovery Units Market was the fastest growing market in the European region

    The North America Vapor Recovery Units Market is expected to grow at the fastest CAGR from 2023 to 2032. This is because of severe laws requiring the installation of vapour recovery systems and the significant output of gasoline as a fuel.

    Key Players and Competitive Insights

    Leading market players are investing heavily in research and development in order to expand their product lines, which will help the Vapor Recovery Units Market, grow even more. Market participants are also undertaking a variety of strategic activities to expand their footprint, with important market developments including new product launches, contractual agreements, mergers and acquisitions, higher investments, and collaboration with other organizations. To expand and survive in a more competitive and rising market climate, Vapor Recovery Units industry must offer cost-effective items.

    Manufacturing locally to minimize operational costs is one of the key business tactics used by manufacturers in the Vapor Recovery Units industry to benefit clients and increase the market sector. In recent years, the Vapor Recovery Units industry has offered some of the most significant advantages to medicine. Major Vapor Recovery Unit manufacturers, including Whirlwind Methane Recovery Systems, LLC (US), Dover (India), BORSIG GmbH (Germany), John Zink Hamworthy (US), Hy-Bon/EDI (US), and others, are attempting to increase market demand by investing in research and development operations.

    Chiyoda, Tokyo, Japan is home to the international company Hitachi, Ltd. It is the parent company of the Hitachi Group (Hitachi Gurpu), and when DKB and Fuji Bank (the main entity of the Fuyo Group) merged to become the Mizuho Financial Group, it was a member of the Nissan zaibatsu, DKB Group, and Fuyo Group of companies. By 2020, Hitachi will be involved in a variety of industries, including infrastructure, AI, the Internet of Things, and big data.

    In Jul 2019, Hitachi has agreed to offer innovative technologies and equipment for the Persian Gulf Bid Boland Gas Refinery project in southern Khuzestan Province. NIPNA, a Japanese corporation, will supply compressors, vapour recovery units, and gas storage equipment under the terms of the agreement.

    Cimarron Energy Inc. is an oil and gas production equipment designer and manufacturer. Gas production units, separators, line heaters, vapour recovery towers, dehycombustor, and other related goods are available from the company. Cimarron Energy provides service to customers in the United States. In Jul 2019, Cimarron Energy, Inc. announced the purchase of HY-BON/EDI. Long-term client strategies for HY-BON/EDI and Cimarron are aligned in order to strengthen our market positions in vapour recovery and emissions control systems for oil and gas operators.

    Key Companies in the Vapor Recovery Units Market market include

    Industry Developments

    • Q3 2024: EFC gases and advanced materials announces $210 million investment for new manufacturing facility in McGregor, Texas EFC gases and advanced materials revealed a strategic investment of $210 million to establish a state-of-the-art manufacturing facility in McGregor, Texas, aimed at supporting the rapidly growing U.S. semiconductor industry and expanding vapor recovery unit production capacity.[3]
    • Q1 2025: Taiyo Oil selects Honeywell UOP Ethanol jo jet technology for sustainable aviation fuel production in Okinawa, Japan Honeywell announced that Taiyo Oil has chosen its UOP Ethanol jo jet technology to produce sustainable aviation fuel at Taiyo's Okinawa operations, integrating advanced vapor recovery solutions for improved environmental compliance.[3]

    Future Outlook

    Vapor Recovery Units Market Future Outlook

    The Vapor Recovery Units Market is projected to grow at a 2.98% CAGR from 2025 to 2035, driven by regulatory pressures, technological advancements, and increasing environmental concerns.

    New opportunities lie in:

    • Develop advanced VRUs integrating IoT for real-time monitoring and efficiency optimization.
    • Expand into emerging markets with tailored solutions addressing local regulatory requirements.
    • Invest in R&D for innovative materials enhancing durability and performance of VRUs.

    By 2035, the Vapor Recovery Units Market is expected to be robust, reflecting a strong commitment to sustainability and innovation.

    Market Segmentation

    Vapor Recovery Units End-Use Outlook

    • Oil & Gas
    • Landfill
    • Chemicals & Petrochemicals
    • Pharmaceuticals

    Vapor Recovery Units Regional Outlook

    North America
    • US
    • Canada

    Vapor Recovery Units Horsepower Outlook

    • Up to 50 HP
    • 51-200 HP
    • 201-500 HP
    • 501-1000 HP
    • Above 1000 HP

    Vapor Recovery Units Application Outlook

    • Oil Tank Vapors
    • Marine Loading Terminals
    • Barge Degassing
    • Truck Loading
    • Vapor Particulate Filter
    • Railcar Loading
    • Storage Terminals

    Report Scope

    Report Attribute/Metric Details
    Market Size 2024 USD 1.19 Billion
    Market Size 2035 1.64 (Value (USD Billion))
    Compound Annual Growth Rate (CAGR) 2.98% (2025 - 2035)
    Base Year 2024
    Market Forecast Period 2025 - 2035
    Historical Data 2018- 2022
    Market Forecast Units Value (USD Billion)
    Report Coverage Revenue Forecast, Market Competitive Landscape, Growth Factors, and Trends
    Segments Covered Horsepower, Application and End Use, and Region
    Geographies Covered North America, Europe, AsiaPacific, and the Rest of the World
    Countries Covered The US, Canada, German, France, UK, Italy, Spain, China, Japan, India, Australia, South Korea, and Brazil
    Key Companies Profiled ALMA Group (France). AEREON (US), Symex Technologies (Netherlands), Voczero Ltd. (UK), Zeeco, Inc. (US), FLOGISTIX, LP (US), Kilburn Engineering Ltd. (India), Whirlwind Methane Recovery Systems, LLC (US), Dover (India), BORSIG GmbH (Germany), John Zink Hamworthy (US), Hy-Bon/EDI (US), Kappa GI (Italy), and Gardner Denver (US)
    Key Market Opportunities Opportunities for oil storage in the Middle East and Africa
    Key Market Dynamics Environmental standards for VOC emissions are stringent.
    Market Size 2025 1.23 (Value (USD Billion))

    Market Highlights

    Author

    Anshula Mandaokar
    Team Lead - Research

    She holds an experience of about 6+ years in market research and business consulting, working under the spectrum of information communication technology, telecommunications and semiconductor domains. aarti conceptualizes and implements a scalable business strategy and provides strategic leadership to the clients. her expertise lies in market estimation, competitive intelligence, pipeline analysis, customer assessment, etc.

    Leave a Comment

    Latest Comments

    John Doe
    john@example.com

    This is a great article! Really helped me understand the topic better.

    Posted on July 23, 2025, 10:15 AM
    Jane Smith
    jane@domain.com

    Thanks for sharing this. I’ve bookmarked it for later reference.

    Posted on July 22, 2025, 7:45 PM

    FAQs

    How much is the Vapor Recovery Units Market?

    The Vapor Recovery Units Market size was valued at USD 1.14 Billion in 2023.

    What is the growth rate of the Vapor Recovery Units Market?

    The market is projected to grow at a CAGR of 2.98% during the forecast period, 2024-2032.

    Which region held the largest market share in the Vapor Recovery Units Market?

    Asia Pacific had the largest share in the market

    Who are the key players in the Vapor Recovery Units Market?

    The key players in the market are Whirlwind Methane Recovery Systems, LLC (US), Dover (India), BORSIG GmbH (Germany), John Zink Hamworthy (US), Hy-Bon/EDI (US).

    Which application led the Vapor Recovery Units Market?

    The Storage terminal category dominated the market in 2022.

    Which end-use had the largest market share in the Vapor Recovery Units Market?

    The oil and gas industry had the largest share in the market.

    1. Table of Contents
    2. Executive Summary 15
      1. MARKET ATTRACTIVENESS ANALYSIS 17
        1. GLOBAL VAPOR RECOVERY UNITS MARKET, BY HORSEPOWER 18
        2. GLOBAL VAPOR RECOVERY UNITS MARKET, BY APPLICATION 19
        3. GLOBAL VAPOR RECOVERY UNITS MARKET, BY END USE 20
        4. GLOBAL VAPOR RECOVERY UNITS MARKET, BY REGION 21
    3. Market Introduction 22
      1. DEFINITION 22
      2. Scope of the Study 22
      3. RESEARCH OBJECTIVE 22
      4. MARKET STRUCTURE 22
      5. KEY BUYING CRITERIA 23
    4. Research Methodology 24
      1. RESEARCH PROCESS 24
      2. PRIMARY RESEARCH 25
      3. SECONDARY RESEARCH 26
      4. MARKET SIZE ESTIMATION 27
      5. FORECAST MODEL 28
      6. LIST OF ASSUMPTIONS 29
    5. MARKET INSIGHTS 30
    6. MARKET DYNAMICS 33
      1. INTRODUCTION 33
      2. DRIVERS 34
        1. STRINGENT ENVIRONMENTAL REGULATIONS FOR VOC EMISSIONS 34
      3. RESTRAINT 34
        1. HIGH INSTALLATION AND MAINTENANCE COSTS 34
      4. OPPORTUNITY 35
        1. OIL STORAGE OPPORTUNITIES IN THE MIDDLE EAST & AFRICA 35
      5. IMPACT ANALYSIS OF COVID-19 35
        1. IMPACT ON INDUSTRIES USING VAPOR RECOVERY UNIT 35
        2. IMPACT ON THE VAPOR RECOVERY UNIT MARKET 35
        3. IMPACT ON SUPPLY CHAIN OF VAPOR RECOVERY UNITS 36
    7. MARKET FACTOR ANALYSIS 37
      1. SUPPLY CHAIN ANALYSIS 37
        1. DESIGN & DEVELOPMENT 38
        2. RAW MATERIAL & COMPONENT SUPPLY 38
        3. MANUFACTURE & ASSEMBLY 38
        4. SALES & DISTRIBUTION 38
        5. OPERATION 38
      2. PORTER’S FIVE FORCES MODEL 39
        1. THREAT OF NEW ENTRANTS 39
        2. BARGAINING POWER OF SUPPLIERS 40
        3. THREAT OF SUBSTITUTES 40
        4. BARGAINING POWER OF BUYERS 40
        5. INTENSITY OF RIVALRY 40
    8. GLOBAL VAPOR RECOVERY UNIT MARKET, BY HORSEPOWER 41
      1. OVERVIEW 41
      2. UP TO 50 HP 43
      3. 51 HP – 200 HP 43
      4. 201 HP – 500 HP 43
      5. 501 HP – 1,000 HP 43
      6. ABOVE 1,000 HP 43
    9. GLOBAL VAPOR RECOVERY UNITS MARKET, BY APPLICATION 44
      1. OVERVIEW 44
      2. OIL TANK VAPORS 46
      3. MARINE LOADING TERMINALS 46
      4. BARGE DEGASSING 46
      5. TRUCK LOADING 46
      6. VAPOR PARTICULATE FILTER 46
      7. RAILCAR LOADING 47
      8. STORAGE TERMINALS 47
    10. GLOBAL VAPOR RECOVERY UNITS MARKET, BY END USE 48
      1. OVERVIEW 48
      2. OIL & GAS 50
        1. CRUDE OIL 50
        2. LNG 50
      3. CHEMICAL & PETROCHEMICAL 50
      4. LANDFILL 51
      5. PHARMACEUTICALS 51
    11. GLOBAL VAPOR RECOVERY UNITS MARKET, BY REGION 52
      1. OVERVIEW 52
      2. NORTH AMERICA 53
        1. US 55
        2. CANADA 57
        3. MEXICO 59
      3. EUROPE 61
        1. RUSSIA 63
        2. UK 65
        3. GERMANY 67
        4. FRANCE 69
        5. ITALY 70
        6. REST OF EUROPE 72
      4. ASIA-PACIFIC 74
        1. CHINA 76
        2. INDIA 78
        3. JAPAN 80
        4. SOUTH KOREA 81
        5. REST OF ASIA-PACIFIC 83
      5. MIDDLE EAST & AFRICA 85
        1. SAUDI ARABIA 87
        2. UAE 89
        3. SOUTH AFRICA 91
        4. REST OF THE MIDDLE EAST & AFRICA 92
      6. SOUTH AMERICA 94
        1. BRAZIL 96
        2. ARGENTINA 98
        3. REST OF SOUTH AMERICA 100
    12. Competitive Landscape 102
      1. COMPETITIVEOVERVIEW 102
      2. COMPETITIVE BENCHMARKING 103
      3. MARKET SHARE ANALYSIS 104
    13. COMPANY PROFILES 105
      1. ALMA GROUP 105
        1. COMPANY OVERVIEW 105
        2. FINANCIAL OVERVIEW 105
        3. PRODUCTS OFFERED 105
        4. KEY DEVELOPMENTS 105
        5. SWOT ANALYSIS 106
        6. KEY STRATEGIES 106
      2. AEREON 107
        1. COMPANY OVERVIEW 107
        2. FINANCIAL OVERVIEW 107
        3. PRODUCTS OFFERED 107
        4. KEY DEVELOPMENTS 107
      3. SYMEX TECHNOLOGIES 108
        1. COMPANY OVERVIEW 108
        2. FINANCIAL OVERVIEW 108
        3. PRODUCTS OFFERED 108
        4. KEY DEVELOPMENTS 108
      4. VOCZERO LTD. 109
        1. COMPANY OVERVIEW 109
        2. FINANCIAL OVERVIEW 109
        3. PRODUCTS OFFERED 109
        4. KEY DEVELOPMENTS 109
      5. ZEECO, INC. 110
        1. COMPANY OVERVIEW 110
        2. FINANCIAL OVERVIEW 110
        3. PRODUCTS OFFERED 110
        4. KEY DEVELOPMENTS 110
        5. SWOT ANALYSIS 111
        6. KEY STRATEGIES 111
      6. FLOGISTIX, LP 112
        1. COMPANY OVERVIEW 112
        2. FINANCIAL OVERVIEW 112
        3. PRODUCTS OFFERED 112
        4. KEY DEVELOPMENTS 112
      7. KILBURN ENGINEERING LTD. 113
        1. COMPANY OVERVIEW 113
        2. FINANCIAL OVERVIEW 114
        3. PRODUCTS/SERVICES OFFERED 114
        4. KEY DEVELOPMENTS 114
      8. WHIRLWIND METHANE RECOVERY SYSTEMS, LLC 115
        1. COMPANY OVERVIEW 115
        2. FINANCIAL OVERVIEW 115
        3. PRODUCTS/SERVICES OFFERED 115
        4. KEY DEVELOPMENTS 115
      9. DOVER 116
        1. COMPANY OVERVIEW 116
        2. FINANCIAL OVERVIEW 117
        3. PRODUCTS/SERVICES OFFERED 117
        4. KEY DEVELOPMENTS 118
        5. SWOT ANALYSIS 118
        6. KEY STRATEGIES 118
      10. BORSIG GMBH 119
        1. COMPANY OVERVIEW 119
        2. FINANCIAL OVERVIEW 119
        3. PRODUCTS/SERVICES OFFERED 119
        4. KEY DEVELOPMENTS 119
        5. SWOT ANALYSIS 120
        6. KEY STRATEGIES 120
      11. JOHN ZINK HAMWORTHY 121
        1. COMPANY OVERVIEW 121
        2. FINANCIAL OVERVIEW 121
        3. PRODUCTS/SERVICES OFFERED 121
        4. KEY DEVELOPMENTS 121
      12. HY-BON/EDI 122
        1. COMPANY OVERVIEW 122
        2. FINANCIAL OVERVIEW 122
        3. PRODUCTS/SERVICES OFFERED 122
        4. KEY DEVELOPMENTS 122
      13. KAPPA GI 123
        1. COMPANY OVERVIEW 123
        2. FINANCIAL OVERVIEW 123
        3. PRODUCTS/SERVICES OFFERED 123
        4. KEY DEVELOPMENTS 123
      14. GARDNER DENVER 124
        1. COMPANY OVERVIEW 124
        2. FINANCIAL OVERVIEW 125
        3. PRODUCTS/SERVICES OFFERED 125
        4. KEY DEVELOPMENTS 126
        5. SWOT ANALYSIS 126
        6. KEY STRATEGIES 126
    14. List of Tables and Figures
      1. LIST OF TABLES
      2. TABLE 1 PRIMARY INTERVIEWS 25
      3. TABLE 2 LIST OF ASSUMPTIONS 29
      4. TABLE 3 GLOBAL VAPOR RECOVERY UNITS: MARKET ESTIMATES & FORECAST, BY HORSEPOWER, 2023-2032 (USD MILLION) 42
      5. TABLE 4 GLOBAL VAPOR RECOVERY UNITS: MARKET ESTIMATES & FORECAST, BY APPLICATION, 2023-2032 (USD MILLION) 45
      6. TABLE 5 GLOBAL VAPOR RECOVERY UNITS: MARKET ESTIMATES & FORECAST, BY END USE, 2023-2032 (USD MILLION) 49
      7. TABLE 6 GLOBAL VAPOR RECOVERY UNITS MARKET, BY REGION, 2023-2032 (USD MILLION) 53
      8. TABLE 7 NORTH AMERICA: VAPOR RECOVERY UNITS MARKET, BY COUNTRY, 2023-2032 (USD MILLION) 53
      9. TABLE 8 NORTH AMERICA: VAPOR RECOVERY UNITS: MARKET ESTIMATES & FORECAST, BY HORSEPOWER, 2023-2032 (USD MILLION) 54
      10. TABLE 9 NORTH AMERICA: VAPOR RECOVERY UNITS: MARKET ESTIMATES & FORECAST, BY APPLICATION, 2023-2032 (USD MILLION) 54
      11. TABLE 10 NORTH AMERICA: VAPOR RECOVERY UNITS: MARKET ESTIMATES & FORECAST, BY END USE, 2023-2032 (USD MILLION) 55
      12. TABLE 11 US: VAPOR RECOVERY UNITS: MARKET ESTIMATES & FORECAST, BY HORSEPOWER, 2023-2032 (USD MILLION) 55
      13. TABLE 12 US: VAPOR RECOVERY UNITS: MARKET ESTIMATES & FORECAST, BY APPLICATION, 2023-2032 (USD MILLION) 56
      14. TABLE 13 US: VAPOR RECOVERY UNITS: MARKET ESTIMATES & FORECAST, BY END USE, 2023-2032 (USD MILLION) 56
      15. TABLE 14 CANADA: VAPOR RECOVERY UNITS: MARKET ESTIMATES & FORECAST, BY HORSEPOWER, 2023-2032 (USD MILLION) 57
      16. TABLE 15 CANADA: VAPOR RECOVERY UNITS: MARKET ESTIMATES & FORECAST, BY APPLICATION, 2023-2032 (USD MILLION) 58
      17. TABLE 16 CANADA: VAPOR RECOVERY UNITS: MARKET ESTIMATES & FORECAST, BY END USE, 2023-2032 (USD MILLION) 58
      18. TABLE 17 MEXICO: VAPOR RECOVERY UNITS: MARKET ESTIMATES & FORECAST, BY HORSEPOWER, 2023-2032 (USD MILLION) 59
      19. TABLE 18 MEXICO: VAPOR RECOVERY UNITS: MARKET ESTIMATES & FORECAST, BY APPLICATION, 2023-2032 (USD MILLION) 60
      20. TABLE 19 MEXICO: VAPOR RECOVERY UNITS: MARKET ESTIMATES & FORECAST, BY END USE, 2023-2032 (USD MILLION) 60
      21. TABLE 20 EUROPE: VAPOR RECOVERY UNITS MARKET, BY COUNTRY, 2023-2032 (USD MILLION) 61
      22. TABLE 21 EUROPE: VAPOR RECOVERY UNITS: MARKET ESTIMATES & FORECAST, BY HORSEPOWER, 2023-2032 (USD MILLION) 62
      23. TABLE 22 EUROPE: VAPOR RECOVERY UNITS: MARKET ESTIMATES & FORECAST, BY APPLICATION, 2023-2032 (USD MILLION) 62
      24. TABLE 23 EUROPE: VAPOR RECOVERY UNITS: MARKET ESTIMATES & FORECAST, BY END USE, 2023-2032 (USD MILLION) 63
      25. TABLE 24 RUSSIA: VAPOR RECOVERY UNITS: MARKET ESTIMATES & FORECAST, BY HORSEPOWER, 2023-2032 (USD MILLION) 63
      26. TABLE 25 RUSSIA: VAPOR RECOVERY UNITS: MARKET ESTIMATES & FORECAST, BY APPLICATION, 2023-2032 (USD MILLION) 64
      27. TABLE 26 RUSSIA: VAPOR RECOVERY UNITS: MARKET ESTIMATES & FORECAST, BY END USE, 2023-2032 (USD MILLION) 64
      28. TABLE 27 UK: VAPOR RECOVERY UNITS: MARKET ESTIMATES & FORECAST, BY HORSEPOWER, 2023-2032 (USD MILLION) 65
      29. TABLE 28 UK: VAPOR RECOVERY UNITS: MARKET ESTIMATES & FORECAST, BY APPLICATION, 2023-2032 (USD MILLION) 66
      30. TABLE 29 UK: VAPOR RECOVERY UNITS: MARKET ESTIMATES & FORECAST, BY END USE, 2023-2032 (USD MILLION) 66
      31. TABLE 30 GERMANY: VAPOR RECOVERY UNITS: MARKET ESTIMATES & FORECAST, BY HORSEPOWER, 2023-2032 (USD MILLION) 67
      32. TABLE 31 GERMANY: VAPOR RECOVERY UNITS: MARKET ESTIMATES & FORECAST, BY APPLICATION, 2023-2032 (USD MILLION) 68
      33. TABLE 32 GERMANY: VAPOR RECOVERY UNITS: MARKET ESTIMATES & FORECAST, BY END USE, 2023-2032 (USD MILLION) 68
      34. TABLE 33 FRANCE: VAPOR RECOVERY UNITS: MARKET ESTIMATES & FORECAST, BY HORSEPOWER, 2023-2032 (USD MILLION) 69
      35. TABLE 34 FRANCE: VAPOR RECOVERY UNITS: MARKET ESTIMATES & FORECAST, BY APPLICATION, 2023-2032 (USD MILLION) 69
      36. TABLE 35 FRANCE: VAPOR RECOVERY UNITS: MARKET ESTIMATES & FORECAST, BY END USE, 2023-2032 (USD MILLION) 70
      37. TABLE 36 ITALY: VAPOR RECOVERY UNITS: MARKET ESTIMATES & FORECAST, BY HORSEPOWER, 2023-2032 (USD MILLION) 70
      38. TABLE 37 ITALY: VAPOR RECOVERY UNITS: MARKET ESTIMATES & FORECAST, BY APPLICATION, 2023-2032 (USD MILLION) 71
      39. TABLE 38 ITALY: VAPOR RECOVERY UNITS: MARKET ESTIMATES & FORECAST, BY END USE, 2023-2032 (USD MILLION) 71
      40. TABLE 39 REST OF EUROPE VAPOR RECOVERY UNITS: MARKET ESTIMATES & FORECAST, BY HORSEPOWER, 2023-2032 (USD MILLION) 72
      41. TABLE 40 REST OF EUROPE VAPOR RECOVERY UNITS: MARKET ESTIMATES & FORECAST, BY APPLICATION, 2023-2032 (USD MILLION) 73
      42. TABLE 41 REST OF EUROPE VAPOR RECOVERY UNITS: MARKET ESTIMATES & FORECAST, BY END USE, 2023-2032 (USD MILLION) 73
      43. TABLE 42 ASIA-PACIFIC: VAPOR RECOVERY UNITS MARKET, BY COUNTRY, 2023-2032 (USD MILLION) 74
      44. TABLE 43 ASIA-PACIFIC: VAPOR RECOVERY UNITS: MARKET ESTIMATES & FORECAST, BY HORSEPOWER, 2023-2032 (USD MILLION) 74
      45. TABLE 44 ASIA-PACIFIC: VAPOR RECOVERY UNITS: MARKET ESTIMATES & FORECAST, BY APPLICATION, 2023-2032 (USD MILLION) 75
      46. TABLE 45 ASIA-PACIFIC: VAPOR RECOVERY UNITS: MARKET ESTIMATES & FORECAST, BY END USE, 2023-2032 (USD MILLION) 75
      47. TABLE 46 CHINA: VAPOR RECOVERY UNITS: MARKET ESTIMATES & FORECAST, BY HORSEPOWER, 2023-2032 (USD MILLION) 76
      48. TABLE 47 CHINA: VAPOR RECOVERY UNITS: MARKET ESTIMATES & FORECAST, BY APPLICATION, 2023-2032 (USD MILLION) 77
      49. TABLE 48 CHINA: VAPOR RECOVERY UNITS: MARKET ESTIMATES & FORECAST, BY END USE, 2023-2032 (USD MILLION) 77
      50. TABLE 49 INDIA: VAPOR RECOVERY UNITS: MARKET ESTIMATES & FORECAST, BY HORSEPOWER, 2023-2032 (USD MILLION) 78
      51. TABLE 50 INDIA: VAPOR RECOVERY UNITS: MARKET ESTIMATES & FORECAST, BY APPLICATION, 2023-2032 (USD MILLION) 79
      52. TABLE 51 INDIA: VAPOR RECOVERY UNITS: MARKET ESTIMATES & FORECAST, BY END USE, 2023-2032 (USD MILLION) 79
      53. TABLE 52 JAPAN: VAPOR RECOVERY UNITS: MARKET ESTIMATES & FORECAST, BY HORSEPOWER, 2023-2032 (USD MILLION) 80
      54. TABLE 53 JAPAN: VAPOR RECOVERY UNITS: MARKET ESTIMATES & FORECAST, BY APPLICATION, 2023-2032 (USD MILLION) 80
      55. TABLE 54 JAPAN: VAPOR RECOVERY UNITS: MARKET ESTIMATES & FORECAST, BY END USE, 2023-2032 (USD MILLION) 81
      56. TABLE 55 SOUTH KOREA: VAPOR RECOVERY UNITS: MARKET ESTIMATES & FORECAST, BY HORSEPOWER, 2023-2032 (USD MILLION) 81
    Vapor Recovery Units Market Segmentation

    Vapor Recovery Units Market By Horsepower Outlook (USD Billion, 2018-2032)

    • Up to 50 HP
    • 51-200 HP
    • 201-500 HP
    • 501-1000 HP
    • Above 1000 HP

    Vapor Recovery Units Market By Application Outlook (USD Billion, 2018-2032)

    • Oil Tank Vapors
    • Marine Loading Terminals
    • Barge Degassing
    • Truck Loading
    • Vapor Particulate Filter
    • Railcar Loading
    • Storage Terminals

    Vapor Recovery Units Market By End-Use Outlook (USD Billion, 2018-2032)

    • Oil & Gas
    • Landfill
    • Chemicals & Petrochemicals
    • Pharmaceuticals

    Vapor Recovery Units Market Regional Outlook (USD Billion, 2018-2032)

    • North America Outlook (USD Billion, 2018-2032)

      • North America Vapor Recovery Units Market By Horsepower

        • Up to 50 HP
        • 51-200 HP
        • 201-500 HP
        • 501-1000 HP
        • Above 1000 HP
    • North America Vapor Recovery Units Market By Application

        • Oil Tank Vapors
        • Marine Loading Terminals
        • Barge Degassing
        • Truck Loading
        • Vapor Particulate Filter
        • Railcar Loading
        • Storage Terminals
      • North America Vapor Recovery Units Market By End-Use

        • Oil & Gas
        • Landfill
        • Chemicals & Petrochemicals
        • Pharmaceuticals
      • US Outlook (USD Billion, 2018-2032)

      • US Vapor Recovery Units Market By Horsepower

        • Up to 50 HP
        • 51-200 HP
        • 201-500 HP
        • 501-1000 HP
        • Above 1000 HP
      • US Vapor Recovery Units Market By Application

        • Oil Tank Vapors
        • Marine Loading Terminals
        • Barge Degassing
        • Truck Loading
        • Vapor Particulate Filter
        • Railcar Loading
        • Storage Terminals
      • US Vapor Recovery Units Market By End-Use

        • Oil & Gas
        • Landfill
        • Chemicals & Petrochemicals
        • Pharmaceuticals
      • CANADA Outlook (USD Billion, 2018-2032)

      • CANADA Vapor Recovery Units Market By Horsepower

        • Up to 50 HP
        • 51-200 HP
        • 201-500 HP
        • 501-1000 HP
        • Above 1000 HP
      • CANADA Vapor Recovery Units Market By Application

        • Oil Tank Vapors
        • Marine Loading Terminals
        • Barge Degassing
        • Truck Loading
        • Vapor Particulate Filter
        • Railcar Loading
        • Storage Terminals
      • CANADA Vapor Recovery Units Market By End-Use

        • Oil & Gas
        • Landfill
        • Chemicals & Petrochemicals
        • Pharmaceuticals
    • Europe Outlook (USD Billion, 2018-2032)

      • Europe Vapor Recovery Units Market By Horsepower

        • Up to 50 HP
        • 51-200 HP
        • 201-500 HP
        • 501-1000 HP
        • Above 1000 HP
      • Europe Vapor Recovery Units Market By Application

        • Oil Tank Vapors
        • Marine Loading Terminals
        • Barge Degassing
        • Truck Loading
        • Vapor Particulate Filter
        • Railcar Loading
        • Storage Terminals
      • Europe Vapor Recovery Units Market By End-Use

        • Oil & Gas
        • Landfill
        • Chemicals & Petrochemicals
        • Pharmaceuticals
      • Germany Outlook (USD Billion, 2018-2032)

      • Germany Vapor Recovery Units Market By Horsepower

        • Up to 50 HP
        • 51-200 HP
        • 201-500 HP
        • 501-1000 HP
        • Above 1000 HP
      • Germany Vapor Recovery Units Market By Application

        • Oil Tank Vapors
        • Marine Loading Terminals
        • Barge Degassing
        • Truck Loading
        • Vapor Particulate Filter
        • Railcar Loading
        • Storage Terminals
      • Germany Vapor Recovery Units Market By End-Use

        • Oil & Gas
        • Landfill
        • Chemicals & Petrochemicals
        • Pharmaceuticals
      • France Outlook (USD Billion, 2018-2032)

      • France Vapor Recovery Units Market By Horsepower

        • Up to 50 HP
        • 51-200 HP
        • 201-500 HP
        • 501-1000 HP
        • Above 1000 HP
      • France Vapor Recovery Units Market By Application

        • Oil Tank Vapors
        • Marine Loading Terminals
        • Barge Degassing
        • Truck Loading
        • Vapor Particulate Filter
        • Railcar Loading
        • Storage Terminals
      • France Vapor Recovery Units Market By End-Use

        • Oil & Gas
        • Landfill
        • Chemicals & Petrochemicals
        • Pharmaceuticals
      • UK Outlook (USD Billion, 2018-2032)

      • UK Vapor Recovery Units Market By Horsepower

        • Up to 50 HP
        • 51-200 HP
        • 201-500 HP
        • 501-1000 HP
        • Above 1000 HP
      • UK Vapor Recovery Units Market By Application

        • Oil Tank Vapors
        • Marine Loading Terminals
        • Barge Degassing
        • Truck Loading
        • Vapor Particulate Filter
        • Railcar Loading
        • Storage Terminals
      • UK Vapor Recovery Units Market By End-Use

        • Oil & Gas
        • Landfill
        • Chemicals & Petrochemicals
        • Pharmaceuticals
      • ITALY Outlook (USD Billion, 2018-2032)

      • ITALY Vapor Recovery Units Market By Horsepower

        • Up to 50 HP
        • 51-200 HP
        • 201-500 HP
        • 501-1000 HP
        • Above 1000 HP
      • ITALY Vapor Recovery Units Market By Application

        • Oil Tank Vapors
        • Marine Loading Terminals
        • Barge Degassing
        • Truck Loading
        • Vapor Particulate Filter
        • Railcar Loading
        • Storage Terminals
      • ITALY Vapor Recovery Units Market By End-Use

        • Oil & Gas
        • Landfill
        • Chemicals & Petrochemicals
        • Pharmaceuticals
      • SPAIN Outlook (USD Billion, 2018-2032)

      • Spain Vapor Recovery Units Market By Horsepower

        • Up to 50 HP
        • 51-200 HP
        • 201-500 HP
        • 501-1000 HP
        • Above 1000 HP
      • Spain Vapor Recovery Units Market By Application

        • Oil Tank Vapors
        • Marine Loading Terminals
        • Barge Degassing
        • Truck Loading
        • Vapor Particulate Filter
        • Railcar Loading
        • Storage Terminals
      • Spain Vapor Recovery Units Market By End-Use

        • Oil & Gas
        • Landfill
        • Chemicals & Petrochemicals
        • Pharmaceuticals
      • Rest Of Europe Outlook (USD Billion, 2018-2032)

      • Rest Of Europe Vapor Recovery Units Market By Horsepower

        • Up to 50 HP
        • 51-200 HP
        • 201-500 HP
        • 501-1000 HP
        • Above 1000 HP
      • REST OF EUROPE Vapor Recovery Units Market By Application

        • Oil Tank Vapors
        • Marine Loading Terminals
        • Barge Degassing
        • Truck Loading
        • Vapor Particulate Filter
        • Railcar Loading
        • Storage Terminals
      • REST OF EUROPE Vapor Recovery Units Market By End-Use

        • Oil & Gas
        • Landfill
        • Chemicals & Petrochemicals
        • Pharmaceuticals
    • Asia-Pacific Outlook (USD Billion, 2018-2032)
      • Asia-Pacific Vapor Recovery Units Market By Horsepower

        • Up to 50 HP
        • 51-200 HP
        • 201-500 HP
        • 501-1000 HP
        • Above 1000 HP
      • Asia-Pacific Vapor Recovery Units Market By Application

        • Oil Tank Vapors
        • Marine Loading Terminals
        • Barge Degassing
        • Truck Loading
        • Vapor Particulate Filter
        • Railcar Loading
        • Storage Terminals
      • Asia-Pacific Vapor Recovery Units Market By End-Use

        • Oil & Gas
        • Landfill
        • Chemicals & Petrochemicals
        • Pharmaceuticals
      • China Outlook (USD Billion, 2018-2032)

      • China Vapor Recovery Units Market By Horsepower

        • Up to 50 HP
        • 51-200 HP
        • 201-500 HP
        • 501-1000 HP
        • Above 1000 HP
      • China Vapor Recovery Units Market By Application

        • Oil Tank Vapors
        • Marine Loading Terminals
        • Barge Degassing
        • Truck Loading
        • Vapor Particulate Filter
        • Railcar Loading
        • Storage Terminals
      • China Vapor Recovery Units Market By End-Use

        • Oil & Gas
        • Landfill
        • Chemicals & Petrochemicals
        • Pharmaceuticals
      • Japan Outlook (USD Billion, 2018-2032)

      • Japan Vapor Recovery Units Market By Horsepower

        • Up to 50 HP
        • 51-200 HP
        • 201-500 HP
        • 501-1000 HP
        • Above 1000 HP
      • Japan Vapor Recovery Units Market By Application

        • Oil Tank Vapors
        • Marine Loading Terminals
        • Barge Degassing
        • Truck Loading
        • Vapor Particulate Filter
        • Railcar Loading
        • Storage Terminals
      • Japan Vapor Recovery Units Market By End-Use

        • Oil & Gas
        • Landfill
        • Chemicals & Petrochemicals
        • Pharmaceuticals
      • India Outlook (USD Billion, 2018-2032)

      • India Vapor Recovery Units Market By Horsepower

        • Up to 50 HP
        • 51-200 HP
        • 201-500 HP
        • 501-1000 HP
        • Above 1000 HP
      • India Vapor Recovery Units Market By Application

        • Oil Tank Vapors
        • Marine Loading Terminals
        • Barge Degassing
        • Truck Loading
        • Vapor Particulate Filter
        • Railcar Loading
        • Storage Terminals
      • India Vapor Recovery Units Market By End-Use

        • Oil & Gas
        • Landfill
        • Chemicals & Petrochemicals
        • Pharmaceuticals
      • Australia Outlook (USD Billion, 2018-2032)

      • Australia Vapor Recovery Units Market By Horsepower

        • Up to 50 HP
        • 51-200 HP
        • 201-500 HP
        • 501-1000 HP
        • Above 1000 HP
      • Australia Vapor Recovery Units Market By Application

        • Oil Tank Vapors
        • Marine Loading Terminals
        • Barge Degassing
        • Truck Loading
        • Vapor Particulate Filter
        • Railcar Loading
        • Storage Terminals
      • Australia Vapor Recovery Units Market By End-Use

        • Oil & Gas
        • Landfill
        • Chemicals & Petrochemicals
        • Pharmaceuticals
      • Rest of Asia-Pacific Outlook (USD Billion, 2018-2032)

      • Rest of Asia-Pacific Vapor Recovery Units Market By Horsepower

        • Up to 50 HP
        • 51-200 HP
        • 201-500 HP
        • 501-1000 HP
        • Above 1000 HP
      • Rest of Asia-Pacific Vapor Recovery Units Market By Application

        • Oil Tank Vapors
        • Marine Loading Terminals
        • Barge Degassing
        • Truck Loading
        • Vapor Particulate Filter
        • Railcar Loading
        • Storage Terminals
      • Rest of Asia-Pacific Vapor Recovery Units Market By End-Use

        • Oil & Gas
        • Landfill
        • Chemicals & Petrochemicals
        • Pharmaceuticals
    • Rest of the World Outlook (USD Billion, 2018-2032)

      • Rest of the World Vapor Recovery Units Market By Horsepower

        • Up to 50 HP
        • 51-200 HP
        • 201-500 HP
        • 501-1000 HP
        • Above 1000 HP
      • Rest of the World Vapor Recovery Units Market By Application

        • Oil Tank Vapors
        • Marine Loading Terminals
        • Barge Degassing
        • Truck Loading
        • Vapor Particulate Filter
        • Railcar Loading
        • Storage Terminals
      • Rest of the World Vapor Recovery Units Market By End-Use

        • Oil & Gas
        • Landfill
        • Chemicals & Petrochemicals
        • Pharmaceuticals
      • Middle East Outlook (USD Billion, 2018-2032)

      • Middle East Vapor Recovery Units Market By Horsepower

        • Up to 50 HP
        • 51-200 HP
        • 201-500 HP
        • 501-1000 HP
        • Above 1000 HP
      • Middle East Vapor Recovery Units Market By Application

        • Oil Tank Vapors
        • Marine Loading Terminals
        • Barge Degassing
        • Truck Loading
        • Vapor Particulate Filter
        • Railcar Loading
        • Storage Terminals
      • Middle East Vapor Recovery Units Market By End-Use

        • Oil & Gas
        • Landfill
        • Chemicals & Petrochemicals
        • Pharmaceuticals
      • Africa Outlook (USD Billion, 2018-2032)

      • Africa Vapor Recovery Units Market By Horsepower

        • Up to 50 HP
        • 51-200 HP
        • 201-500 HP
        • 501-1000 HP
        • Above 1000 HP
      • Africa Vapor Recovery Units Market By Application

        • Oil Tank Vapors
        • Marine Loading Terminals
        • Barge Degassing
        • Truck Loading
        • Vapor Particulate Filter
        • Railcar Loading
        • Storage Terminals
      • Africa Vapor Recovery Units Market By End-Use

        • Oil & Gas
        • Landfill
        • Chemicals & Petrochemicals
        • Pharmaceuticals
      • Latin America Outlook (USD Billion, 2018-2032)

      • Latin America Vapor Recovery Units Market By Horsepower

        • Up to 50 HP
        • 51-200 HP
        • 201-500 HP
        • 501-1000 HP
        • Above 1000 HP
      • Latin America Vapor Recovery Units Market By Application

        • Oil Tank Vapors
        • Marine Loading Terminals
        • Barge Degassing
        • Truck Loading
        • Vapor Particulate Filter
        • Railcar Loading
        • Storage Terminals
      • Latin America Vapor Recovery Units Market By End-Use

        • Oil & Gas
        • Landfill
        • Chemicals & Petrochemicals
        • Pharmaceuticals
    Infographic

    Free Sample Request

    Kindly complete the form below to receive a free sample of this Report

    Get Free Sample

    Customer Strories

    “I am very pleased with how market segments have been defined in a relevant way for my purposes (such as "Portable Freezers & refrigerators" and "last-mile"). In general the report is well structured. Thanks very much for your efforts.”

    Victoria Milne

    Founder
    Case Study
    Chemicals and Materials