Demand Response
Distributed Generation
Energy Storage
Renewable Energy Integration
Hybrid Virtual Power Plant
Conventional Virtual Power Plant
Software-Defined Virtual Power Plant
Residential
Commercial
Industrial
Centralized Control
Decentralized Control
Cloud-Based Control
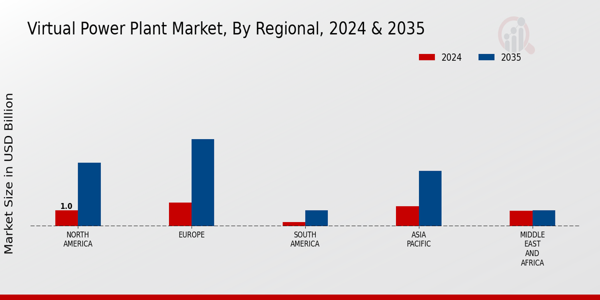
North America
Europe
South America
Asia Pacific
Middle East and Africa
North America Outlook (USD Billion, 2019-2035)
North America Virtual Power Plant Market by Technology Type
Demand Response
Distributed Generation
Energy Storage
Renewable Energy Integration
North America Virtual Power Plant Market by Type
Hybrid Virtual Power Plant
Conventional Virtual Power Plant
Software-Defined Virtual Power Plant
North America Virtual Power Plant Market by End Use Type
Residential
Commercial
Industrial
North America Virtual Power Plant Market by Control Mechanism Type
Centralized Control
Decentralized Control
Cloud-Based Control
North America Virtual Power Plant Market by Regional Type
US
Canada
US Outlook (USD Billion, 2019-2035)
US Virtual Power Plant Market by Technology Type
Demand Response
Distributed Generation
Energy Storage
Renewable Energy Integration
US Virtual Power Plant Market by Type
Hybrid Virtual Power Plant
Conventional Virtual Power Plant
Software-Defined Virtual Power Plant
US Virtual Power Plant Market by End Use Type
Residential
Commercial
Industrial
US Virtual Power Plant Market by Control Mechanism Type
Centralized Control
Decentralized Control
Cloud-Based Control
CANADA Outlook (USD Billion, 2019-2035)
CANADA Virtual Power Plant Market by Technology Type
Demand Response
Distributed Generation
Energy Storage
Renewable Energy Integration
CANADA Virtual Power Plant Market by Type
Hybrid Virtual Power Plant
Conventional Virtual Power Plant
Software-Defined Virtual Power Plant
CANADA Virtual Power Plant Market by End Use Type
Residential
Commercial
Industrial
CANADA Virtual Power Plant Market by Control Mechanism Type
Centralized Control
Decentralized Control
Cloud-Based Control
Europe Outlook (USD Billion, 2019-2035)
Europe Virtual Power Plant Market by Technology Type
Demand Response
Distributed Generation
Energy Storage
Renewable Energy Integration
Europe Virtual Power Plant Market by Type
Hybrid Virtual Power Plant
Conventional Virtual Power Plant
Software-Defined Virtual Power Plant
Europe Virtual Power Plant Market by End Use Type
Residential
Commercial
Industrial
Europe Virtual Power Plant Market by Control Mechanism Type
Centralized Control
Decentralized Control
Cloud-Based Control
Europe Virtual Power Plant Market by Regional Type
Germany
UK
France
Russia
Italy
Spain
Rest of Europe
GERMANY Outlook (USD Billion, 2019-2035)
GERMANY Virtual Power Plant Market by Technology Type
Demand Response
Distributed Generation
Energy Storage
Renewable Energy Integration
GERMANY Virtual Power Plant Market by Type
Hybrid Virtual Power Plant
Conventional Virtual Power Plant
Software-Defined Virtual Power Plant
GERMANY Virtual Power Plant Market by End Use Type
Residential
Commercial
Industrial
GERMANY Virtual Power Plant Market by Control Mechanism Type
Centralized Control
Decentralized Control
Cloud-Based Control
UK Outlook (USD Billion, 2019-2035)
UK Virtual Power Plant Market by Technology Type
Demand Response
Distributed Generation
Energy Storage
Renewable Energy Integration
UK Virtual Power Plant Market by Type
Hybrid Virtual Power Plant
Conventional Virtual Power Plant
Software-Defined Virtual Power Plant
UK Virtual Power Plant Market by End Use Type
Residential
Commercial
Industrial
UK Virtual Power Plant Market by Control Mechanism Type
Centralized Control
Decentralized Control
Cloud-Based Control
FRANCE Outlook (USD Billion, 2019-2035)
FRANCE Virtual Power Plant Market by Technology Type
Demand Response
Distributed Generation
Energy Storage
Renewable Energy Integration
FRANCE Virtual Power Plant Market by Type
Hybrid Virtual Power Plant
Conventional Virtual Power Plant
Software-Defined Virtual Power Plant
FRANCE Virtual Power Plant Market by End Use Type
Residential
Commercial
Industrial
FRANCE Virtual Power Plant Market by Control Mechanism Type
Centralized Control
Decentralized Control
Cloud-Based Control
RUSSIA Outlook (USD Billion, 2019-2035)
RUSSIA Virtual Power Plant Market by Technology Type
Demand Response
Distributed Generation
Energy Storage
Renewable Energy Integration
RUSSIA Virtual Power Plant Market by Type
Hybrid Virtual Power Plant
Conventional Virtual Power Plant
Software-Defined Virtual Power Plant
RUSSIA Virtual Power Plant Market by End Use Type
Residential
Commercial
Industrial
RUSSIA Virtual Power Plant Market by Control Mechanism Type
Centralized Control
Decentralized Control
Cloud-Based Control
ITALY Outlook (USD Billion, 2019-2035)
ITALY Virtual Power Plant Market by Technology Type
Demand Response
Distributed Generation
Energy Storage
Renewable Energy Integration
ITALY Virtual Power Plant Market by Type
Hybrid Virtual Power Plant
Conventional Virtual Power Plant
Software-Defined Virtual Power Plant
ITALY Virtual Power Plant Market by End Use Type
Residential
Commercial
Industrial
ITALY Virtual Power Plant Market by Control Mechanism Type
Centralized Control
Decentralized Control
Cloud-Based Control
SPAIN Outlook (USD Billion, 2019-2035)
SPAIN Virtual Power Plant Market by Technology Type
Demand Response
Distributed Generation
Energy Storage
Renewable Energy Integration
SPAIN Virtual Power Plant Market by Type
Hybrid Virtual Power Plant
Conventional Virtual Power Plant
Software-Defined Virtual Power Plant
SPAIN Virtual Power Plant Market by End Use Type
Residential
Commercial
Industrial
SPAIN Virtual Power Plant Market by Control Mechanism Type
Centralized Control
Decentralized Control
Cloud-Based Control
REST OF EUROPE Outlook (USD Billion, 2019-2035)
REST OF EUROPE Virtual Power Plant Market by Technology Type
Demand Response
Distributed Generation
Energy Storage
Renewable Energy Integration
REST OF EUROPE Virtual Power Plant Market by Type
Hybrid Virtual Power Plant
Conventional Virtual Power Plant
Software-Defined Virtual Power Plant
REST OF EUROPE Virtual Power Plant Market by End Use Type
Residential
Commercial
Industrial
REST OF EUROPE Virtual Power Plant Market by Control Mechanism Type
Centralized Control
Decentralized Control
Cloud-Based Control
APAC Outlook (USD Billion, 2019-2035)
APAC Virtual Power Plant Market by Technology Type
Demand Response
Distributed Generation
Energy Storage
Renewable Energy Integration
APAC Virtual Power Plant Market by Type
Hybrid Virtual Power Plant
Conventional Virtual Power Plant
Software-Defined Virtual Power Plant
APAC Virtual Power Plant Market by End Use Type
Residential
Commercial
Industrial
APAC Virtual Power Plant Market by Control Mechanism Type
Centralized Control
Decentralized Control
Cloud-Based Control
APAC Virtual Power Plant Market by Regional Type
China
India
Japan
South Korea
Malaysia
Thailand
Indonesia
Rest of APAC
CHINA Outlook (USD Billion, 2019-2035)
CHINA Virtual Power Plant Market by Technology Type
Demand Response
Distributed Generation
Energy Storage
Renewable Energy Integration
CHINA Virtual Power Plant Market by Type
Hybrid Virtual Power Plant
Conventional Virtual Power Plant
Software-Defined Virtual Power Plant
CHINA Virtual Power Plant Market by End Use Type
Residential
Commercial
Industrial
CHINA Virtual Power Plant Market by Control Mechanism Type
Centralized Control
Decentralized Control
Cloud-Based Control
INDIA Outlook (USD Billion, 2019-2035)
INDIA Virtual Power Plant Market by Technology Type
Demand Response
Distributed Generation
Energy Storage
Renewable Energy Integration
INDIA Virtual Power Plant Market by Type
Hybrid Virtual Power Plant
Conventional Virtual Power Plant
Software-Defined Virtual Power Plant
INDIA Virtual Power Plant Market by End Use Type
Residential
Commercial
Industrial
INDIA Virtual Power Plant Market by Control Mechanism Type
Centralized Control
Decentralized Control
Cloud-Based Control
JAPAN Outlook (USD Billion, 2019-2035)
JAPAN Virtual Power Plant Market by Technology Type
Demand Response
Distributed Generation
Energy Storage
Renewable Energy Integration
JAPAN Virtual Power Plant Market by Type
Hybrid Virtual Power Plant
Conventional Virtual Power Plant
Software-Defined Virtual Power Plant
JAPAN Virtual Power Plant Market by End Use Type
Residential
Commercial
Industrial
JAPAN Virtual Power Plant Market by Control Mechanism Type
Centralized Control
Decentralized Control
Cloud-Based Control
SOUTH KOREA Outlook (USD Billion, 2019-2035)
SOUTH KOREA Virtual Power Plant Market by Technology Type
Demand Response
Distributed Generation
Energy Storage
Renewable Energy Integration
SOUTH KOREA Virtual Power Plant Market by Type
Hybrid Virtual Power Plant
Conventional Virtual Power Plant
Software-Defined Virtual Power Plant
SOUTH KOREA Virtual Power Plant Market by End Use Type
Residential
Commercial
Industrial
SOUTH KOREA Virtual Power Plant Market by Control Mechanism Type
Centralized Control
Decentralized Control
Cloud-Based Control
MALAYSIA Outlook (USD Billion, 2019-2035)
MALAYSIA Virtual Power Plant Market by Technology Type
Demand Response
Distributed Generation
Energy Storage
Renewable Energy Integration
MALAYSIA Virtual Power Plant Market by Type
Hybrid Virtual Power Plant
Conventional Virtual Power Plant
Software-Defined Virtual Power Plant
MALAYSIA Virtual Power Plant Market by End Use Type
Residential
Commercial
Industrial
MALAYSIA Virtual Power Plant Market by Control Mechanism Type
Centralized Control
Decentralized Control
Cloud-Based Control
THAILAND Outlook (USD Billion, 2019-2035)
THAILAND Virtual Power Plant Market by Technology Type
Demand Response
Distributed Generation
Energy Storage
Renewable Energy Integration
THAILAND Virtual Power Plant Market by Type
Hybrid Virtual Power Plant
Conventional Virtual Power Plant
Software-Defined Virtual Power Plant
THAILAND Virtual Power Plant Market by End Use Type
Residential
Commercial
Industrial
THAILAND Virtual Power Plant Market by Control Mechanism Type
Centralized Control
Decentralized Control
Cloud-Based Control
INDONESIA Outlook (USD Billion, 2019-2035)
INDONESIA Virtual Power Plant Market by Technology Type
Demand Response
Distributed Generation
Energy Storage
Renewable Energy Integration
INDONESIA Virtual Power Plant Market by Type
Hybrid Virtual Power Plant
Conventional Virtual Power Plant
Software-Defined Virtual Power Plant
INDONESIA Virtual Power Plant Market by End Use Type
Residential
Commercial
Industrial
INDONESIA Virtual Power Plant Market by Control Mechanism Type
Centralized Control
Decentralized Control
Cloud-Based Control
REST OF APAC Outlook (USD Billion, 2019-2035)
REST OF APAC Virtual Power Plant Market by Technology Type
Demand Response
Distributed Generation
Energy Storage
Renewable Energy Integration
REST OF APAC Virtual Power Plant Market by Type
Hybrid Virtual Power Plant
Conventional Virtual Power Plant
Software-Defined Virtual Power Plant
REST OF APAC Virtual Power Plant Market by End Use Type
Residential
Commercial
Industrial
REST OF APAC Virtual Power Plant Market by Control Mechanism Type
Centralized Control
Decentralized Control
Cloud-Based Control
South America Outlook (USD Billion, 2019-2035)
South America Virtual Power Plant Market by Technology Type
Demand Response
Distributed Generation
Energy Storage
Renewable Energy Integration
South America Virtual Power Plant Market by Type
Hybrid Virtual Power Plant
Conventional Virtual Power Plant
Software-Defined Virtual Power Plant
South America Virtual Power Plant Market by End Use Type
Residential
Commercial
Industrial
South America Virtual Power Plant Market by Control Mechanism Type
Centralized Control
Decentralized Control
Cloud-Based Control
South America Virtual Power Plant Market by Regional Type
Brazil
Mexico
Argentina
Rest of South America
BRAZIL Outlook (USD Billion, 2019-2035)
BRAZIL Virtual Power Plant Market by Technology Type
Demand Response
Distributed Generation
Energy Storage
Renewable Energy Integration
BRAZIL Virtual Power Plant Market by Type
Hybrid Virtual Power Plant
Conventional Virtual Power Plant
Software-Defined Virtual Power Plant
BRAZIL Virtual Power Plant Market by End Use Type
Residential
Commercial
Industrial
BRAZIL Virtual Power Plant Market by Control Mechanism Type
Centralized Control
Decentralized Control
Cloud-Based Control
MEXICO Outlook (USD Billion, 2019-2035)
MEXICO Virtual Power Plant Market by Technology Type
Demand Response
Distributed Generation
Energy Storage
Renewable Energy Integration
MEXICO Virtual Power Plant Market by Type
Hybrid Virtual Power Plant
Conventional Virtual Power Plant
Software-Defined Virtual Power Plant
MEXICO Virtual Power Plant Market by End Use Type
Residential
Commercial
Industrial
MEXICO Virtual Power Plant Market by Control Mechanism Type
Centralized Control
Decentralized Control
Cloud-Based Control
ARGENTINA Outlook (USD Billion, 2019-2035)
ARGENTINA Virtual Power Plant Market by Technology Type
Demand Response
Distributed Generation
Energy Storage
Renewable Energy Integration
ARGENTINA Virtual Power Plant Market by Type
Hybrid Virtual Power Plant
Conventional Virtual Power Plant
Software-Defined Virtual Power Plant
ARGENTINA Virtual Power Plant Market by End Use Type
Residential
Commercial
Industrial
ARGENTINA Virtual Power Plant Market by Control Mechanism Type
Centralized Control
Decentralized Control
Cloud-Based Control
REST OF SOUTH AMERICA Outlook (USD Billion, 2019-2035)
REST OF SOUTH AMERICA Virtual Power Plant Market by Technology Type
Demand Response
Distributed Generation
Energy Storage
Renewable Energy Integration
REST OF SOUTH AMERICA Virtual Power Plant Market by Type
Hybrid Virtual Power Plant
Conventional Virtual Power Plant
Software-Defined Virtual Power Plant
REST OF SOUTH AMERICA Virtual Power Plant Market by End Use Type
Residential
Commercial
Industrial
REST OF SOUTH AMERICA Virtual Power Plant Market by Control Mechanism Type
Centralized Control
Decentralized Control
Cloud-Based Control
MEA Outlook (USD Billion, 2019-2035)
MEA Virtual Power Plant Market by Technology Type
Demand Response
Distributed Generation
Energy Storage
Renewable Energy Integration
MEA Virtual Power Plant Market by Type
Hybrid Virtual Power Plant
Conventional Virtual Power Plant
Software-Defined Virtual Power Plant
MEA Virtual Power Plant Market by End Use Type
Residential
Commercial
Industrial
MEA Virtual Power Plant Market by Control Mechanism Type
Centralized Control
Decentralized Control
Cloud-Based Control
MEA Virtual Power Plant Market by Regional Type
GCC Countries
South Africa
Rest of MEA
GCC COUNTRIES Outlook (USD Billion, 2019-2035)
GCC COUNTRIES Virtual Power Plant Market by Technology Type
Demand Response
Distributed Generation
Energy Storage
Renewable Energy Integration
GCC COUNTRIES Virtual Power Plant Market by Type
Hybrid Virtual Power Plant
Conventional Virtual Power Plant
Software-Defined Virtual Power Plant
GCC COUNTRIES Virtual Power Plant Market by End Use Type
Residential
Commercial
Industrial
GCC COUNTRIES Virtual Power Plant Market by Control Mechanism Type
Centralized Control
Decentralized Control
Cloud-Based Control
SOUTH AFRICA Outlook (USD Billion, 2019-2035)
SOUTH AFRICA Virtual Power Plant Market by Technology Type
Demand Response
Distributed Generation
Energy Storage
Renewable Energy Integration
SOUTH AFRICA Virtual Power Plant Market by Type
Hybrid Virtual Power Plant
Conventional Virtual Power Plant
Software-Defined Virtual Power Plant
SOUTH AFRICA Virtual Power Plant Market by End Use Type
Residential
Commercial
Industrial
SOUTH AFRICA Virtual Power Plant Market by Control Mechanism Type
Centralized Control
Decentralized Control
Cloud-Based Control
REST OF MEA Outlook (USD Billion, 2019-2035)
REST OF MEA Virtual Power Plant Market by Technology Type
Demand Response
Distributed Generation
Energy Storage
Renewable Energy Integration
REST OF MEA Virtual Power Plant Market by Type
Hybrid Virtual Power Plant
Conventional Virtual Power Plant
Software-Defined Virtual Power Plant
REST OF MEA Virtual Power Plant Market by End Use Type
Residential
Commercial
Industrial
REST OF MEA Virtual Power Plant Market by Control Mechanism Type
Centralized Control
Decentralized Control
Cloud-Based Control


Leave a Comment