• Cat-intel
  • MedIntelliX
  • Resources
  • About Us
  • Hero Background
    English
    Chinese
    French
    Japanese
    Korean
    German
    Spanish

    Acrylic Acid Market Size

    ID: MRFR/CnM/1931-CR
    166 Pages
    Priya Nagrale
    February 2021

    Acrylic Acid Market Research Report Information By Type (Superabsorbent Polymers, Methyl Acrylate, Ethyl Acrylate, Elastomers, Butyl Acrylate), By Application (Paper Coating, Adhesives & Sealants, Agriculture, Plastic Sheets, Diapers) - Forecast till 2035

    Share:
    Download PDF ×

    We do not share your information with anyone. However, we may send you emails based on your report interest from time to time. You may contact us at any time to opt-out.

    Acrylic Acid Market Infographic
    $ 4,950.0
    $ 5,950.0
    $ 7,250.0

    Acrylic Acid Size

    Acrylic Acid Market Growth Projections and Opportunities

    Acrylic Acid Market is projected to be worth USD 19.2 billion by 2030, registering a CAGR of 4.80% during the forecast period (2022-2030). The Acrylic Acid market is profoundly influenced by various market factors that collectively shape its dynamics. One of the pivotal determinants is the demand from downstream industries such as adhesives, superabsorbent polymers, and coatings. As these industries experience fluctuations in production and consumption, the demand for acrylic acid, a key raw material, undergoes corresponding changes. The construction sector, in particular, significantly impacts the acrylic acid market through its influence on coatings and adhesives used in building materials. Economic conditions, urbanization trends, and construction activities thus play a crucial role in steering the acrylic acid market. Global environmental regulations and sustainability concerns contribute to the evolving landscape of the acrylic acid market. Stringent environmental standards and the push towards eco-friendly products drive the demand for sustainable and bio-based acrylic acid derivatives. Companies that prioritize green chemistry and invest in the development of environmentally friendly acrylic acid products position themselves favorably in the market. As consumers increasingly seek sustainable options, the ability to offer eco-friendly alternatives becomes a key competitive advantage. The feedstock market, particularly propylene, is another significant factor affecting the acrylic acid market. Propylene is a primary raw material in acrylic acid production, and its availability and pricing directly impact the overall production costs. Fluctuations in the global supply and pricing of propylene can lead to volatility in the acrylic acid market. Companies must closely monitor and adapt to changes in the propylene market to maintain cost competitiveness and profitability. Technological advancements play a critical role in shaping the acrylic acid market. Innovations in production processes, catalyst technologies, and purification methods can enhance efficiency, reduce energy consumption, and improve the overall quality of acrylic acid. Companies that invest in research and development to optimize manufacturing processes and introduce innovative products gain a competitive edge in the market. Additionally, advancements in application technologies, such as improved formulations for adhesives or coatings, can open up new avenues for acrylic acid utilization. Geopolitical factors and trade policies also influence the acrylic acid market. The global nature of the acrylic acid supply chain makes it susceptible to trade tensions, tariff changes, and geopolitical events. Shifts in international relations or trade agreements can impact the import and export dynamics of acrylic acid, affecting market prices and availability. Companies operating in the acrylic acid market need to navigate these geopolitical uncertainties to mitigate risks and ensure a stable supply chain. Market competition is a constant factor in the acrylic acid sector. The presence of multiple players, each offering a range of acrylic acid derivatives, intensifies competition. Companies differentiate themselves through product quality, pricing strategies, and customer service. Mergers and acquisitions, as well as partnerships, are common strategies employed by companies to strengthen their market position and expand their product portfolios. Consumer preferences and industry trends also contribute to the acrylic acid market's evolution. Changes in consumer preferences for sustainable products, increased awareness of environmental impact, and advancements in application technologies influence the demand for specific acrylic acid derivatives. Companies that anticipate and adapt to these trends are better positioned to meet market demands effectively and capitalize on emerging opportunities.
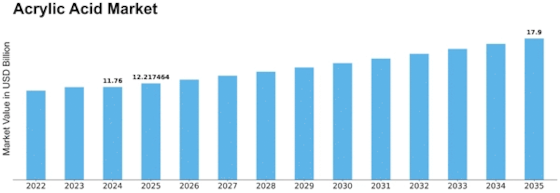
    Acrylic Acid Market Size Graph

    Market Summary

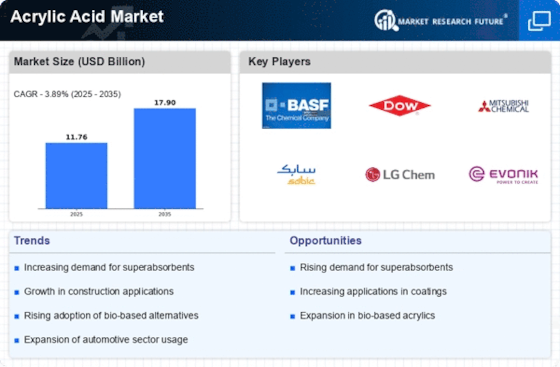
    As per Market Research Future Analysis, the Acrylic Acid Market was valued at USD 11.76 billion in 2024 and is projected to grow to USD 17.90 billion by 2035, with a CAGR of 3.89% from 2025 to 2035. Acrylic acid, a colorless organic liquid, is primarily used as a monomer in polymer synthesis and has applications across various industries including food processing, pharmaceuticals, and personal care. The market is driven by increasing demand for polymers, paints, coatings, and superabsorbent polymers, particularly in emerging economies like India and China. Recent developments include Nippon Shokubai's new factory in Indonesia and Lummus Technology's licensing agreement for acrylic acid technology.

    Key Market Trends & Highlights

    Key trends influencing the Acrylic Acid Market include:

    • Projected market growth from USD 11.76 billion in 2024 to USD 15.96 billion by 2032.
    • Rising demand for superabsorbent polymers in personal care is expected to drive market share growth.
    • Asia Pacific region controls 70% of the acrylic acid market demand, led by China and India.
    • Emerging economies are witnessing significant growth in sectors utilizing acrylic acid.

    Market Size & Forecast

    2024 Market Size USD 11.76 Billion
    2035 Market Size USD 17.90 Billion
    CAGR (2024-2035) 3.89%

    Major Players

    BASF SE, The Dow Chemical Company, Arkema SA, Evonik Industries, Nippon Shokubai Co. Ltd, Taixing Jurong Chemical Co Ltd, PJSC Sibur Holding, LG Chemicals, Shenyang Chemical Co Ltd, Mitsubishi Chemical, Hexion Inc.

    Market Trends

    The global acrylic acid market is poised for growth, driven by increasing demand in various applications such as superabsorbent polymers and coatings, which reflects a broader trend towards sustainable materials and innovative manufacturing processes.

    U.S. Department of Commerce

    Acrylic Acid Market Market Drivers

    Market Growth Projections

    The Global Acrylic Acid Market Industry is projected to experience substantial growth over the next decade, with estimates indicating a market value of 11.8 USD Billion in 2024 and a potential increase to 17.9 USD Billion by 2035. This growth trajectory suggests a compound annual growth rate of 3.89% from 2025 to 2035, reflecting the increasing demand across various sectors. The expansion of applications in superabsorbent polymers, paints and coatings, adhesives, and textiles underscores the versatility of acrylic acid. Such projections highlight the industry's potential for innovation and adaptation in response to evolving market needs.

    Growth in Paints and Coatings Sector

    The Global Acrylic Acid Market Industry is significantly influenced by the expansion of the paints and coatings sector, which increasingly incorporates acrylic acid-based products due to their superior properties. These products offer enhanced durability, weather resistance, and aesthetic appeal, making them preferred choices for both industrial and consumer applications. The market is expected to witness a compound annual growth rate of 3.89% from 2025 to 2035, driven by the rising construction and automotive industries. This growth is indicative of the broader trend towards sustainable and high-performance materials in coatings, further solidifying acrylic acid's role in this sector.

    Advancements in Production Technologies

    The Global Acrylic Acid Market Industry benefits from ongoing advancements in production technologies, which enhance the efficiency and sustainability of acrylic acid manufacturing. Innovations such as improved catalytic processes and the utilization of renewable feedstocks are becoming increasingly prevalent. These advancements not only reduce production costs but also minimize environmental impact, aligning with global sustainability goals. As manufacturers adopt these technologies, the market is poised for growth, potentially attracting investments aimed at enhancing production capabilities. This evolution in production methods may play a crucial role in meeting the rising global demand for acrylic acid across various applications.

    Increasing Use in Adhesives and Sealants

    The Global Acrylic Acid Market Industry sees a growing application of acrylic acid in adhesives and sealants, which are essential in various industries, including automotive, construction, and electronics. The versatility of acrylic acid allows for the formulation of adhesives that exhibit strong bonding properties and resistance to environmental factors. As industries seek to improve product performance and longevity, the demand for acrylic acid-based adhesives is expected to rise. This trend is likely to contribute to the market's projected growth, with an anticipated value of 17.9 USD Billion by 2035, highlighting the importance of acrylic acid in modern manufacturing processes.

    Rising Demand for Superabsorbent Polymers

    The Global Acrylic Acid Market Industry experiences a notable surge in demand for superabsorbent polymers, primarily utilized in personal care products such as diapers and feminine hygiene items. This demand is driven by an increasing global population and heightened awareness regarding hygiene. As a result, the market for acrylic acid is projected to reach 11.8 USD Billion in 2024, reflecting the growing necessity for efficient absorbent materials. The expansion of the personal care sector, particularly in developing regions, further propels this trend, indicating a robust growth trajectory for acrylic acid applications in superabsorbent polymers.

    Emerging Applications in the Textile Industry

    The Global Acrylic Acid Market Industry is witnessing emerging applications in the textile industry, where acrylic acid is utilized in the production of fibers and textiles. The increasing demand for high-performance fabrics, particularly in sportswear and outdoor apparel, drives the need for acrylic acid-based materials that offer durability and moisture-wicking properties. This trend is indicative of a broader shift towards innovative textile solutions that cater to consumer preferences for functionality and comfort. As the textile industry evolves, the role of acrylic acid is likely to expand, further contributing to the market's overall growth.

    Market Segment Insights

    Regional Insights

    Key Companies in the Acrylic Acid Market market include

    Industry Developments

    • Q2 2024: Arkema inaugurates new acrylic acid production line in France Arkema announced the opening of a new acrylic acid production line at its Carling site in France, aimed at increasing capacity to meet growing demand in Europe for superabsorbent polymers and coatings.
    • Q2 2024: BASF to invest in expansion of acrylic acid production at Ludwigshafen site BASF revealed a significant investment to expand its acrylic acid production capacity at its Ludwigshafen, Germany facility, targeting increased supply for hygiene and industrial applications.
    • Q3 2024: LG Chem and ADM launch joint venture for bio-based acrylic acid in the US LG Chem and Archer Daniels Midland (ADM) announced the formation of a joint venture to build and operate a bio-based acrylic acid plant in the United States, focusing on sustainable production from renewable feedstocks.
    • Q1 2024: Evonik appoints new head of Acrylic Acid & Derivatives business line Evonik Industries named Dr. Julia Reuter as the new head of its Acrylic Acid & Derivatives business line, effective March 2024, as part of its strategy to strengthen leadership in specialty chemicals.
    • Q2 2024: Dow announces $300 million upgrade to Texas acrylic acid facility Dow Inc. confirmed a $300 million investment to modernize and expand its acrylic acid production facility in Freeport, Texas, aiming to improve efficiency and environmental performance.
    • Q3 2024: Sasol signs long-term supply contract for acrylic acid with Procter & Gamble Sasol secured a multi-year supply agreement with Procter & Gamble to provide acrylic acid for use in hygiene products, reinforcing Sasol's position as a key supplier to the consumer goods sector.
    • Q1 2025: Mitsubishi Chemical Group completes acquisition of Indian acrylic acid producer Mitsubishi Chemical Group finalized the acquisition of a majority stake in an Indian acrylic acid manufacturing company, expanding its footprint in the fast-growing South Asian market.
    • Q2 2025: INEOS launches new low-carbon acrylic acid product line INEOS announced the commercial launch of a new low-carbon acrylic acid product line, leveraging advanced process technology to reduce greenhouse gas emissions in production.
    • Q1 2024: Sumitomo Chemical receives regulatory approval for new acrylic acid plant in Japan Sumitomo Chemical obtained final regulatory clearance to construct a new acrylic acid production facility in Chiba, Japan, with operations expected to commence in late 2025.
    • Q4 2024: Celanese announces partnership with Chinese firm for acrylic acid derivatives Celanese Corporation entered into a strategic partnership with a leading Chinese chemical company to co-develop and market acrylic acid derivatives for the Asia-Pacific region.
    • Q2 2025: Arkema unveils pilot project for bio-based acrylic acid in France Arkema launched a pilot project at its Carling site to produce bio-based acrylic acid from renewable feedstocks, aiming to accelerate the transition to sustainable materials.
    • Q1 2025: BASF signs supply agreement with Kimberly-Clark for sustainable acrylic acid BASF entered into a long-term supply agreement with Kimberly-Clark to provide sustainably produced acrylic acid for use in hygiene and personal care products.

    Future Outlook

    Acrylic Acid Market Future Outlook

    The Global Acrylic Acid Market is projected to grow at a 3.89% CAGR from 2025 to 2035, driven by increasing demand in superabsorbent polymers and coatings.

    New opportunities lie in:

    • Invest in R&D for bio-based acrylic acid production to meet sustainability goals.
    • Expand applications in emerging markets, particularly in construction and automotive sectors.
    • Leverage advanced manufacturing technologies to enhance production efficiency and reduce costs.

    By 2035, the market is expected to achieve robust growth, solidifying its position as a key player in the chemical industry.

    Market Segmentation

    Report Scope

    Attribute/Metric Details
    Market Size 2024 USD 11.76 billion
    Market Size 2035 17.90
    Compound Annual Growth Rate (CAGR) 3.89% (2025 - 2035)
    Base Year 2024
    Forecast Period 2025 - 2035
    Historical Data 2019 & 2020
    Forecast Units Value (USD Billion)
    Report Coverage Revenue Forecast, Competitive Landscape, Growth Factors, and Trends
    Segments Covered By Type, Application and Region
    Geographies Covered North America, Europe, Asia-Pacific, and Rest of the World (RoW)
    Countries Covered The U.S, Canada, Germany, France, UK, Italy, Spain, China, Japan, India, Australia, South Korea, and Brazil
    Key Companies Profiled BASF SE,The Dow Chemical Company,Arkema SA,Evonik Industries,Nippon Shokubai Co. Ltd,Taixing Jurong Chemical Co Ltd,PJSC Sibur Holding, LG Chemicals,Shenyang Chemical Co Ltd,Mitsubishi Chemical, and Hexion Inc
    Key Market Opportunities Increase in the Use of Bio-Based Acrylic Acid
    Key Market Dynamics Increasing Use of Superabsorbent Polymers in Various Applications
    Market Size 2025 12.22

    Market Highlights

    Author

    Priya Nagrale
    Senior Research Analyst

    She holds an experience of about 6+ years in market research and business consulting, working under the spectrum of information communication technology, telecommunications and semiconductor domains. aarti conceptualizes and implements a scalable business strategy and provides strategic leadership to the clients. her expertise lies in market estimation, competitive intelligence, pipeline analysis, customer assessment, etc.

    Leave a Comment

    Latest Comments

    John Doe
    john@example.com

    This is a great article! Really helped me understand the topic better.

    Posted on July 23, 2025, 10:15 AM
    Jane Smith
    jane@domain.com

    Thanks for sharing this. I’ve bookmarked it for later reference.

    Posted on July 22, 2025, 7:45 PM

    FAQs

    How big is the acrylic acid market?

    The valuation of the global acrylic acid market is projected to reach approximately USD 15.96 BN by 2032, growing at 3.89% CAGR during 2024-2032

    What are the major driving forces behind the growth of the global acrylic acid market?

    Growth in the packaging and construction industry.

    Which segment is expected to be the largest segment in the global acrylic acid market?

    The superabsorbent polymer segment by type is the largest segment estimated to lead in the global acrylic acid market.

    Which region holds the largest share in the global acrylic acid market?

    Asia Pacific holds the largest share in the global acrylic acid market followed by Europe and North America, respectively.

    Who are the top players in the global acrylic acid market?

    The Dow Chemical Company, BASF SE, Arkema SA, Nippon Shokubai Co. Ltd, Evonik Industries, Taixing Jurong Chemical Co Ltd, Shenyang Chemical Co Ltd, PJSC Sibur Holding, LG Chemicals, Hexion Inc., and Mitsubishi Chemical, are some of the major players operating in the global acrylic acid market.

    1. Report Prologue
    2. Market Introduction
      1. Market Definition 15
      2. Scope of the Study 15
        1. Research Objectives 15
      3. List Of Assumptions 15
      4. Market Structure 15
      5. Key Takeaways 15
    3. Market Insights
    4. Research Methodology
      1. Research Process 18
      2. Primary Research 18
      3. Secondary Research 18
      4. Market Size Estimation 19
      5. Forecast Model 19
    5. Market Dynamics
      1. Introduction 21
      2. Drivers 21
        1. Increasing Use Of Superabsorbent Polymers In Various Applications 21
        2. Growth Of The Construction Industry 21
        3. Rising Demand For Water-Based Adhesives 21
      3. Restraints 22
        1. Rising Environment Concerns And Health Hazards 22
        2. Rise In Price Of Raw Materials 22
      4. Opportunities 23
        1. Increase In The Use Of Bio-Based Acrylic Acid 23
        2. Increasing Demand From Emerging Economies 23
    6. Market Factor Analysis
      1. Market Factor Analysis 25
        1. Raw Material Suppliers 25
        2. Acrylic Acid Producers 25
        3. Distribution Channel 26
        4. End-Users 26
      2. Porter’s Five Forces Model 27
        1. Threat Of New Entrants 27
        2. Threat Of Rivalry 27
        3. Threat Of Substitutes 27
        4. Bargaining Power Of Suppliers 28
        5. Bargaining Power Of Buyers 28
    7. Global Acrylic Acid Market, By Type
      1. Introduction 29
      2. Methyl Acrylate 30
      3. Ethyl Acrylate 34
      4. Butyl Acrylate 39
      5. 2-Ethylhexyl Acrylate 49
      6. Elastomers 54
      7. Superabsorbent 56
      8. Water Treatment Polymers 58
      9. Others 58
    8. Global Acrylic Acid Market, By Application
      1. Introduction 64
      2. Adhesives & Sealants 66
      3. Diaper 71
      4. Surface Coating 76
      5. Paper Industry 81
      6. Cement Modifiers 86
      7. Textile 88
      8. Anti-Scalant 90
      9. Adult Incontinence Products 92
      10. Others 94
    9. Global Acrylic Acid Market, By Region
      1. Introduction 97
      2. North America 101
        1. US… 1059.2.2 Canada 107
      3. Europe 109
        1. Germany 113
        2. UK 116
        3. France 118
        4. Spain 121
        5. Rest Of Europe 124
      4. Asia-Pacific 127
        1. China 131
        2. Japan 134
        3. India 137
        4. Rest Of Asia-Pacific 140
      5. Middle East & Africa 141
        1. Turkey 144
        2. Israel 145
        3. North Africa 146
        4. GCC 147
        5. Rest Of The Middle East & Africa 148
      6. Latin America 151
        1. Brazil 152
        2. Argentina 153
        3. Mexico 155
        4. Rest Of Latin America 157
    10. Competitive Landscape
      1. Introduction 160
      2. Market Strategy Analysis 160
      3. Key Developments Of Major Market Players 160
    11. Company Profile
      1. BASF SE 164
        1. Company Overview 164
        2. Product/Business Segment Overview 164
        3. Financial Overview 165
        4. Key Developments 165
      2. The Dow Chemical Company 166
        1. Company Overview 166
        2. Product/Business Segment Overview 166
        3. Financial Overview 167
        4. Key Developments 167
      3. Arkema 168
        1. Company Overview 168
        2. Product/Business Segment Overview 168
        3. Financial Overview 169
        4. Key Developments 169
      4. Nippon Shokubai Co. Ltd 170
        1. Company Overview 170
        2. Product/Business Segment Overview 170
        3. Financial Overview 171
        4. Key Developments 171
      5. LG Chemicals 172
        1. Company Overview 172
        2. Product/Business Segment Overview 172
        3. Financial Overview 173
        4. Key Developments 173
      6. Shenyang Tianlongyang Chemical Co. Ltd 174
        1. Company Overview 174
        2. Product/Business Segment Overview 174
        3. Financial Overview 175
      7. 4 Key Developments 175
      8. Mitsubishi Chemical 176
        1. Company Overview 176
        2. Product/Business Segment Overview 176
        3. Financial Overview 177
        4. Key Developments 177
      9. Evonik Industries 178
        1. Company Overview 178
        2. Product/Business Segment Overview 178
        3. Financial Overview 179
        4. Key Developments 179
      10. Taixing Jurong Chemical Co. Ltd 180
        1. Company Overview 180
        2. Product/Business Segment Overview 180
        3. Financial Overview 181
        4. Key Developments 181
      11. PJSC Sibur Holding 182
        1. Company Overview 182
        2. Product/Business Segment Overview 182
        3. Financial Overview 183
        4. Key Developments 183
      12. Hexion Inc. 184
        1. Company Overview 184
        2. Product/Business Segment Overview 184
        3. Financial Overview 185
        4. Key Developments 185
    12. Conclusion
    13. List of Tables and Figures
      1. 13 List Of Tables
      2. TABLE 1 GLOBAL ACRYLIC ACID MARKET, BY TYPE, 2020-2027 (USD MILLION) 28
      3. TABLE 2 GLOBAL ACRYLIC ACID MARKET, BY TYPE, 2020-2027 (METRIC TONS) 29
      4. TABLE 3 GLOBAL ACRYLIC ACID MARKET FOR METHYL ACRYLATE, BY REGION, 2020-2027 (USD MILLION) 30
      5. TABLE 4 GLOBAL ACRYLIC ACID MARKET FOR METHYL ACRYLATE, BY REGION, 2020-2027 (METRIC TONS) 31
      6. TABLE 5 NORTH AMERICA: ACRYLIC ACID MARKET FOR METHYL ACRYLATE, BY REGION, 2020-2027 (USD MILLION) 31
      7. TABLE 6 NORTH AMERICA: ACRYLIC ACID MARKET FOR METHYL ACRYLATE, BY REGION, 2020-2027 (METRIC TONS) 32
      8. TABLE 7 EUROPE: ACRYLIC ACID MARKET FOR METHYL ACRYLATE, BY REGION, 2020-2027 (USD MILLION) 32
      9. TABLE 8 EUROPE: ACRYLIC ACID MARKET FOR METHYL ACRYLATE, BY REGION, 2020-2027 (METRIC TONS) 33
      10. TABLE 9 ASIA-PACIFIC: ACRYLIC ACID MARKET FOR METHYL ACRYLATE, BY REGION, 2020-2027 (USD MILLION) 33
      11. TABLE 10 ASIA-PACIFIC: ACRYLIC ACID MARKET FOR METHYL ACRYLATE, BY REGION, 2020-2027 (METRIC TONS) 34
      12. TABLE 11 GLOBAL ACRYLIC ACID MARKET FOR ETHYL ACRYLATE, BY REGION, 2020-2027 (USD MILLION) 35
      13. TABLE 12 GLOBAL ACRYLIC ACID MARKET FOR ETHYL ACRYLATE, BY REGION, 2020-2027 (METRIC TONS) 36
      14. TABLE 13 NORTH AMERICA: ACRYLIC ACID MARKET FOR ETHYL ACRYLATE, BY REGION, 2020-2027 (USD MILLION) 36
      15. TABLE 14 NORTH AMERICA: ACRYLIC ACID MARKET FOR ETHYL ACRYLATE, BY REGION, 2020-2027 (METRIC TONS) 37
      16. TABLE 15 EUROPE: ACRYLIC ACID MARKET FOR ETHYL ACRYLATE, BY REGION, 2020-2027 (USD MILLION) 37
      17. TABLE 16 EUROPE: ACRYLIC ACID MARKET FOR ETHYL ACRYLATE , BY REGION, 2020-2027 (METRIC TONS) 38
      18. TABLE 17 ASIA PACIFIC: ACRYLIC ACID MARKET FOR ETHYL ACRYLATE, BY REGION, 2020-2027 (USD MILLION) 38
      19. TABLE 18 ASIA PACIFIC: ACRYLIC ACID MARKET FOR ETHYL ACRYLATE, BY REGION, 2020-2027 (METRIC TONS) 39
      20. TABLE 19 GLOBAL ACRYLIC ACID MARKET FOR BUTYL ACRYLATE, BY REGION, 2020-2027 (USD MILLION) 40
      21. TABLE 20 GLOBAL ACRYLIC ACID MARKET FOR BUTYL ACRYLATE, BY REGION, 2020-2027 (METRIC TONS) 41
      22. TABLE 21 NORTH AMERICA: ACRYLIC ACID MARKET FOR BUTYL ACRYLATE, BY REGION, 2020-2027 (USD MILLION) 41
      23. TABLE 22 NORTH AMERICA: ACRYLIC ACID MARKET FOR BUTYL ACRYLATE, BY REGION, 2020-2027 (METRIC TONS) 42
      24. TABLE 23 EUROPE: ACRYLIC ACID MARKET FOR BUTYL ACRYLATE, BY REGION, 2020-2027 (USD MILLION) 42
      25. TABLE 24 EUROPE: ACRYLIC ACID MARKET FOR BUTYL ACRYLATE, BY REGION, 2020-2027 (METRIC TONS) 43
      26. TABLE 25 ASIA PACIFIC: ACRYLIC ACID MARKET FOR BUTYL ACRYLATE, BY REGION, 2020-2027 (USD MILLION) 43
      27. TABLE 26 ASIA PACIFIC: ACRYLIC ACID MARKET FOR BUTYL ACRYLATE, BY REGION, 2020-2027 (METRIC TONS) 44
      28. TABLE 27 GLOBAL ACRYLIC ACID MARKET FOR 2-ETHYLHEXYL ACRYLATE, BY TYPE, 2020-2027 (USD MILLION) 45
      29. TABLE 28 GLOBAL ACRYLIC ACID MARKET FOR 2-ETHYLHEXYL ACRYLATE, BY TYPE, 2020-2027 (METRIC TONS) 46
      30. TABLE 29 NORTH AMERICA: ACRYLIC ACID MARKET FOR 2-ETHYLHEXYL ACRYLATE, BY REGION, 2020-2027 (USD MILLION) 46
      31. TABLE 30 NORTH AMERICA: ACRYLIC ACID MARKET FOR 2-ETHYLHEXYL ACRYLATE, BY REGION, 2020-2027 (METRIC TONS) 47
      32. TABLE 31 EUROPE: ACRYLIC ACID MARKET FOR 2-ETHYLHEXYL ACRYLATE, BY REGION, 2020-2027 (USD MILLION) 47
      33. TABLE 32 EUROPE: ACRYLIC ACID MARKET FOR 2-ETHYLHEXYL ACRYLATE, BY REGION, 2020-2027 (METRIC TONS) 48
      34. TABLE 33 ASIA PACIFIC: ACRYLIC ACID MARKET FOR 2-ETHYLHEXYL ACRYLATE, BY REGION, 2020-2027 (USD MILLION) 48
      35. TABLE 34 ASIA PACIFIC: ACRYLIC ACID MARKET FOR 2-ETHYLHEXYL ACRYLATE, BY REGION, 2020-2027 (METRIC TONS) 49
      36. TABLE 35 GLOBAL ACRYLIC ACID MARKET FOR ELASTOMERS, BY TYPE, 2020-2027 (USD MILLION) 50
      37. TABLE 36 GLOBAL ACRYLIC ACID MARKET FOR ELASTOMERS, BY TYPE, 2020-2027 (METRIC TONS) 51
      38. TABLE 37 NORTH AMERICA: ACRYLIC ACID MARKET FOR ELASTOMERS, BY REGION, 2020-2027 (USD MILLION) 51
      39. TABLE 38 NORTH AMERICA: ACRYLIC ACID MARKET FOR ELASTOMERS, BY REGION, 2020-2027 (METRIC TONS) 52
      40. TABLE 39 EUROPE: ACRYLIC ACID MARKET FOR ELASTOMERS, BY REGION, 2020-2027 (USD MILLION) 52
      41. TABLE 40 EUROPE: ACRYLIC ACID MARKET FOR ELASTOMERS, BY REGION, 2020-2027 (METRIC TONS) 53
      42. TABLE 41 ASIA PACIFIC: ACRYLIC ACID MARKET FOR ELASTOMERS, BY REGION, 2020-2027 (USD MILLION) 53
      43. TABLE 42 ASIA PACIFIC: ACRYLIC ACID MARKET FOR ELASTOMERS, BY REGION, 2020-2027 (METRIC TONS) 54
      44. TABLE 43 GLOBAL ACRYLIC ACID MARKET FOR SUPERABSORBENT, BY TYPE, 2020-2027 (USD MILLION) 55
      45. TABLE 44 GLOBAL ACRYLIC ACID MARKET FOR SUPERABSORBENT, BY TYPE, 2020-2027 (METRIC TONS) 56
      46. TABLE 45 NORTH AMERICA: ACRYLIC ACID MARKET FOR SUPERABSORBENT, BY REGION, 2020-2027 (USD MILLION) 56
      47. TABLE 46 NORTH AMERICA: ACRYLIC ACID MARKET FOR SUPERABSORBENT, BY REGION, 2020-2027 (METRIC TONS) 57
      48. TABLE 47 EUROPE: ACRYLIC ACID MARKET FOR SUPERABSORBENT, BY REGION, 2020-2027 (USD MILLION) 57
      49. TABLE 48 EUROPE: ACRYLIC ACID MARKET FOR SUPERABSORBENT, BY REGION, 2020-2027 (METRIC TONS) 58
      50. TABLE 49 ASIA PACIFIC: ACRYLIC ACID MARKET FOR SUPERABSORBENT, BY REGION, 2020-2027 (USD MILLION) 58
      51. TABLE 50 ASIA PACIFIC: ACRYLIC ACID MARKET FOR SUPERABSORBENT, BY REGION, 2020-2027 (METRIC TONS) 59
      52. TABLE 51 GLOBAL ACRYLIC ACID MARKET FOR WATER TREATMENT, BY TYPE, 2020-2027 (USD MILLION) 60
      53. TABLE 52 GLOBAL ACRYLIC ACID MARKET FOR WATER TREATMENT, BY REGION, 2020 (%) 60
      54. TABLE 53 GLOBAL ACRYLIC ACID MARKET FOR WATER TREATMENT, BY TYPE, 2020-2027 (METRIC TONS) 61
      55. TABLE 54 NORTH AMERICA: ACRYLIC ACID MARKET FOR WATER TREATMENT, BY REGION, 2020-2027 (USD MILLION) 61
      56. TABLE 55 NORTH AMERICA: ACRYLIC ACID MARKET FOR WATER TREATMENT, BY REGION, 2020-2027 (METRIC TONS) 61
      57. TABLE 56 EUROPE: ACRYLIC ACID MARKET FOR WATER TREATMENT, BY REGION, 2020-2027 (USD MILLION) 62
      58. TABLE 57 EUROPE: ACRYLIC ACID MARKET FOR WATER TREATMENT, BY REGION, 2020-2027 (METRIC TONS) 62
      59. TABLE 58 ASIA PACIFIC: ACRYLIC ACID MARKET FOR WATER TREATMENT, BY REGION, 2020-2027 (USD MILLION) 63
      60. TABLE 59 ASIA PACIFIC: ACRYLIC ACID MARKET FOR WATER TREATMENT, BY REGION, 2020-2027 (METRIC TONS) 63
      61. TABLE 60 GLOBAL ACRYLIC ACID MARKET, BY APPLICATION, 2020-2027 (USD MILLION) 65
      62. TABLE 61 GLOBAL ACRYLIC ACID MARKET, BY APPLICATION, 2020-2027 (METRIC TONS) 66
      63. TABLE 62 GLOBAL ADHESIVES SHARE FOR ACRYLIC ACID MARKET, BY REGION, 2020-2027 (METRIC TONS) 68
      64. TABLE 63 NORTH AMERICA: ADHESIVES SHARE FOR ACRYLIC ACID MARKET, BY REGION, 2020-2027 (USD MILLION) 68
      65. TABLE 64 NORTH AMERICA: ADHESIVES SHARE FOR ACRYLIC ACID MARKET, BY REGION, 2020-2027 (METRIC TONS) 69
      66. TABLE 65 EUROPE: ADHESIVES SHARE FOR ACRYLIC ACID MARKET, BY REGION, 2020-2027 (USD MILLION) 69
      67. TABLE 66 EUROPE: ADHESIVES SHARE FOR ACRYLIC ACID MARKET, BY REGION, 2020-2027 (METRIC TONS) 70
      68. TABLE 67 ASIA PACIFIC: ADHESIVES SHARE FOR ACRYLIC ACID MARKET, BY REGION, 2020-2027 (USD MILLION) 70
      69. TABLE 68 ASIA PACIFIC: ADHESIVES SHARE FOR ACRYLIC ACID MARKET, BY REGION, 2020-2027 (METRIC TONS) 71
      70. TABLE 69 GLOBAL DIAPER SHARE FOR ACRYLIC ACID MARKET, BY REGION, 2020-2027 (USD MILLION) 72
      71. TABLE 70 GLOBAL DIAPER SHARE FOR ACRYLIC ACID MARKET, BY REGION, 2020-2027 (METRIC TONS) 73
      72. TABLE 71 NORTH AMERICA: DIAPER SHARE FOR ACRYLIC ACID MARKET, BY REGION, 2020-2027 (USD MILLION) 73
      73. TABLE 72 NORTH AMERICA: DIAPER SHARE FOR ACRYLIC ACID MARKET, BY REGION, 2020-2027 (METRIC TONS) 74
      74. TABLE 73 EUROPE: DIAPER SHARE FOR ACRYLIC ACID MARKET, BY REGION, 2020-2027 (USD MILLION) 74
      75. TABLE 74 EUROPE: DIAPER SHARE FOR ACRYLIC ACID MARKET, BY REGION, 2020-2027 (METRIC TONS) 75
      76. TABLE 75 ASIA PACIFIC: DIAPER SHARE FOR ACRYLIC ACID MARKET, BY REGION, 2020-2027 (USD MILLION) 75
      77. TABLE 76 ASIA PACIFIC: DIAPER SHARE FOR ACRYLIC ACID MARKET, BY REGION, 2020-2027 (METRIC TONS) 76
      78. TABLE 77 GLOBAL SURFACE COATING SHARE FOR ACRYLIC ACID MARKET, BY REGION, 2020-2027 (USD MILLION) 77
      79. TABLE 78 GLOBAL SURFACE COATING SHARE FOR ACRYLIC ACID MARKET, BY REGION, 2020-2027 (METRIC TONS) 78
      80. TABLE 79 NORTH AMERICA: SURFACE COATING SHARE FOR ACRYLIC ACID MARKET, BY REGION, 2020-2027 (USD MILLION) 78
      81. TABLE 80 NORTH AMERICA: SURFACE COATING SHARE FOR ACRYLIC ACID MARKET, BY REGION, 2020-2027 (METRIC TONS) 79
      82. TABLE 81 EUROPE: SURFACE COATING SHARE FOR ACRYLIC ACID MARKET, BY REGION, 2020-2027 (USD MILLION) 79
      83. TABLE 82 EUROPE: SURFACE COATING SHARE FOR ACRYLIC ACID MARKET, BY REGION, 2020-2027 (METRIC TONS) 80
      84. TABLE 83 ASIA PACIFIC: SURFACE COATING SHARE FOR ACRYLIC ACID MARKET, BY REGION, 2020-2027 (USD MILLION) 80
      85. TABLE 84 ASIA PACIFIC: SURFACE COATING SHARE FOR ACRYLIC ACID MARKET, BY REGION, 2020-2027 (METRIC TONS) 81
      86. TABLE 85 GLOBAL PAPER INDUSTRY MARKET FOR ACRYLIC ACID MARKET, BY REGION, 2020-2027 (USD MILLION) 82
      87. TABLE 86 GLOBAL PAPER INDUSTRY SHARE FOR ACRYLIC ACID MARKET, BY REGION, 2020-2027 (METRIC TONS) 83
      88. TABLE 87 NORTH AMERICA: PAPER INDUSTRY SHARE FOR ACRYLIC ACID MARKET, BY REGION, 2020-2027 (USD MILLION) 83
      89. TABLE 88 NORTH AMERICA: PAPER INDUSTRY SHARE FOR ACRYLIC ACID MARKET, BY REGION, 2020-2027 (METRIC TONS) 84
      90. TABLE 89 EUROPE: PAPER INDUSTRY SHARE FOR ACRYLIC ACID MARKET, BY REGION, 2020-2027 (USD MILLION) 84
      91. TABLE 90 EUROPE: PAPER INDUSTRY SHARE FOR ACRYLIC ACID MARKET, BY REGION, 2020-2027 (METRIC TONS) 85
      92. TABLE 91 ASIA PACIFIC: PAPER INDUSTRY SHARE FOR ACRYLIC ACID MARKET, BY REGION, 2020-2027 (USD MILLION) 85
      93. TABLE 92 ASIA PACIFIC: PAPER INDUSTRY SHARE FOR ACRYLIC ACID MARKET, BY REGION, 2020-2027 (METRIC TONS) 86
      94. TABLE 93 GLOBAL CEMENT MODIFIERS SHARE FOR ACRYLIC ACID MARKET, BY REGION, 2020-2027 (USD MILLION) 87
      95. TABLE 94 GLOBAL CEMENT MODIFIERS SHARE FOR ACRYLIC ACID MARKET, BY REGION, 2020-2027 (METRIC TONS) 88
      96. TABLE 95 NORTH AMERICA: CEMENT MODIFIERS SHARE FOR ACRYLIC ACID MARKET, BY REGION, 2020-2027 (USD MILLION) 88
      97. TABLE 96 NORTH AMERICA: CEMENT MODIFIERS SHARE FOR ACRYLIC ACID MARKET, BY REGION, 2020-2027 (METRIC TONS) 89
      98. TABLE 97 EUROPE: CEMENT MODIFIERS SHARE FOR ACRYLIC ACID MARKET, BY REGION, 2020-2027 (USD MILLION) 89
      99. TABLE 98 EUROPE: CEMENT MODIFIERS SHARE FOR ACRYLIC ACID MARKET, BY REGION, 2020-2027 (METRIC TONS) 90
      100. TABLE 99 ASIA PACIFIC: CEMENT MODIFIERS SHARE FOR ACRYLIC ACID MARKET, BY REGION, 2020-2027 (USD MILLION) 90
      101. TABLE 100 ASIA PACIFIC: CEMENT MODIFIERS SHARE FOR ACRYLIC ACID MARKET, BY REGION, 2020-2027 (METRIC TONS) 91
      102. TABLE 101 GLOBAL OTHERS SHARE FOR ACRYLIC ACID MARKET, BY REGION, 2020-2027 (USD MILLION) 92
      103. TABLE 102 GLOBAL OTHERS SHARE FOR ACRYLIC ACID MARKET, BY REGION, 2020-2027 (METRIC TONS) 93
      104. TABLE 103 NORTH AMERICA: OTHERS SHARE FOR ACRYLIC ACID MARKET, BY REGION, 2020-2027 (USD MILLION) 93
      105. TABLE 104 NORTH AMERICA: OTHERS SHARE FOR ACRYLIC ACID MARKET, BY REGION, 2020-2027 (METRIC TONS) 94
      106. TABLE 105 EUROPE: OTHERS SHARE FOR ACRYLIC ACID MARKET, BY REGION, 2020-2027 (USD MILLION) 94
      107. TABLE 106 EUROPE: OTHERS SHARE FOR ACRYLIC ACID MARKET, BY REGION, 2020-2027 (METRIC TONS) 95
      108. TABLE 107 ASIA PACIFIC: OTHERS SHARE FOR ACRYLIC ACID MARKET, BY REGION, 2020-2027 (USD MILLION) 95
      109. TABLE 108 ASIA PACIFIC: OTHERS SHARE FOR ACRYLIC ACID MARKET, BY REGION, 2020-2027 (METRIC TONS) 96
      110. TABLE 109 GLOBAL ACRYLIC ACID MARKET, BY REGION, 2020-2027 (USD MILLION) 97
      111. TABLE 110 GLOBAL ACRYLIC ACID MARKET, BY REGION, 2020-2027 (METRIC TONS) 98
      112. TABLE 111 GLOBAL ACRYLIC ACID MARKET, BY TYPE, 2020-2027 (USD MILLION) 99
      113. TABLE 112 GLOBAL ACRYLIC ACID MARKET, BY TYPE, 2020-2027 (METRIC TONS) 99
      114. TABLE 113 GLOBAL ACRYLIC ACID MARKET, BY APPLICATION, 2020-2027 (USD MILLION) 100
      115. TABLE 114 GLOBAL ACRYLIC ACID MARKET, BY APPLICATION, 2020-2027 (METRIC TONS) 100
      116. TABLE 115 NORTH AMERICA: ACRYLIC ACID MARKET, BY COUNTRY, 2020-2027 (USD MILLION) 101
      117. TABLE 116 NORTH AMERICA: ACRYLIC ACID MARKET, BY COUNTRY, 2020-2027 (METRIC TONS) 101
      118. TABLE 117 NORTH AMERICA: ACRYLIC ACID MARKET, BY TYPE, 2020-2027 (USD MILLION) 102
      119. TABLE 118 NORTH AMERICA: ACRYLIC ACID MARKET, BY TYPE, 2020-2027 (METRIC TONS) 102
      120. TABLE 119 NORTH AMERICA: ACRYLIC ACID MARKET, BY APPLICATION, 2020-2027 (USD MILLION) 103
      121. TABLE 120 NORTH AMERICA: ACRYLIC ACID MARKET, BY APPLICATION, 2020-2027 (METRIC TONS) 103
      122. TABLE 121 US: ACRYLIC ACID MARKET, BY TYPE, 2020-2027 (USD MILLION) 104
      123. TABLE 122 US: ACRYLIC ACID MARKET, BY TYPE, 2020-2027 (METRIC TONS) 105
      124. TABLE 123 US: ACRYLIC ACID MARKET, BY APPLICATION, 2020-2027 (USD MILLION) 105
      125. TABLE 124 US: ACRYLIC ACID MARKET, BY APPLICATION, 2020-2027 (METRIC TONS) 106
      126. TABLE 125 CANADA: ACRYLIC ACID MARKET, BY TYPE, 2020-2027 (USD MILLION) 107
      127. TABLE 126 CANADA: ACRYLIC ACID MARKET, BY TYPE, 2020-2027 (METRIC TONS) 108
      128. TABLE 127 CANADA: ACRYLIC ACID MARKET, BY APPLICATION, 2020-2027 (USD MILLION) 108
      129. TABLE 128 CANADA: ACRYLIC ACID MARKET, BY APPLICATION, 2020-2027 (METRIC TONS) 109
      130. TABLE 129 EUROPE: ACRYLIC ACID MARKET, BY COUNTRY, 2020-2027 (USD MILLION) 109
      131. TABLE 130 EUROPE: ACRYLIC ACID MARKET, BY COUNTRY, 2020-2027 (METRIC TONS) 110
      132. TABLE 131 EUROPE: ACRYLIC ACID MARKET, BY TYPE, 2020-2027 (USD MILLION) 111
      133. TABLE 132 EUROPE: ACRYLIC ACID MARKET, BY TYPE, 2020-2027 (METRIC TONS) 111
      134. TABLE 133 EUROPE: ACRYLIC ACID MARKET, BY APPLICATION, 2020-2027 (USD MILLION) 112
      135. TABLE 134 EUROPE: ACRYLIC ACID MARKET, BY APPLICATION, 2020-2027 (METRIC TONS) 113
      136. TABLE 135 GERMANY: ACRYLIC ACID MARKET, BY TYPE, 2020-2027 (USD MILLION) 113
      137. TABLE 136 GERMANY: ACRYLIC ACID MARKET, BY TYPE, 2020-2027 (METRIC TONS) 114
      138. TABLE 137 GERMANY: ACRYLIC ACID MARKET, BY APPLICATION, 2020-2027 (USD MILLION) 115
      139. TABLE 138 GERMANY: ACRYLIC ACID MARKET, BY APPLICATION, 2020-2027 (METRIC TONS) 115
      140. TABLE 139 UK: ACRYLIC ACID MARKET, BY TYPE, 2020-2027 (USD MILLION) 116
      141. TABLE 140 UK: ACRYLIC ACID MARKET, BY TYPE, 2020-2027 (METRIC TONS) 117
      142. TABLE 141 UK: ACRYLIC ACID MARKET, BY APPLICATION, 2020-2027 (USD MILLION) 117
      143. TABLE 142 UK: ACRYLIC ACID MARKET, BY APPLICATION, 2020-2027 (METRIC TONS) 118
      144. TABLE 143 FRANCE: ACRYLIC ACID MARKET, BY TYPE, 2020-2027 (USD MILLION) 118
      145. TABLE 144 FRANCE: ACRYLIC ACID MARKET, BY TYPE, 2020-2027 (METRIC TONS) 119
      146. TABLE 145 FRANCE: ACRYLIC ACID MARKET, BY APPLICATION, 2020-2027 (USD MILLION) 119
      147. TABLE 146 FRANCE: ACRYLIC ACID MARKET, BY APPLICATION, 2020-2027 (METRIC TONS) 120
      148. TABLE 147 SPAIN: ACRYLIC ACID MARKET, BY TYPE, 2020-2027 (USD MILLION) 121
      149. TABLE 148 SPAIN: ACRYLIC ACID MARKET, BY TYPE, 2020-2027 (METRIC TONS) 122
      150. TABLE 149 SPAIN: ACRYLIC ACID MARKET, BY APPLICATION, 2020-2027 (USD MILLION) 122
      151. TABLE 150 SPAIN: ACRYLIC ACID MARKET, BY APPLICATION, 2020-2027 (METRIC TONS) 123
      152. TABLE 151 REST OF EUROPE: ACRYLIC ACID MARKET, BY TYPE, 2020-2027 (USD MILLION) 124
      153. TABLE 152 REST OF EUROPE: ACRYLIC ACID MARKET, BY TYPE, 2020-2027 (METRIC TONS) 125
      154. TABLE 153 REST OF EUROPE: ACRYLIC ACID MARKET, BY APPLICATION, 2020-2027 (USD MILLION) 125
      155. TABLE 154 REST OF EUROPE: ACRYLIC ACID MARKET, BY APPLICATION, 2020-2027 (METRIC TONS) 126
      156. TABLE 155 ASIA PACIFIC: ACRYLIC ACID MARKET, BY COUNTRY, 2020-2027 (USD MILLION) 127
      157. TABLE 156 ASIA PACIFIC: ACRYLIC ACID MARKET, BY COUNTRY, 2020-2027 (METRIC TONS) 127
      158. TABLE 157 ASIA PACIFIC: ACRYLIC ACID MARKET, BY TYPE, 2020-2027 (USD MILLION) 128
      159. TABLE 158 ASIA PACIFIC: ACRYLIC ACID MARKET, BY TYPE, 2020-2027 (METRIC TONS) 129
      160. TABLE 159 ASIA PACIFIC: ACRYLIC ACID MARKET, BY APPLICATION, 2020-2027 (USD MILLION) 129
      161. TABLE 160 ASIA PACIFIC: ACRYLIC ACID MARKET, BY APPLICATION, 2020-2027 (METRIC TONS) 130
      162. TABLE 161 CHINA: ACRYLIC ACID MARKET, BY TYPE, 2020-2027 (USD MILLION) 131
      163. TABLE 162 CHINA: ACRYLIC ACID MARKET, BY TYPE, 2020-2027 (METRIC TONS) 132
      164. TABLE 163 CHINA: ACRYLIC ACID MARKET, BY APPLICATION, 2020-2027 (USD MILLION) 132
      165. TABLE 164 CHINA: ACRYLIC ACID MARKET, BY APPLICATION, 2020-2027 (METRIC TONS) 133
      166. TABLE 165 JAPAN: ACRYLIC ACID MARKET, BY TYPE, 2020-2027 (USD MILLION) 134
      167. TABLE 166 JAPAN: ACRYLIC ACID MARKET, BY TYPE, 2020-2027 (METRIC TONS) 135
      168. TABLE 167 JAPAN: ACRYLIC ACID MARKET, BY APPLICATION, 2020-2027 (USD MILLION) 135
      169. TABLE 168 JAPAN: ACRYLIC ACID MARKET, BY APPLICATION, 2020-2027 (METRIC TONS) 136
      170. TABLE 169 INDIA: ACRYLIC ACID MARKET, BY TYPE, 2020-2027 (USD MILLION) 137
      171. TABLE 170 INDIA: ACRYLIC ACID MARKET, BY TYPE, 2020-2027 (METRIC TONS) 138
      172. TABLE 171 INDIA: ACRYLIC ACID MARKET, BY APPLICATION, 2020-2027 (USD MILLION) 138
      173. TABLE 172 INDIA: ACRYLIC ACID MARKET, BY APPLICATION, 2020-2027 (METRIC TONS) 139
      174. TABLE 173 REST OF ASIA-PACIFIC: ACRYLIC ACID MARKET, BY TYPE, 2020-2027 (USD MILLION) 140
      175. TABLE 174 REST OF ASIA-PACIFIC: ACRYLIC ACID MARKET, BY TYPE, 2020-2027 (METRIC TONS) 141
      176. TABLE 175 REST OF ASIA-PACIFIC: ACRYLIC ACID MARKET, BY APPLICATION, 2020-2027 (USD MILLION) 141
      177. TABLE 176 REST OF ASIA-PACIFIC: ACRYLIC ACID MARKET, BY APPLICATION, 2020-2027 (METRIC TONS) 142
      178. TABLE 177 KEY DEVELOPMENTS 143   14 List Of Tables
      179. FIGURE 1 RESEARCH PROCESS OF MRFR 17
      180. FIGURE 2 FORECAST MODEL 19
      181. FIGURE 3 GLOBAL ACRYLIC ACID MARKET SHARE, BY TYPE, 2020 (%) (VALUE) 27
      182. FIGURE 4 GLOBAL ACRYLIC ACID MARKET SHARE, BY TYPE, 2020 (%) (VOLUME) 28
      183. FIGURE 5 GLOBAL METHYL ACRYLATE MARKET SHARE FOR ACRYLIC ACID, BY REGION, 2020 (%) (VALUE) 29
      184. FIGURE 6 GLOBAL METHYL ACRYLATE MARKET SHARE FOR ACRYLIC ACID, BY REGION, 2020 (%) (VOLUME) 30
      185. FIGURE 7 GLOBAL ETHYL ACRYLATE MARKET SHARE FOR ACRYLIC ACID, BY REGION, 2020 (%) (VALUE) 34
      186. FIGURE 8 GLOBAL ETHYL ACRYLATE MARKET SHARE FOR ACRYLIC ACID, BY REGION, 2020 (%) (VOLUME) 35
      187. FIGURE 9 GLOBAL BUTYL ACRYLATE MARKET SHARE FOR ACRYLIC ACID, BY REGION, 2020 (%) (VALUE) 39
      188. FIGURE 10 GLOBAL BUTYL ACRYLATE MARKET SHARE FOR ACRYLIC ACID, BY REGION, 2020 (%) (VOLUME) 40
      189. FIGURE 11 GLOBAL 2-ETHYLHEXYL ACRYLATE MARKET SHARE FOR ACRYLIC ACID, BY REGION, 2020 (%) (VALUE) 44
      190. FIGURE 12 GLOBAL 2-ETHYLHEXYL ACRYLATE MARKET SHARE FOR ACRYLIC ACID, BY REGION, 2020 (%) (VOLUME) 45
      191. FIGURE 13 GLOBAL ELASTOMERS MARKET SHARE FOR ACRYLIC ACID, BY REGION, 2020 (%) (VALUE) 49
      192. FIGURE 14 GLOBAL ELASTOMERS MARKET SHARE FOR ACRYLIC ACID, BY REGION, 2020 (%) (VOLUME) 50
      193. FIGURE 15 GLOBAL SUPERABSORBENT MARKET SHARE FOR ACRYLIC ACID, BY REGION, 2020 (%) (VALUE) 54
      194. FIGURE 16 GLOBAL SUPERABSORBENT MARKET SHARE FOR ACRYLIC ACID, BY REGION, 2020 (%) (VOLUME) 55
      195. FIGURE 17 GLOBAL WATER TREATMENT POLYMERS MARKET SHARE FOR ACRYLIC ACID, BY REGION, 2020 (%) (VALUE) 59
      196. FIGURE 18 GLOBAL WATER TREATMENT POLYMERS MARKET SHARE FOR ACRYLIC ACID, BY REGION, 2020 (%) (VOLUME) 60
      197. FIGURE 19 GLOBAL ACRYLIC ACID MARKET, BY APPLICATION, 2020 (%) (VALUE) 64
      198. FIGURE 20 GLOBAL ACRYLIC ACID MARKET, BY APPLICATION, 2020 (%) (VOLUME) 65
      199. FIGURE 21 GLOBAL ADHESIVES MARKET SHARE FOR ACRYLIC ACID, BY REGION, 2020 (%) (VALUE) 67
      200. FIGURE 22 GLOBAL ADHESIVES MARKET SHARE FOR ACRYLIC ACID, BY REGION, 2020 (%) (VOLUME) 68
      201. FIGURE 23 GLOBAL DIAPER MARKET SHARE FOR ACRYLIC ACID, BY REGION, 2020 (%) (VALUE) 71
      202. FIGURE 24 GLOBAL DIAPER MARKET SHARE FOR ACRYLIC ACID, BY REGION, 2020 (%) (VOLUME) 72
      203. FIGURE 25 GLOBAL SURFACE COATING MARKET SHARE FOR ACRYLIC ACID, BY REGION, 2020 (%) (VALUE) 76
      204. FIGURE 26 GLOBAL SURFACE COATING MARKET SHARE FOR ACRYLIC ACID, BY REGION, 2020 (%) (VOLUME) 77
      205. FIGURE 27 GLOBAL PAPER INDUSTRY MARKET SHARE FOR ACRYLIC ACID, BY REGION, 2020 (%) (VALUE) 81
      206. FIGURE 28 GLOBAL PAPER INDUSTRY MARKET SHARE FOR ACRYLIC ACID, BY REGION, 2020 (%) (VOLUME) 82
      207. FIGURE 29 GLOBAL CEMENT MODIFIERS MARKET SHARE FOR ACRYLIC ACID, BY REGION, 2020 (%) (VALUE) 86
      208. FIGURE 30 GLOBAL CEMENT MODIFIERS MARKET SHARE FOR ACRYLIC ACID, BY REGION, 2020 (%) (VOLUME) 87
      209. FIGURE 31 GLOBAL OTHERS MARKET SHARE FOR ACRYLIC ACID, BY REGION, 2020 (%) (VALUE) 91
      210. FIGURE 32 GLOBAL OTHERS MARKET SHARE FOR ACRYLIC ACID, BY REGION, 2020 (%) (VOLUME) 92
      211. FIGURE 33 GLOBAL ACRYLIC ACID MARKET, BY REGION, 2020 (%) (VALUE) 97
      212. FIGURE 34 GLOBAL ACRYLIC ACID MARKET, BY REGION, 2020 (%) (VOLUME) 98

    Acrylic Acid Market Segmentation

    Market Segmentation Overview

    • Detailed segmentation data will be available in the full report
    • Comprehensive analysis by multiple parameters
    • Regional and country-level breakdowns
    • Market size forecasts by segment
    Infographic

    Free Sample Request

    Kindly complete the form below to receive a free sample of this Report

    Get Free Sample

    Customer Strories

    “I am very pleased with how market segments have been defined in a relevant way for my purposes (such as "Portable Freezers & refrigerators" and "last-mile"). In general the report is well structured. Thanks very much for your efforts.”

    Victoria Milne

    Founder
    Case Study
    Chemicals and Materials