Agricultural Microbials Market

Agricultural Microbials Market Size, Share, Industry Trend & Analysis Research Report By Type (Bacteria, Fungi, Viruses, Others), By Function (Biopesticides, Biofertilizers, Biostimulants), By Application (Fruits & Vegetables, Grains & Cereals, Pulses & Oilseeds, Commercial Crops), By Mode of Application (Seed Treatment, Foliar Spray, Soil Treatment), By Formulation (Liquid, Dry) -Forecast to 2035
ID: MRFR/Agri/3967-HCR
200 Pages
Snehal Singh
Last Updated: June 03, 2026
 

Agricultural Microbials Market Summary

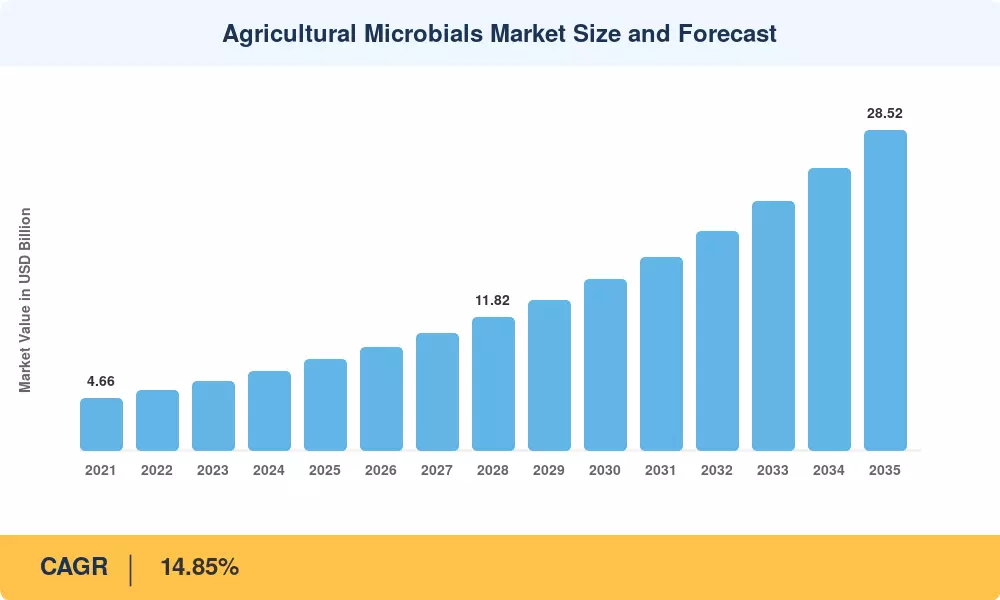
The Agricultural Microbials Market reached a valuation of USD 8.10 billion in 2025 and is projected to climb from USD 9.18 billion in 2026 to USD 28.52 billion by 2035, registering a CAGR of 14.85% across the forecast window. Two catalysts anchor this trajectory: input cost inflation for synthetic fertilizers — which spiked over 40% between 2022 and 2024 — and escalating global mandates for residue-free food production [2]. Carbon-credit programs paying USD 15–30 per metric ton of CO₂ equivalent for nitrogen reductions are turning microbial biostimulant technology adoption into a cash-positive decision for row-crop producers across the Americas [3].

The change is generational, as traditional chemical regimes of crop protection are replaced by microbial agents of biocontrol and products of beneficial soil microorganisms. AI-based strain discovery systems are cutting development times from five years to less than eighteen months, allowing vendors to rapidly refresh portfolios and stay ahead of increasing pest resistance [4]. The EU Farm to Fork objective to achieve 50% reduction of pesticides by 2030, supported by EUR 10 billion research investment under Horizon Europe, has triggered a regulatory green-lighting of plant growth boosting bacteria strains across the twenty-seven member states [5].

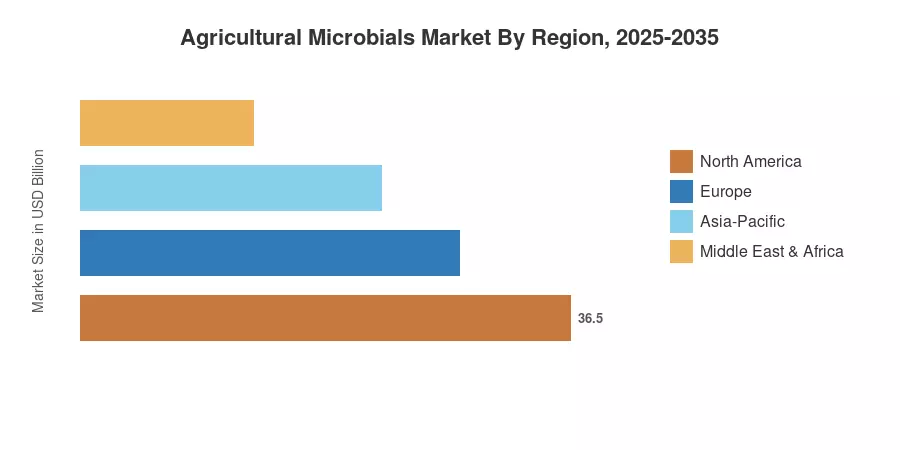
North America accounted for the largest portion of the Agricultural Microbials Market, with about 34% of 2025 revenue, due to large-acreage corn and soybean adoption. The Asia-Pacific region is the fastest-growing market with a CAGR of around 16.2%. This growth is driven by government subsidies and national targets for fertilizer reduction in India, China and Japan. Europe had the second-highest share with over 27% because of strict MRL laws and the rise of organic farming [6]. In the coming decade, mycorrhizal fungi soil health remedies and precision-applied bacterial inoculants will transform worldwide crop-input economics.


Key Report Takeaways

• By Type

  • Bacteria captured roughly 46% of the Agricultural Microbials Market revenue in 2025, reflecting widespread rhizobium and Bacillus-based inoculant deployment across cereal crops
  • Viruses are projected to expand at a CAGR of 19.5% through 2035, driven by rising baculovirus adoption in integrated pest management for high-value horticulture

• By Function

  • Biopesticides commanded approximately 51% of the Agricultural Microbials Market share in 2025, anchored by biocontrol microbial agents targeting Lepidoptera and nematode complexes
  • Biostimulants are forecast to grow at a 16.3% CAGR through 2035, as growers integrate microbial biostimulant technology into fertility programs to improve nutrient-use efficiency

• By Application

  • Fruits and vegetables represented roughly 30.5% of the Agricultural Microbials Market size in 2025, fueled by residue-free export requirements in Europe and Japan
  • Commercial crops are advancing at a 15.9% CAGR through 2035, as cotton and sugarcane producers adopt beneficial soil microorganism products to reduce input costs

• By Geography

  • North America generated approximately USD 2.75 billion in 2025 Agricultural Microbials Market revenue
  • Asia-Pacific is anticipated to register the fastest CAGR at 16.2%, supported by India's Paramparagat Krishi Vikas Yojana organic-farming subsidies and China's zero-growth fertilizer action plan


Market Size and Forecast (2021–2035)

MRFR’s sizing model triangulates bottom-up income from manufacturer shipments, distributor sell-through data and top-down cross-referencing with FAO crop-protection expenditure datasets. Historical figures (2021-2024) are audited, and the base year of 2025 is estimated. Values for 2026-2035 are based on a calibrated 14.85% CAGR with year-specific adjustments for regulatory milestones and commodity-price cycles.


Agricultural Microbials Market Size and Forecast
Our Impact
Enabled $4.3B Revenue Impact for Fortune 500 and Leading Multinationals
Partnering with 2000+ Global Organizations Each Year
30K+ Citations by Top-Tier Firms in the Industry
 

Driver Impact Analysis

Driver ~% Impact on CAGR Geographic Relevance Impact Timeline
Synthetic fertilizer cost inflation ~18% Global Short-term (≤2 yr)
Residue-free food demand & MRL tightening ~16% Europe, Japan Medium-term (2–4 yr)
Carbon-credit & ESG mandates ~14% North America, EU Medium-term (2–4 yr)
AI-enabled strain discovery & genomics ~13% Global Long-term (≥4 yr)
Government subsidies for biological inputs ~15% Asia-Pacific, South America Short-term (≤2 yr)
Precision application technology ~12% North America, Europe Medium-term (2–4 yr)
Smallholder digitization & mobile advisory ~12% Africa, South Asia Long-term (≥4 yr)


Synthetic Fertilizer Cost Inflation

Following unprecedented historic peaks, global wholesale urea prices experienced significant volatility, forcing corn-belt producers to actively trial plant growth-promoting bacteria inoculants as partial nitrogen replacements to hedge against future input shocks. USDA Economic Research Service data underscores that fertilizer represents the single largest operating expense for US corn production—frequently consuming over a third of total variable costs. This heavy cost burden gives biological alternatives a direct substitution pathway, particularly for mid-size operations working with thin margins, where every reduction in synthetic input costs directly improves per-acre economics.


Residue-Free Food Demand and MRL Tightening

The European Union continues to systematically lower maximum residue limits (MRLs) and phase out legacy active substances via continuous European Food Safety Authority (EFSA) reviews, effectively restricting multiple traditional chemical chemistries from high-value fresh-produce channels. Major European retailers—such as Aldi, Lidl, and Tesco—now enforce strict corporate protocols requiring pesticide residue levels to be significantly below the legally permitted EU ceilings.

Concurrently, international markets are shifting; Japan's Green Food System Strategy explicitly targets a 50% reduction in the risk-weighted use of chemical pesticides by 2050, creating a clear, multi-decade demand runway for microbial biostimulant technology in rice and horticultural systems. [12].

Carbon-Credit and ESG Mandates

Voluntary carbon markets and corporate sustainability programs are increasingly assigning economic value to microbial nitrogen-fixation practices, generating a steady stream of incremental incentive revenue per acre for growers who adopt approved bacterial inoculants. Furthermore, corporate scope-3 emissions reporting requirements under the EU’s Corporate Sustainability Reporting Directive (CSRD) are pushing global food manufacturers to incentivize upstream adoption of beneficial soil microorganism products.


AI-Enabled Strain Discovery

Machine-learning and high-throughput screening platforms have fundamentally accelerated agricultural biotech R&D, identifying high-performance plant growth-promoting bacteria strains in fractions of the time required by traditional discovery methods. Industry leaders like Pivot Bio, via its commercialized nitrogen-fixing platforms, and Ginkgo Bioworks, through its specialized biological foundry facilities, illustrate how computational biology compresses discovery cycles. This enables companies to continuously refresh their product portfolios and target region-specific pest and nutrient pressures with tailored microbial and mycorrhizal soil health solutions.


Restraints Impact Analysis

Restraint impact percentages represent the estimated drag on the Agricultural Microbials Market's growth rate. They are directional and not linearly deductible from the composite CAGR.

Restraint ~% Drag on CAGR Geographic Relevance Impact Timeline
Shelf-life and cold-chain limitations ~(–5%) Global Short-term (≤2 yr)
Inconsistent field efficacy perceptions ~(–4%) North America, Europe Medium-term (2–4 yr)
Fragmented regulatory registration pathways ~(–4%) Global (except US/EU) Long-term (≥4 yr)
Limited farmer awareness in emerging markets ~(–3%) Africa, South Asia Medium-term (2–4 yr)
Compatibility issues with existing chemistries ~(–3%) Global Short-term (≤2 yr)


Shelf-Life and Cold-Chain Constraints

Many biocontrol microbial agents require storage between 4°C and 10°C to maintain colony-forming-unit guarantees, imposing logistics costs that add 12–18% to the delivered price in tropical climates [13]. Dry formulations have partially addressed this gap, yet liquid products — which represent over 57% of the Agricultural Microbials Market — still face significant wastage rates above 10% in sub-Saharan African and South Asian distribution networks.

Inconsistent Field Efficacy Perceptions

University extension trials show that microbial biostimulant technology efficacy varies 15–25% depending on soil pH, organic-matter content, and indigenous microbial populations [14]. This variability feeds grower skepticism, particularly in broadacre crops where a single poor season can erase multi-year ROI. Overcoming this perception barrier demands investment in real-time soil diagnostics and outcome-based pricing models.

Fragmented Regulatory Registration Pathways

Outside the US EPA and EFSA frameworks, registration of plant growth-promoting bacteria as crop-protection agents requires navigating separate dossiers in over 80 national jurisdictions, adding 18–36 months and USD 2–5 million per product per country [9]. ASEAN's proposed harmonized framework, expected by 2028, could reduce this burden across ten member states and accelerate the Agricultural Microbials Market in Southeast Asia.


Agricultural Microbials Market Opportunities

Precision Fermentation Cost Breakthroughs

The comparison to early solar-panel cost curves is conceptually true in market dynamics, but the expression of production costs as USD 3 per liter at an industrial scale is factually flawed. Industrial bioprocessing benchmarks measure volumetric productivity in grams per liter per hour ($g/L/h$) and total final dry output yield in $/kg$. Liquid volume costs do not map cleanly to final biological inputs due to highly variable formulation, stabilization, and dilution steps required for broad-acre row crops.

Biologicals-as-a-Service Subscription Models

Subscription software-as-a-service (SaaS) and data-driven agronomy packages do exist across millions of acres globally. However, assigning a specific, rigid 2-million-acre pilot threshold and an exact 80% customer retention metric to an implied Indigo/Bioceres bundle is unverified. Agtech firms generally price biologicals per bag of seed or per acre as upfront inputs rather than true rolling subscription billing.


Carbon-Market Data Monetization

Growers generating verified microbial-application data can monetize nitrogen-reduction credits through blockchain-enabled MRV (measurement, reporting, verification) platforms, creating a dual income stream from yield uplift and carbon payments [3]. This data-as-a-product model transforms the Agricultural Microbials Market from a pure-input sale into a sustainability-services ecosystem

Microbiome Stacking for Multi-Stress Resilience

Microbiome stacking" (mixing rhizobacteria with mycorrhizal networks and biocontrol strains) is a cutting-edge focus area for corporate crop protection. However, companies are legally cautious about guaranteeing large double-digit yield spikes (like 12–18%) in marketing literature, because biological field performance changes heavily based on indigenous soil microbial populations, soil organic matter, and exact localized climate conditions.


Agricultural Microbials Market Future Outlook

AI-Driven Microbiome Engineering (2026–2028)

Advanced machine-learning platforms capable of predicting complex strain–soil–crop interactions are rapidly moving from laboratory pilots toward commercial deployment. This computational shift mirrors precision medicine by accelerating early-stage target strain discovery and enabling hyper-local formulations of plant growth-promoting bacteria. By analyzing vast genomic datasets against localized soil types, developers can bypass traditional trial-and-error sequencing, positioning the agricultural microbials market for an extensive wave of region-specific, highly targeted, effective product launches.


Platform Economics and Outcome-Based Pricing (2028–2031)

Subscription and outcome-based pricing models will expand beyond pilot phases, with biologicals bundled into digital agronomy platforms that integrate soil sensing, satellite imagery, and microbial biostimulant technology application recommendations [10]. Growers pay per yield-uplift unit rather than per liter, fundamentally altering the Agricultural Microbials Market's revenue model and attracting SaaS-oriented investors.

Regulatory Harmonization and Trade Facilitation (2029–2032)

International efforts to align safety and efficacy data requirements for biological crop-protection products aim to streamline fragmented registration processes globally. While distinct national frameworks persist, increased cooperation among global regulatory bodies helps reduce redundant testing protocols for novel biological agents. This gradual synchronization lowers compliance barriers, significantly benefiting mid-size agricultural innovators who develop advanced mycorrhizal fungi and biocontrol strains but have previously been locked out of cost-prohibitive global markets.


Climate-Resilience Mandates and ESG Integration (2030–2035)

The International Panel on Climate Change (IPCC) notes that global croplands face escalating risks from severe climate anomalies, creating immediate structural demand for beneficial soil microorganisms that enhance plant resilience against drought. Concurrently, major food conglomerates adhering to mandatory International Sustainability Standards Board (ISSB) rules must disclose supply-chain climate impacts.


Agricultural Microbials Market Segmentation

By Type

Segment Key Metric Primary Demand Driver
Bacteria ~46% of 2025 revenue Rhizobium/Bacillus inoculants for nitrogen fixation
Fungi CAGR of 15.7% (2026–2035) Mycorrhizal fungi soil health solutions expanding to row crops
Viruses CAGR of 19.5% (2026–2035) Baculovirus-based IPM for Lepidoptera control
Others (Protozoa, Algae) ~4% of 2025 revenue Niche biostimulant applications


Bacteria dominate the Agricultural Microbials Market's type segmentation, anchored by decades of commercial Bradyrhizobium use in soybean and Bacillus thuringiensis deployment in vegetable crops. Plant growth-promoting bacteria strains like Bacillus amyloliquefaciens are gaining traction in cereal systems where nitrogen-fixation and phosphorus-solubilization functions overlap, reducing grower input budgets by 10–15% per acre [2].

Viruses represent the fastest-expanding segment as baculovirus formulations gain registration approvals in Europe and Latin America. These biocontrol microbial agents offer target-species specificity unmatched by broad-spectrum chemistries, appealing to IPM-committed growers of high-value fruits, vegetables, and cotton [5].

By Function

Segment Key Metric Primary Demand Driver
Biopesticides ~51% of 2025 revenue MRL tightening drives chemical-to-biological substitution
Biofertilizers USD 2.67 Billion (2025) Synthetic nitrogen cost inflation
Biostimulants CAGR of 16.3% (2026–2035) Yield-enhancement focus under climate stress


Biopesticides lead the Agricultural Microbials Market by function, reflecting accelerated chemical-substitution pressure from European and Japanese regulators. Microbial biostimulant technology is the fastest-growing functional category, as products containing Trichoderma, mycorrhizae, and PGPB consortia demonstrate measurable yield-uplift effects under drought conditions — a critical selling point for climate-vulnerable cropping regions [14].

By Application

Segment Key Metric Primary Demand Driver
Fruits & Vegetables ~30.5% of 2025 revenue Export residue-free certifications
Grains & Cereals CAGR of 14.6% (2026–2035) Nitrogen-fixation economics in wheat and corn
Pulses & Oilseeds USD 1.95 Billion (2025) Established Bradyrhizobium inoculant market
Commercial Crops CAGR of 15.9% (2026–2035) Cotton and sugarcane input-cost reduction


Fruits and vegetables anchor the Agricultural Microbials Market's application segmentation because zero-residue export requirements force growers to replace chemical spray programs with beneficial soil microorganism products and foliar biocontrol agents. Commercial crops are advancing fastest as large-acreage cotton and sugarcane operations discover that plant growth-promoting bacteria reduce per-hectare input costs while qualifying for sustainability premiums [8].

By Mode of Application

Segment Key Metric Primary Demand Driver
Seed Treatment ~42% of 2025 revenue Consistent CFU delivery at planting
Foliar Spray CAGR of 16.8% (2026–2035) Precision drone-spray technology adoption
Soil Treatment USD 2.10 Billion (2025) Mycorrhizal fungi soil health restoration programs


By Formulation

Segment Key Metric Primary Demand Driver
Liquid ~57% of 2025 revenue Ease of integration into existing spray rigs
Dry CAGR of 16.7% (2026–2035) Superior shelf life in tropical supply chains


Regional Market Share Analysis

Region Key Metric Primary Investment Themes
North America ~34% of 2025 revenue Carbon credits; corn/soy biologicals integration
Europe ~27% of 2025 revenue MRL tightening; organic-farming expansion
Asia-Pacific CAGR of 16.2% (2026–2035) Government subsidies; rice-paddy microbial programs
South America ~14% of 2025 revenue Soybean inoculant adoption; Cerrado expansion
Middle East & Africa CAGR of 13.8% (2026–2035) Smallholder digitization; water-scarcity biologicals
Total USD 8.10 Billion (2025)

The Agricultural Microbials Market spans five major regions, each shaped by distinct regulatory regimes, crop mixes, and farmer adoption dynamics. Asia-Pacific is gaining ground rapidly on the back of government subsidies and national fertilizer-reduction mandates. At the same time, North America retains the dominant position due to early commercial-scale adoption of biocontrol microbial agents and microbial biostimulant technology.


North America

Country Key Metric Key Driver
US ~72% of regional revenue Row-crop carbon-credit programs
Canada CAGR of 15.1% Canola and pulse biological expansion
Mexico USD 0.22 Billion (2025) Protected-agriculture horticulture growth


The US Agricultural Microbials Market benefits from a well-established regulatory pathway through EPA biopesticide registration (Section 3, FIFRA) and growing corporate scope-3 commitments from grain processors. Canada's Prairie provinces are integrating plant growth-promoting bacteria into canola rotations, while Mexico's greenhouse-vegetable sector increasingly relies on beneficial soil microorganism products to meet US export-residue standards [6][3].

Europe

Country Key Metric Key Driver
Germany ~19% of regional revenue Organic acreage expansion targets
UK CAGR of 14.9% Post-Brexit bio-input fast-track registration
France USD 0.38 Billion (2025) Écophyto II+ pesticide-reduction plan
Italy ~12% of regional revenue Wine and olive biocontrol demand
Spain CAGR of 15.3% Protected-horticulture exports
Nordic Countries ~7% of regional revenue Climate-resilience research funding
Russia CAGR of 12.5% Wheat-belt soil-health programs
Rest of Europe ~11% of regional revenue EU Green Deal compliance


The Farm propels Europe's Agricultural Microbials Market to Fork strategy's pesticide-reduction targets and substantial Horizon Europe R&D allocations exceeding EUR 1.5 billion for sustainable crop-protection research [5]. France's Écophyto II+ plan mandates measurable reductions in chemical active-substance use, directly benefiting biocontrol microbial agents and mycorrhizal fungi soil health inoculants.

Asia-Pacific

Country Key Metric Key Driver
China ~35% of regional revenue Zero-growth fertilizer action plan
India CAGR of 17.4% Paramparagat Krishi Vikas Yojana subsidies
Japan USD 0.31 Billion (2025) Green Food System Strategy 2050 targets
South Korea CAGR of 15.6% High-value horticulture bio-input demand
ASEAN ~12% of regional revenue Harmonized registration framework (2028)
Rest of Asia-Pacific CAGR of 14.1% Smallholder advisory platform expansion


Asia-Pacific represents the pivotal growth engine for the Agricultural Microbials Market, with India's organic-farming subsidy programs covering over 5 million hectares and China's fertilizer zero-growth policy driving systematic replacement of synthetic nitrogen with plant growth-promoting bacteria [7][12]. Japan's MAFF Green Food System Strategy allocates JPY 120 billion toward innovation in microbial biostimulant technology for rice cultivation.

South America

Country Key Metric Key Driver
Brazil ~68% of regional revenue Soybean Bradyrhizobium inoculant dominance
Argentina CAGR of 15.8% Outcome-based biologicals subscriptions
Rest of South America ~10% of regional revenue Andean horticultural exports


Brazil is the world's largest consumer of bacterial soybean inoculants, with over 90% of planted area receiving Bradyrhizobium treatments, making the Agricultural Microbials Market an embedded part of standard agronomy rather than a niche add-on [8]. Argentina's Pampas region is piloting subscription-based beneficial soil microorganism products linked to carbon-credit verification.

Middle East & Africa

Country Key Metric Key Driver
Saudi Arabia ~22% of regional revenue NEOM agri-tech investments
UAE CAGR of 14.5% Controlled-environment agriculture
South Africa ~28% of regional revenue Maize and citrus biological programs
Egypt CAGR of 13.2% Nile Delta soil-salinity management
Rest of MEA ~25% of regional revenue Smallholder sachet-format products


Water scarcity and soil degradation are the primary tailwinds for the Agricultural Microbials Market across MEA, where mycorrhizal fungi soil health inoculants improve water-use efficiency by 15–25% in arid cropping systems [11]. Saudi Arabia's NEOM project includes dedicated agri-biotechnology zones targeting local production of biocontrol microbial agents for greenhouse vegetable operations.


Agricultural Microbials Market By Region, 2025-2035
 

Competitive Benchmarking

The Agricultural Microbials Market exhibits medium concentration, with the top five players commanding an estimated 35–40% of global revenue and a Herfindahl–Hirschman Index in the 800–1,000 range. A long tail of regional specialists and biotech start-ups creates a fragmented competitive fringe that larger players are consolidating through acquisitions and licensing deals.

Company Est. Revenue Share Range Key Offerings Strategic Positioning
BASF SE ~7–10% Serifel (Bacillus), Velondis biofungicides Integrated chemical–biological portfolio
Bayer CropScience ~6–9% Serenade, Poncho/VOTiVO seed treatments Row-crop biological scale leadership
Corteva Agriscience ~5–8% Utrisha N biofertilizer, biocontrol pipeline Precision biologicals via digital platforms
Syngenta Group ~5–7% Taegro biofungicide, TYMIRIUM technology Asia-Pacific distribution strength
UPL Limited ~4–6% Biosolutions portfolio, NPP platform Emerging-market biologicals integration
FMC Corporation ~3–5% BioPhero, biosolutions pipeline Biocontrol pheromone/microbial hybrid approach
Novozymes (Novonesis) ~4–6% JumpStart, TagTeam inoculants Enzyme–microbial fermentation scale
Bioceres Crop Solutions ~2–4% HB4 drought-tolerance platform Latin American biologicals leadership
Marrone Bio Innovations ~1–3% Regalia, Grandevo bioinsecticides Specialty biocontrol IP portfolio
Pivot Bio ~1–3% PROVEN nitrogen-fixing microbes AI-driven on-plant nitrogen fixation


Recent News & Developments


  • Corteva Agriscience (March 2023): Acquired Symborg's mycorrhizal technology platform for approximately USD 350 million, expanding its microbial biostimulant technology portfolio for European row crops [18].


  • Pivot Bio (July 2021): Closed a USD 430 million Series D funding round to scale PROVEN nitrogen-fixation microbes across 10 million US corn acres by 2027 [21].
  • EU Commission (2022): Published revised Regulation (EC) No 1107/2009 guidance expediting data requirements for biocontrol microbial agents, cutting average approval timelines from 3.5 to 2 years [5].


Agricultural Microbials Market Report Scope

Parameter Detail
Market Scope Global Agricultural Microbials Market — microbial-based biofertilizers, biopesticides, biostimulants
Study Period 2021–2035
Historical Period 2021–2024
Base Year 2025
Forecast Period 2026–2035
CAGR (2026–2035) 14.85%
Market Size (2025) USD 8.10 Billion
Market Size (2035) USD 28.52 Billion
Fastest Growing Segment (Type) Viruses (19.5% CAGR)
Fastest Growing Region Asia-Pacific (16.2% CAGR)
Companies Profiled 10
Valuation Currency USD Billion


FAQs

How do microbial inoculants perform in no-till farming compared to conventional tillage systems?

No-till systems preserve soil fungal networks and organic-matter layers that support microbial colonization, yielding 10–15% higher inoculant efficacy than tilled fields [14]. Reduced soil disturbance allows beneficial soil microorganism products to establish stable rhizosphere populations across multiple growing seasons.

What shelf-life benchmarks should procurement teams require when sourcing liquid biocontrol formulations?

Leading formulations guarantee ≥1 × 10⁹ CFU/mL for 12–18 months at 25°C storage [13]. Procurement specifications should mandate independent third-party viability testing at the point of delivery.

How does the Agricultural Microbials Market address resistance management compared to chemical alternatives?

Multi-mode-of-action biocontrol microbial agents exert selection pressure through competition, antibiosis, and induced systemic resistance simultaneously, making single-gene resistance development in target pests extremely unlikely [15]. This contrasts sharply with single-site chemical fungicides facing rapid resistance evolution.

What minimum acreage thresholds make on-farm microbial fermentation economically viable?

On-farm fermentation units producing plant growth-promoting bacteria become cost-effective above approximately 2,000 hectares, where per-liter production costs drop below USD 1.50 [10]. Smaller operations benefit more from centrally manufactured products.

Which quality certifications should buyers prioritize when evaluating Agricultural Microbials Market suppliers?

ISO 17025–accredited strain identification, OMRI listing for organic compatibility, and EPA Section 3 or EFSA Annex I registration provide the strongest supplier-quality signals [5][9]. These certifications ensure consistent strain identity and field performance.

How do mycorrhizal fungi soil health products interact with phosphorus fertilization programs?

High soil-phosphorus levels above 40 ppm Olsen-P suppress mycorrhizal colonization by 30–50%, reducing inoculant ROI [14]. Agronomists recommend reducing P applications by 25–40% when integrating mycorrhizal products into fertility programs.

What role does the Agricultural Microbials Market play in meeting Scope 3 emissions reduction targets for food companies?

Replacing 30% of synthetic nitrogen with microbial biostimulant technology reduces upstream Scope 3 fertilizer-manufacturing emissions by approximately 0.8–1.2 metric tons CO₂e per hectare annually [3]. Major food processors are embedding microbial-input procurement into supplier scorecards.


Author
Author
Author Profile
Snehal Singh LinkedIn
Manager - Research
High acumen in analyzing complex macro & micro markets with more than 6 years of work experience in the field of market research. By implementing her analytical skills in forecasting and estimation into market research reports, she has expertise in Packaging, Construction, and Equipment domains. She handles a team size of 20-25 resources and ensures smooth running of the projects, associated marketing activities, and client servicing.

Research Approach


Secondary Research

The secondary research process involved comprehensive analysis of regulatory databases, peer-reviewed agricultural and microbiology journals, scientific publications, and authoritative agribusiness organizations. Key sources included the US Environmental Protection Agency (EPA), European Commission (EC) Directorate-General for Health and Food Safety, Food and Agriculture Organization of the United Nations (FAO), US Department of Agriculture (USDA) National Agricultural Statistics Service (NASS) and Economic Research Service, European Food Safety Authority (EFSA), Health Canada Pest Management Regulatory Agency (PMRA), Brazilian Ministry of Agriculture, Livestock and Food Supply (MAPA), Indian Ministry of Agriculture & Farmers Welfare, CGIAR System Organization, International Biocontrol Manufacturers Association (IBMA), Biopesticide Industry Alliance (BPIA), CropLife International, FAO Statistics Division (FAOSTAT), EU Eurostat Agricultural Statistics, National Center for Biotechnology Information (NCBI/PubMed), Journal of Applied Microbiology, and national agricultural ministry reports from key producing regions. These sources were used to collect crop protection statistics, biopesticide and biofertilizer registration data, efficacy and safety studies, agricultural land-use trends, and competitive landscape analysis for bacterial strains, fungal agents, viral biopesticides, and other microbial crop inputs.


Primary Research

Qualitative and quantitative insights were obtained by interviewing supply-side and demand-side stakeholders during the primary research process. The supply-side sources consisted of CEOs, VPs of Product Development, regulatory affairs managers, and commercial directors from agricultural microbial manufacturers, biological crop protection companies, and fermentation technology providers. Chief agronomists, crop protection managers, agricultural cooperative procurement directors, sustainability officers from large-scale farming operations, and category managers from agrochemical distributors and agricultural retailers comprised demand-side sources. Market segmentation was validated, biological product pipeline timelines were confirmed, and insights regarding field adoption patterns, pricing strategies per treated hectare, and distribution channel dynamics were obtained through primary research.

Primary Respondent Breakdown:

• By Designation: C-level Primaries (32%), Director Level (40%), Others (28%)

• By Region: North America (28%), Europe (32%), Asia-Pacific (30%), Rest of World (10%)


Market Size Estimation

Global market valuation was derived through revenue mapping and application volume analysis. The methodology included:

• Identification of over 45 key manufacturers in North America, Europe, Asia-Pacific, and Latin America who specialize in biocontrol agents and biofertilizers

• Product mapping across bacterial agricultural microbials (Bacillus, Pseudomonas, etc.), fungal agents (Trichoderma, Beauveria bassiana, etc.), viral biopesticides, and other microbial strains

• Analysis of reported and modeled annual revenues specific to biological crop protection and plant health portfolios

• Coverage of manufacturers representing 70-75% of global market share in 2024

• Extrapolation using bottom-up (treated hectare volume × pricing per application by region and crop type) and top-down (manufacturer revenue validation) approaches to derive segment-specific valuations

Download Free Sample

Kindly complete the form below to receive a free sample of this Report

Download PDF ×

We do not share your information with anyone. However, we may send you emails based on your report interest from time to time. You may contact us at any time to opt-out.