×
Hero Background
English
Chinese
French
Japanese
Korean
German
Spanish

Agricultural Packaging Market Share

ID: MRFR/PCM/5427-HCR
100 Pages
Snehal Singh
October 2025

Agricultural Packaging Market Research Report by Material (Plastic, Paper & Paperboard, Metal, Glass), Product (Pouches, Bags, Bottles, Trays), Barrier Strength (High, Medium, Low), Application (Chemical Pesticides, Chemical Fertilizers, Biologicals) and Region — Forecast till 2035

Share:
Download PDF ×

We do not share your information with anyone. However, we may send you emails based on your report interest from time to time. You may contact us at any time to opt-out.

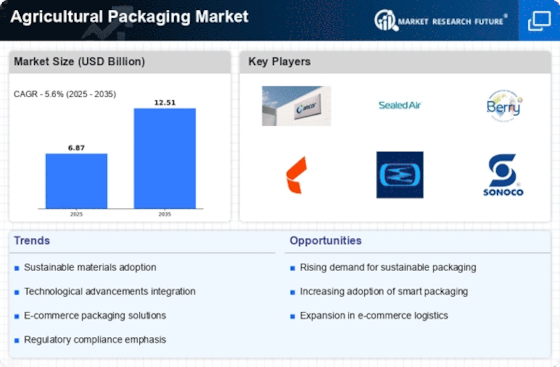
Agricultural Packaging Market Infographic
Purchase Options

Market Share

Agricultural Packaging Market Share Analysis

In the dynamic Agricultural Packaging Market, firms use market share positioning tactics to get a competitive edge and grow their market share. Innovative packaging is a common tactic. Companies study and develop packaging materials for the agriculture sector to prevent perishable items from spoiling, reduce environmental effect, and make transportation easier. Companies aspire to attract efficiency- and sustainability-seeking clients with innovative packaging solutions.

Additionally, price methods affect market share positioning in the Agricultural Packaging Market. Some organizations use cost leadership to provide cheaper packaging solutions than their competitors. This strategy seeks to attract price-sensitive clients and increase market share through affordability. Premium pricing schemes emphasize excellent, customized packaging with extra features. These premium items target quality-conscious clients prepared to spend more for functionality and reliability.

In the Agricultural Packaging Market, collaboration and strategic alliances are crucial positioning tactics. Companies regularly partner with agricultural producers, suppliers, and distribution networks to expand their markets. By partnering with industry leaders, firms may reach new markets and share resources and experience. Collaborations improve the value proposition and boost agricultural brand exposure and trust.

Companies also use market segmentation to position themselves. Companies adjust packaging solutions to crop type, region, and farming techniques to meet the different demands of the agricultural business. Companies may tailor their packaging solutions to each market group by knowing their distinct needs and creating tailored marketing campaigns and product offers.

Sustainability and eco-friendliness are becoming increasingly important in agricultural packaging market share positioning. As environmental awareness rises, consumers and companies want packaging that is green. These practises help the earth and position corporations as pioneers in sustainable agricultural packaging, attracting a rising sector of environmentally conscious customers.

Author
Snehal Singh
Assistant Manager - Research

High acumen in analyzing complex macro & micro markets with more than 6 years of work experience in the field of market research. By implementing her analytical skills in forecasting and estimation into market research reports, she has expertise in Packaging, Construction, and Equipment domains. She handles a team size of 20-25 resources and ensures smooth running of the projects, associated marketing activities, and client servicing.

Leave a Comment

FAQs

What is the projected market valuation of the Agricultural Packaging Market by 2035?

The Agricultural Packaging Market is projected to reach a valuation of 12.51 USD Billion by 2035.

What was the market valuation of the Agricultural Packaging Market in 2024?

In 2024, the Agricultural Packaging Market was valued at 6.87 USD Billion.

What is the expected CAGR for the Agricultural Packaging Market during the forecast period 2025 - 2035?

The expected CAGR for the Agricultural Packaging Market during the forecast period 2025 - 2035 is 5.6%.

Which materials dominate the Agricultural Packaging Market?

The dominant materials in the Agricultural Packaging Market include Plastic, Paper and Paperboard, Metal, and Glass, with Plastic projected to grow from 2.74 to 5.0 USD Billion.

What are the key product segments in the Agricultural Packaging Market?

Key product segments include Pouches, Bags, Bottles, and Trays, with Bags expected to increase from 2.0 to 3.6 USD Billion.

Market Summary

As per MRFR analysis, the Agricultural Packaging Market Size was estimated at 6.87 USD Billion in 2024. The Agricultural Packaging industry is projected to grow from 7.255 USD Billion in 2025 to 12.51 USD Billion by 2035, exhibiting a compound annual growth rate (CAGR) of 5.6 during the forecast period 2025 - 2035.

Key Market Trends & Highlights

The Agricultural Packaging Market is experiencing a shift towards sustainability and technological innovation.

  • Sustainable packaging solutions are increasingly prioritized by manufacturers to meet consumer demand.
  • Technological integration is enhancing packaging efficiency and reducing waste across the supply chain.
  • The North American market remains the largest, while the Asia-Pacific region is recognized as the fastest-growing market.
  • Rising demand for fresh produce and e-commerce growth are driving the adoption of innovative packaging solutions, particularly in plastic and pouches.

Market Size & Forecast

2024 Market Size 6.87 (USD Billion)
2035 Market Size 12.51 (USD Billion)
CAGR (2025 - 2035) 5.6%
Largest Regional Market Share in 2024 Asia Pacific

Major Players

<p>Amcor (AU), Sealed Air (US), Berry Global (US), Mondi Group (GB), Smurfit Kappa (IE), Sonoco Products (US), International Paper (US), WestRock (US), Novolex (US)</p>

Market Trends

The Agricultural Packaging Market is currently experiencing a transformative phase, driven by evolving consumer preferences and increasing environmental awareness. As sustainability becomes a focal point for many industries, packaging solutions that minimize waste and utilize eco-friendly materials are gaining traction. This shift is not merely a trend but appears to be a fundamental change in how agricultural products are packaged and distributed. Innovations in biodegradable and recyclable materials are emerging, suggesting a potential for significant growth in this sector. Furthermore, the demand for packaging that enhances product shelf life and reduces spoilage is likely to influence market dynamics, as producers seek to maintain quality while minimizing losses. In addition to sustainability, technological advancements are reshaping the Agricultural Packaging Market. Smart packaging solutions, which incorporate sensors and tracking technologies, are becoming increasingly prevalent. These innovations may enhance supply chain efficiency and provide valuable data on product conditions during transit. As the market continues to evolve, it seems that the integration of technology with traditional packaging methods could lead to new opportunities for growth and differentiation. Overall, the Agricultural Packaging Market is poised for a period of substantial evolution, characterized by a blend of sustainability and technological integration.

Sustainable Packaging Solutions

The emphasis on eco-friendly materials is reshaping the Agricultural Packaging Market. Producers are increasingly adopting biodegradable and recyclable options to meet consumer demand for sustainability.

Technological Integration

The rise of smart packaging technologies is influencing the Agricultural Packaging Market. Innovations such as sensors and tracking systems are enhancing supply chain efficiency and product monitoring.

Enhanced Shelf Life

There is a growing focus on packaging that extends the shelf life of agricultural products. This trend is driven by the need to reduce spoilage and maintain product quality during distribution.

Agricultural Packaging Market Market Drivers

E-commerce Growth

The Agricultural Packaging Market is significantly influenced by the rapid growth of e-commerce. As online grocery shopping becomes more prevalent, the demand for packaging that can withstand the rigors of shipping and handling is increasing. This shift necessitates the development of durable and protective packaging solutions that ensure products arrive in optimal condition. Market analysis indicates that the e-commerce segment of agricultural products is expected to expand, leading to a corresponding rise in demand for specialized packaging. Companies that can provide innovative solutions tailored for e-commerce logistics are likely to gain a competitive edge. This trend underscores the importance of adapting packaging strategies to meet the unique challenges posed by online sales in the Agricultural Packaging Market.

Regulatory Compliance

Regulatory compliance is a critical driver in the Agricultural Packaging Market, as governments worldwide implement stricter packaging regulations to ensure food safety and environmental protection. Compliance with these regulations often requires significant investment in packaging materials and processes. Companies must stay abreast of changing regulations, which can vary by region and product type. This necessity creates opportunities for packaging innovations that not only meet regulatory standards but also enhance product appeal. The market is likely to see an increase in demand for packaging solutions that are compliant with food safety regulations, as well as those that address environmental concerns. As such, businesses that prioritize compliance are better positioned to succeed in the competitive landscape of the Agricultural Packaging Market.

Technological Advancements

Technological advancements are playing a crucial role in the evolution of the Agricultural Packaging Market. Innovations such as smart packaging, which incorporates sensors and tracking technologies, are becoming increasingly prevalent. These technologies enhance supply chain efficiency and improve product traceability, which is vital for maintaining quality and safety standards. The integration of automation in packaging processes is also streamlining operations, reducing costs, and minimizing human error. According to recent data, the market for smart packaging is expected to grow significantly, driven by the need for enhanced functionality and consumer engagement. As technology continues to advance, it is likely that the Agricultural Packaging Market will see a surge in demand for high-tech solutions that meet the needs of modern agriculture.

Sustainable Practices Adoption

The Agricultural Packaging Market is witnessing a notable shift towards sustainable practices. As consumers increasingly demand eco-friendly solutions, manufacturers are compelled to innovate. The adoption of biodegradable and recyclable materials is on the rise, with a projected increase in market share for sustainable packaging options. This trend is driven by regulatory pressures and consumer preferences, which emphasize environmental responsibility. In fact, studies indicate that sustainable packaging could account for a significant portion of the market by 2027. Companies that prioritize sustainability not only enhance their brand image but also align with the growing global movement towards reducing plastic waste. This shift is likely to reshape the competitive landscape of the Agricultural Packaging Market, as businesses that fail to adapt may find themselves at a disadvantage.

Rising Demand for Fresh Produce

The Agricultural Packaging Market is experiencing a surge in demand for fresh produce, driven by changing consumer preferences towards healthier eating habits. As more individuals prioritize fresh fruits and vegetables, the need for effective packaging solutions that preserve freshness and extend shelf life becomes paramount. This trend is reflected in market data, which suggests that the fresh produce packaging segment is expected to grow at a robust rate over the next few years. Packaging that ensures product integrity and minimizes spoilage is increasingly sought after by retailers and consumers alike. Consequently, companies that specialize in innovative packaging solutions tailored for fresh produce are likely to thrive in this evolving market landscape.

Market Segment Insights

By Material: Plastic (Largest) vs. Paper and Paperboard (Fastest-Growing)

<p>The Agricultural Packaging Market showcases a diverse range of materials, with plastic leading the segment due to its versatility and durability. Plastic packaging is favored for its lightweight nature and excellent barrier properties, making it ideal for various agricultural products. In comparison, paper and paperboard are rapidly gaining traction, especially among eco-conscious consumers and brands focused on sustainability. Their share has been increasing as the industry shifts towards more biodegradable and recyclable options. Growth trends in the agricultural packaging segment highlight a significant shift towards sustainable materials. As environmental concerns rise, manufacturers are innovating in paper and paperboard products to enhance their functionality while minimizing ecological footprints. Plastic continues to dominate due to existing technological advancements, but the push for sustainability is driving investment in organic and biodegradable materials, opening opportunities for emerging options like plant-based packaging solutions.</p>

<p>Plastic (Dominant) vs. Paper and Paperboard (Emerging)</p>

<p>Plastic packaging remains the most dominant material in the Agricultural Packaging Market, prized for its versatility, barrier qualities, and cost-effectiveness. Often used for containers, bags, and wraps, plastic is preferred for its ability to preserve freshness and extend shelf life. On the other hand, paper and paperboard are emerging as a significant alternative, appealing strongly to environmentally conscious consumers. As these materials undergo innovation to improve moisture resistance and durability, they are becoming increasingly suitable for various agricultural applications. Together, while plastic maintains a stronghold driven by existing infrastructure, paper products are carving a niche as an eco-friendly option, responding to the rising demand for sustainable practices in the industry.</p>

By Product: Bags (Largest) vs. Pouches (Fastest-Growing)

<p>In the Agricultural Packaging Market, the segment distribution reveals that Bags hold the largest share, being extensively used due to their durability and cost-effectiveness. Pouches, on the other hand, are rapidly gaining ground as they provide convenience and superior branding opportunities, appealing to both manufacturers and consumers alike. The distinctive functionalities of each packaging type cater to diverse agricultural needs, contributing to a competitive market landscape. The growth trends indicate that Bags enjoy stable demand driven by traditional agricultural practices, while Pouches are seeing a sharp rise attributed to the shift towards more modern and flexible packaging solutions. This evolution is supported by the increasing preferences for lightweight packaging and the need for enhanced product visibility, further propelling Pouches towards becoming a leading choice in the market.</p>

<p>Bags (Dominant) vs. Pouches (Emerging)</p>

<p>Bags have established themselves as a dominant force in the Agricultural Packaging Market due to their resilience, versatility, and lower production costs. They cater to a variety of agricultural products, including grains, seeds, and fertilizers, making them a staple in farming operations. Their ability to handle heavy loads and environmental stress gives them a marked advantage in traditional packaging preferences. Conversely, Pouches are emerging as a vital option, bolstered by the demand for lightweight and user-friendly packaging that aligns with sustainable practices. Pouches enhance product preservation and have the capacity for innovative designs that attract consumers, indicating a significant shift in agricultural packaging trends.</p>

By Barrier Strength: High Barrier (Largest) vs. Medium Barrier (Fastest-Growing)

<p>In the Agricultural Packaging Market, the barrier strength segment reflects varying levels of product protection, with 'High Barrier' packaging dominating the market share. This segment is primarily sought after for its durability and capability to preserve the freshness of agricultural products, making it essential for perishable goods. In contrast, 'Medium Barrier' packaging is increasingly gaining traction due to its cost-effectiveness, serving as a suitable alternative for products that do not require extensive protection. As a result, the distribution of market share among these segments highlights the importance of balancing performance and affordability in packaging choices.</p>

<p>Barrier Strength: High (Dominant) vs. Medium (Emerging)</p>

<p>The High Barrier segment stands out as a dominant force in the agricultural packaging landscape, providing superior protection against environmental factors, moisture, and contaminants. This segment caters to premium products requiring stringent quality controls, such as fresh produce and organic goods, ensuring their extended shelf life. Conversely, the Medium Barrier segment is emerging rapidly, attracting companies looking for budget-friendly options without significantly compromising on quality. This segment is particularly appealing for bulk agricultural products where cost savings matter more than ultra-high protection. Both segments are critical, but the High Barrier packaging remains the preferred choice for quality-conscious producers.</p>

By Application: Chemical Pesticides (Largest) vs. Biological (Fastest-Growing)

<p>In the Agricultural Packaging Market, the application segment is significantly influenced by the distribution of market share among chemical pesticides, chemical fertilizers, and biological solutions. Chemical pesticides hold the largest share due to their extensive use in crop protection, reflecting the vital role they play in enhancing agricultural productivity. Chemical fertilizers also occupy a considerable portion, contributing to soil health and crop yield, while biological solutions, although smaller in share, are increasingly recognized for their environmentally friendly attributes, appealing to a growing market segment focused on sustainability.</p>

<p>Chemical Pesticides (Dominant) vs. Biological (Emerging)</p>

<p>Chemical pesticides are positioned as the dominant force in the Agricultural Packaging Market, attributed to their established effectiveness in pest control and the enhancement of crop yield. Their packaging needs are centered around ensuring product integrity and safety, driving innovations in materials and design. Meanwhile, biological solutions are emerging rapidly as farmers seek sustainable alternatives. They emphasize natural ingredients that work synergistically with crops to enhance growth without causing harm to the ecosystem. As demand for greener practices rises, biological solutions are becoming a preferred choice, despite their current smaller market share.</p>

Get more detailed insights about Agricultural Packaging Market Research Report -Global Forecast till 2035

Regional Insights

North America : Innovation and Sustainability Focus

North America is the largest market for agricultural packaging, holding approximately 40% of the global share. The region's growth is driven by increasing demand for sustainable packaging solutions and stringent regulations promoting eco-friendly materials. The U.S. and Canada are the primary contributors, with a growing emphasis on reducing plastic waste and enhancing recyclability in packaging. The competitive landscape is characterized by major players such as Amcor, Sealed Air, and Berry Global, who are investing in innovative technologies and sustainable practices. The presence of advanced manufacturing facilities and a robust supply chain further bolster the market. Additionally, government initiatives aimed at promoting sustainable agriculture are expected to enhance market growth in the coming years.

Europe : Sustainability and Regulation Driven

Europe is the second-largest market for agricultural packaging, accounting for around 30% of the global market share. The region is witnessing a surge in demand for biodegradable and recyclable packaging solutions, driven by stringent EU regulations aimed at reducing plastic waste. Countries like Germany and France are leading the charge, with policies that encourage sustainable practices in agriculture and packaging. The competitive landscape in Europe is marked by key players such as Mondi Group and Smurfit Kappa, who are focusing on innovation and sustainability. The presence of a well-established agricultural sector and increasing consumer awareness regarding environmental issues are further propelling market growth. Collaborative efforts between governments and private sectors are also fostering advancements in packaging technologies.

Asia-Pacific : Rapid Growth and Adoption

Asia-Pacific is rapidly emerging as a significant player in the agricultural packaging market, holding approximately 25% of the global share. The region's growth is fueled by increasing agricultural production, rising population, and a growing demand for packaged food products. Countries like China and India are at the forefront, with government initiatives supporting modern agricultural practices and sustainable packaging solutions. The competitive landscape is evolving, with local and international players vying for market share. Companies such as Sonoco Products and International Paper are expanding their operations in the region, focusing on innovative packaging solutions tailored to local needs. The increasing investment in agricultural technology and infrastructure is expected to further drive market growth in the coming years.

Middle East and Africa : Emerging Market Potential

The Middle East and Africa region is witnessing a gradual increase in the agricultural packaging market, holding about 5% of the global share. The growth is primarily driven by rising agricultural activities and the need for efficient packaging solutions to enhance shelf life and reduce waste. Countries like South Africa and Kenya are leading the market, supported by government initiatives aimed at improving agricultural productivity and sustainability. The competitive landscape is characterized by a mix of local and international players, with companies like WestRock and Novolex making inroads into the market. The increasing focus on food security and sustainable practices is expected to create new opportunities for growth. Additionally, investments in infrastructure and technology are likely to enhance the market's potential in the coming years.

Key Players and Competitive Insights

The Agricultural Packaging Market is currently characterized by a dynamic competitive landscape, driven by increasing demand for sustainable packaging solutions and innovations in material technology. Key players such as Amcor (AU), Sealed Air (US), and Berry Global (US) are strategically positioning themselves to capitalize on these trends. Amcor (AU) focuses on enhancing its product portfolio with eco-friendly materials, while Sealed Air (US) emphasizes automation and smart packaging technologies. Berry Global (US) is actively pursuing mergers and acquisitions to expand its market reach and diversify its offerings. Collectively, these strategies not only enhance their competitive edge but also contribute to a rapidly evolving market environment.

In terms of business tactics, companies are increasingly localizing manufacturing to reduce lead times and optimize supply chains. The Agricultural Packaging Market appears moderately fragmented, with a mix of large multinational corporations and smaller regional players. The influence of key players is significant, as they set industry standards and drive innovation, thereby shaping the overall market structure.

In August 2025, Amcor (AU) announced a partnership with a leading agricultural technology firm to develop biodegradable packaging solutions tailored for the fresh produce sector. This collaboration is strategically important as it aligns with the growing consumer preference for sustainable products, potentially enhancing Amcor's market share in the eco-conscious segment of agricultural packaging.

In September 2025, Sealed Air (US) unveiled a new line of smart packaging solutions that utilize IoT technology to monitor the freshness of perishable goods. This innovation is likely to strengthen Sealed Air's position in the market by addressing the increasing demand for enhanced supply chain transparency and food safety, thus appealing to both producers and consumers.

In July 2025, Berry Global (US) completed the acquisition of a regional packaging company specializing in sustainable materials. This strategic move not only expands Berry's product offerings but also reinforces its commitment to sustainability, which is becoming a critical factor in consumer purchasing decisions. The acquisition is expected to enhance Berry's competitive positioning in the agricultural packaging sector.

As of October 2025, the Agricultural Packaging Market is witnessing trends such as digitalization, sustainability, and the integration of artificial intelligence in packaging solutions. Strategic alliances among key players are increasingly shaping the competitive landscape, fostering innovation and collaboration. Looking ahead, it is anticipated that competitive differentiation will evolve from traditional price-based competition to a focus on innovation, technological advancements, and supply chain reliability, as companies strive to meet the changing demands of consumers and regulatory standards.

Key Companies in the Agricultural Packaging Market market include

Industry Developments

    • KM Packaging introduces a new line of compostable products in January 2021. Shrink wrap, stretch wrap, sticky tape, netting, and bags will all be part of the C-Range of bio-plastic packaging materials. These bio-plastic goods were created in collaboration with Treetop Biopak, a company that specializes in compostable packaging solutions.
    • With the debut of BanaBag, Smurfit Kappa, a manufacturer of paper-based packaging solutions, has expanded its portfolio of sustainable and biodegradable agricultural products. It solves the necessity for quality assurance for bagging across the banana plant's whole growth cycle. It protects the fruit from disease and insects while also preventing overheating that can occur when other materials, like plastic, are used.
    • Andaltec, a Spanish plastics technology center, started the 'BioNanocel' R&D project, which aims to develop bio-based active plastic packaging made from cellulose derived from vegetal biomass. The goal of this project is to develop a sustainable plastic material for the food sector that has improved qualities. It will repurpose vegetal biomass waste from agricultural activities that would otherwise be thrown away.

Future Outlook

Agricultural Packaging Market Future Outlook

<p>The Agricultural Packaging Market is projected to grow at a 5.6% CAGR from 2024 to 2035, driven by sustainability trends, technological advancements, and increasing demand for efficient packaging solutions.</p>

New opportunities lie in:

  • <p>Development of biodegradable packaging materials for eco-conscious consumers.</p>
  • <p>Integration of smart packaging technologies to enhance supply chain transparency.</p>
  • <p>Expansion of e-commerce packaging solutions tailored for agricultural products.</p>

<p>By 2035, the Agricultural Packaging Market is expected to achieve robust growth, driven by innovation and sustainability.</p>

Market Segmentation

Agricultural Packaging Market Product Outlook

  • Pouches
  • Bags
  • Bottles
  • Trays and Others

Agricultural Packaging Market Material Outlook

  • Plastic
  • Paper and Paperboard
  • Metal
  • Glass and Others

Agricultural Packaging Market Application Outlook

  • Chemical pesticides
  • Chemical fertilizers
  • Biological

Agricultural Packaging Market Barrier Strength Outlook

  • High
  • Medium
  • Low

Report Scope

MARKET SIZE 20246.87(USD Billion)
MARKET SIZE 20257.255(USD Billion)
MARKET SIZE 203512.51(USD Billion)
COMPOUND ANNUAL GROWTH RATE (CAGR)5.6% (2024 - 2035)
REPORT COVERAGERevenue Forecast, Competitive Landscape, Growth Factors, and Trends
BASE YEAR2024
Market Forecast Period2025 - 2035
Historical Data2019 - 2024
Market Forecast UnitsUSD Billion
Key Companies ProfiledMarket analysis in progress
Segments CoveredMarket segmentation analysis in progress
Key Market OpportunitiesAdoption of sustainable materials in the Agricultural Packaging Market enhances environmental compliance and consumer appeal.
Key Market DynamicsRising demand for sustainable materials drives innovation and competition in the Agricultural Packaging Market.
Countries CoveredNorth America, Europe, APAC, South America, MEA

FAQs

What is the projected market valuation of the Agricultural Packaging Market by 2035?

The Agricultural Packaging Market is projected to reach a valuation of 12.51 USD Billion by 2035.

What was the market valuation of the Agricultural Packaging Market in 2024?

In 2024, the Agricultural Packaging Market was valued at 6.87 USD Billion.

What is the expected CAGR for the Agricultural Packaging Market during the forecast period 2025 - 2035?

The expected CAGR for the Agricultural Packaging Market during the forecast period 2025 - 2035 is 5.6%.

Which materials dominate the Agricultural Packaging Market?

The dominant materials in the Agricultural Packaging Market include Plastic, Paper and Paperboard, Metal, and Glass, with Plastic projected to grow from 2.74 to 5.0 USD Billion.

What are the key product segments in the Agricultural Packaging Market?

Key product segments include Pouches, Bags, Bottles, and Trays, with Bags expected to increase from 2.0 to 3.6 USD Billion.

  1. SECTION I: EXECUTIVE SUMMARY AND KEY HIGHLIGHTS
    1. EXECUTIVE SUMMARY
      1. Market Overview
      2. Key Findings
      3. Market Segmentation
      4. Competitive Landscape
      5. Challenges and Opportunities
      6. Future Outlook
  2. SECTION II: SCOPING, METHODOLOGY AND MARKET STRUCTURE
    1. MARKET INTRODUCTION
      1. Definition
      2. Scope of the study
    2. RESEARCH METHODOLOGY
      1. Overview
      2. Data Mining
      3. Secondary Research
      4. Primary Research
      5. Forecasting Model
      6. Market Size Estimation
      7. Data Triangulation
      8. Validation
  3. SECTION III: QUALITATIVE ANALYSIS
    1. MARKET DYNAMICS
      1. Overview
      2. Drivers
      3. Restraints
      4. Opportunities
    2. MARKET FACTOR ANALYSIS
      1. Value chain Analysis
      2. Porter's Five Forces Analysis
      3. COVID-19 Impact Analysis
  4. SECTION IV: QUANTITATIVE ANALYSIS
    1. Packaging & Transport, BY Material (USD Billion)
      1. Plastic
      2. Paper and Paperboard
      3. Metal
      4. Glass and Others
    2. Packaging & Transport, BY Product (USD Billion)
      1. Pouches
      2. Bags
      3. Bottles
      4. Trays and Others
    3. Packaging & Transport, BY Barrier Strength (USD Billion)
      1. High
      2. Medium
      3. Low
    4. Packaging & Transport, BY Application (USD Billion)
      1. Chemical pesticides
      2. Chemical fertilizers
      3. Biological
    5. Packaging & Transport, BY Region (USD Billion)
      1. North America
      2. Europe
      3. APAC
      4. South America
      5. MEA
  5. SECTION V: COMPETITIVE ANALYSIS
    1. Competitive Landscape
      1. Overview
      2. Competitive Analysis
      3. Market share Analysis
      4. Major Growth Strategy in the Packaging & Transport
      5. Competitive Benchmarking
      6. Leading Players in Terms of Number of Developments in the Packaging & Transport
      7. Key developments and growth strategies
      8. Major Players Financial Matrix
    2. Company Profiles
      1. Amcor (AU)
      2. Sealed Air (US)
      3. Berry Global (US)
      4. Mondi Group (GB)
      5. Smurfit Kappa (IE)
      6. Sonoco Products (US)
      7. International Paper (US)
      8. WestRock (US)
      9. Novolex (US)
    3. Appendix
      1. References
      2. Related Reports
  6. LIST OF FIGURES
    1. MARKET SYNOPSIS
    2. NORTH AMERICA MARKET ANALYSIS
    3. US MARKET ANALYSIS BY MATERIAL
    4. US MARKET ANALYSIS BY PRODUCT
    5. US MARKET ANALYSIS BY BARRIER STRENGTH
    6. US MARKET ANALYSIS BY APPLICATION
    7. CANADA MARKET ANALYSIS BY MATERIAL
    8. CANADA MARKET ANALYSIS BY PRODUCT
    9. CANADA MARKET ANALYSIS BY BARRIER STRENGTH
    10. CANADA MARKET ANALYSIS BY APPLICATION
    11. EUROPE MARKET ANALYSIS
    12. GERMANY MARKET ANALYSIS BY MATERIAL
    13. GERMANY MARKET ANALYSIS BY PRODUCT
    14. GERMANY MARKET ANALYSIS BY BARRIER STRENGTH
    15. GERMANY MARKET ANALYSIS BY APPLICATION
    16. UK MARKET ANALYSIS BY MATERIAL
    17. UK MARKET ANALYSIS BY PRODUCT
    18. UK MARKET ANALYSIS BY BARRIER STRENGTH
    19. UK MARKET ANALYSIS BY APPLICATION
    20. FRANCE MARKET ANALYSIS BY MATERIAL
    21. FRANCE MARKET ANALYSIS BY PRODUCT
    22. FRANCE MARKET ANALYSIS BY BARRIER STRENGTH
    23. FRANCE MARKET ANALYSIS BY APPLICATION
    24. RUSSIA MARKET ANALYSIS BY MATERIAL
    25. RUSSIA MARKET ANALYSIS BY PRODUCT
    26. RUSSIA MARKET ANALYSIS BY BARRIER STRENGTH
    27. RUSSIA MARKET ANALYSIS BY APPLICATION
    28. ITALY MARKET ANALYSIS BY MATERIAL
    29. ITALY MARKET ANALYSIS BY PRODUCT
    30. ITALY MARKET ANALYSIS BY BARRIER STRENGTH
    31. ITALY MARKET ANALYSIS BY APPLICATION
    32. SPAIN MARKET ANALYSIS BY MATERIAL
    33. SPAIN MARKET ANALYSIS BY PRODUCT
    34. SPAIN MARKET ANALYSIS BY BARRIER STRENGTH
    35. SPAIN MARKET ANALYSIS BY APPLICATION
    36. REST OF EUROPE MARKET ANALYSIS BY MATERIAL
    37. REST OF EUROPE MARKET ANALYSIS BY PRODUCT
    38. REST OF EUROPE MARKET ANALYSIS BY BARRIER STRENGTH
    39. REST OF EUROPE MARKET ANALYSIS BY APPLICATION
    40. APAC MARKET ANALYSIS
    41. CHINA MARKET ANALYSIS BY MATERIAL
    42. CHINA MARKET ANALYSIS BY PRODUCT
    43. CHINA MARKET ANALYSIS BY BARRIER STRENGTH
    44. CHINA MARKET ANALYSIS BY APPLICATION
    45. INDIA MARKET ANALYSIS BY MATERIAL
    46. INDIA MARKET ANALYSIS BY PRODUCT
    47. INDIA MARKET ANALYSIS BY BARRIER STRENGTH
    48. INDIA MARKET ANALYSIS BY APPLICATION
    49. JAPAN MARKET ANALYSIS BY MATERIAL
    50. JAPAN MARKET ANALYSIS BY PRODUCT
    51. JAPAN MARKET ANALYSIS BY BARRIER STRENGTH
    52. JAPAN MARKET ANALYSIS BY APPLICATION
    53. SOUTH KOREA MARKET ANALYSIS BY MATERIAL
    54. SOUTH KOREA MARKET ANALYSIS BY PRODUCT
    55. SOUTH KOREA MARKET ANALYSIS BY BARRIER STRENGTH
    56. SOUTH KOREA MARKET ANALYSIS BY APPLICATION
    57. MALAYSIA MARKET ANALYSIS BY MATERIAL
    58. MALAYSIA MARKET ANALYSIS BY PRODUCT
    59. MALAYSIA MARKET ANALYSIS BY BARRIER STRENGTH
    60. MALAYSIA MARKET ANALYSIS BY APPLICATION
    61. THAILAND MARKET ANALYSIS BY MATERIAL
    62. THAILAND MARKET ANALYSIS BY PRODUCT
    63. THAILAND MARKET ANALYSIS BY BARRIER STRENGTH
    64. THAILAND MARKET ANALYSIS BY APPLICATION
    65. INDONESIA MARKET ANALYSIS BY MATERIAL
    66. INDONESIA MARKET ANALYSIS BY PRODUCT
    67. INDONESIA MARKET ANALYSIS BY BARRIER STRENGTH
    68. INDONESIA MARKET ANALYSIS BY APPLICATION
    69. REST OF APAC MARKET ANALYSIS BY MATERIAL
    70. REST OF APAC MARKET ANALYSIS BY PRODUCT
    71. REST OF APAC MARKET ANALYSIS BY BARRIER STRENGTH
    72. REST OF APAC MARKET ANALYSIS BY APPLICATION
    73. SOUTH AMERICA MARKET ANALYSIS
    74. BRAZIL MARKET ANALYSIS BY MATERIAL
    75. BRAZIL MARKET ANALYSIS BY PRODUCT
    76. BRAZIL MARKET ANALYSIS BY BARRIER STRENGTH
    77. BRAZIL MARKET ANALYSIS BY APPLICATION
    78. MEXICO MARKET ANALYSIS BY MATERIAL
    79. MEXICO MARKET ANALYSIS BY PRODUCT
    80. MEXICO MARKET ANALYSIS BY BARRIER STRENGTH
    81. MEXICO MARKET ANALYSIS BY APPLICATION
    82. ARGENTINA MARKET ANALYSIS BY MATERIAL
    83. ARGENTINA MARKET ANALYSIS BY PRODUCT
    84. ARGENTINA MARKET ANALYSIS BY BARRIER STRENGTH
    85. ARGENTINA MARKET ANALYSIS BY APPLICATION
    86. REST OF SOUTH AMERICA MARKET ANALYSIS BY MATERIAL
    87. REST OF SOUTH AMERICA MARKET ANALYSIS BY PRODUCT
    88. REST OF SOUTH AMERICA MARKET ANALYSIS BY BARRIER STRENGTH
    89. REST OF SOUTH AMERICA MARKET ANALYSIS BY APPLICATION
    90. MEA MARKET ANALYSIS
    91. GCC COUNTRIES MARKET ANALYSIS BY MATERIAL
    92. GCC COUNTRIES MARKET ANALYSIS BY PRODUCT
    93. GCC COUNTRIES MARKET ANALYSIS BY BARRIER STRENGTH
    94. GCC COUNTRIES MARKET ANALYSIS BY APPLICATION
    95. SOUTH AFRICA MARKET ANALYSIS BY MATERIAL
    96. SOUTH AFRICA MARKET ANALYSIS BY PRODUCT
    97. SOUTH AFRICA MARKET ANALYSIS BY BARRIER STRENGTH
    98. SOUTH AFRICA MARKET ANALYSIS BY APPLICATION
    99. REST OF MEA MARKET ANALYSIS BY MATERIAL
    100. REST OF MEA MARKET ANALYSIS BY PRODUCT
    101. REST OF MEA MARKET ANALYSIS BY BARRIER STRENGTH
    102. REST OF MEA MARKET ANALYSIS BY APPLICATION
    103. KEY BUYING CRITERIA OF PACKAGING & TRANSPORT
    104. RESEARCH PROCESS OF MRFR
    105. DRO ANALYSIS OF PACKAGING & TRANSPORT
    106. DRIVERS IMPACT ANALYSIS: PACKAGING & TRANSPORT
    107. RESTRAINTS IMPACT ANALYSIS: PACKAGING & TRANSPORT
    108. SUPPLY / VALUE CHAIN: PACKAGING & TRANSPORT
    109. PACKAGING & TRANSPORT, BY MATERIAL, 2024 (% SHARE)
    110. PACKAGING & TRANSPORT, BY MATERIAL, 2024 TO 2035 (USD Billion)
    111. PACKAGING & TRANSPORT, BY PRODUCT, 2024 (% SHARE)
    112. PACKAGING & TRANSPORT, BY PRODUCT, 2024 TO 2035 (USD Billion)
    113. PACKAGING & TRANSPORT, BY BARRIER STRENGTH, 2024 (% SHARE)
    114. PACKAGING & TRANSPORT, BY BARRIER STRENGTH, 2024 TO 2035 (USD Billion)
    115. PACKAGING & TRANSPORT, BY APPLICATION, 2024 (% SHARE)
    116. PACKAGING & TRANSPORT, BY APPLICATION, 2024 TO 2035 (USD Billion)
    117. BENCHMARKING OF MAJOR COMPETITORS
  7. LIST OF TABLES
    1. LIST OF ASSUMPTIONS
    2. North America MARKET SIZE ESTIMATES; FORECAST
      1. BY MATERIAL, 2025-2035 (USD Billion)
      2. BY PRODUCT, 2025-2035 (USD Billion)
      3. BY BARRIER STRENGTH, 2025-2035 (USD Billion)
      4. BY APPLICATION, 2025-2035 (USD Billion)
    3. US MARKET SIZE ESTIMATES; FORECAST
      1. BY MATERIAL, 2025-2035 (USD Billion)
      2. BY PRODUCT, 2025-2035 (USD Billion)
      3. BY BARRIER STRENGTH, 2025-2035 (USD Billion)
      4. BY APPLICATION, 2025-2035 (USD Billion)
    4. Canada MARKET SIZE ESTIMATES; FORECAST
      1. BY MATERIAL, 2025-2035 (USD Billion)
      2. BY PRODUCT, 2025-2035 (USD Billion)
      3. BY BARRIER STRENGTH, 2025-2035 (USD Billion)
      4. BY APPLICATION, 2025-2035 (USD Billion)
    5. Europe MARKET SIZE ESTIMATES; FORECAST
      1. BY MATERIAL, 2025-2035 (USD Billion)
      2. BY PRODUCT, 2025-2035 (USD Billion)
      3. BY BARRIER STRENGTH, 2025-2035 (USD Billion)
      4. BY APPLICATION, 2025-2035 (USD Billion)
    6. Germany MARKET SIZE ESTIMATES; FORECAST
      1. BY MATERIAL, 2025-2035 (USD Billion)
      2. BY PRODUCT, 2025-2035 (USD Billion)
      3. BY BARRIER STRENGTH, 2025-2035 (USD Billion)
      4. BY APPLICATION, 2025-2035 (USD Billion)
    7. UK MARKET SIZE ESTIMATES; FORECAST
      1. BY MATERIAL, 2025-2035 (USD Billion)
      2. BY PRODUCT, 2025-2035 (USD Billion)
      3. BY BARRIER STRENGTH, 2025-2035 (USD Billion)
      4. BY APPLICATION, 2025-2035 (USD Billion)
    8. France MARKET SIZE ESTIMATES; FORECAST
      1. BY MATERIAL, 2025-2035 (USD Billion)
      2. BY PRODUCT, 2025-2035 (USD Billion)
      3. BY BARRIER STRENGTH, 2025-2035 (USD Billion)
      4. BY APPLICATION, 2025-2035 (USD Billion)
    9. Russia MARKET SIZE ESTIMATES; FORECAST
      1. BY MATERIAL, 2025-2035 (USD Billion)
      2. BY PRODUCT, 2025-2035 (USD Billion)
      3. BY BARRIER STRENGTH, 2025-2035 (USD Billion)
      4. BY APPLICATION, 2025-2035 (USD Billion)
    10. Italy MARKET SIZE ESTIMATES; FORECAST
      1. BY MATERIAL, 2025-2035 (USD Billion)
      2. BY PRODUCT, 2025-2035 (USD Billion)
      3. BY BARRIER STRENGTH, 2025-2035 (USD Billion)
      4. BY APPLICATION, 2025-2035 (USD Billion)
    11. Spain MARKET SIZE ESTIMATES; FORECAST
      1. BY MATERIAL, 2025-2035 (USD Billion)
      2. BY PRODUCT, 2025-2035 (USD Billion)
      3. BY BARRIER STRENGTH, 2025-2035 (USD Billion)
      4. BY APPLICATION, 2025-2035 (USD Billion)
    12. Rest of Europe MARKET SIZE ESTIMATES; FORECAST
      1. BY MATERIAL, 2025-2035 (USD Billion)
      2. BY PRODUCT, 2025-2035 (USD Billion)
      3. BY BARRIER STRENGTH, 2025-2035 (USD Billion)
      4. BY APPLICATION, 2025-2035 (USD Billion)
    13. APAC MARKET SIZE ESTIMATES; FORECAST
      1. BY MATERIAL, 2025-2035 (USD Billion)
      2. BY PRODUCT, 2025-2035 (USD Billion)
      3. BY BARRIER STRENGTH, 2025-2035 (USD Billion)
      4. BY APPLICATION, 2025-2035 (USD Billion)
    14. China MARKET SIZE ESTIMATES; FORECAST
      1. BY MATERIAL, 2025-2035 (USD Billion)
      2. BY PRODUCT, 2025-2035 (USD Billion)
      3. BY BARRIER STRENGTH, 2025-2035 (USD Billion)
      4. BY APPLICATION, 2025-2035 (USD Billion)
    15. India MARKET SIZE ESTIMATES; FORECAST
      1. BY MATERIAL, 2025-2035 (USD Billion)
      2. BY PRODUCT, 2025-2035 (USD Billion)
      3. BY BARRIER STRENGTH, 2025-2035 (USD Billion)
      4. BY APPLICATION, 2025-2035 (USD Billion)
    16. Japan MARKET SIZE ESTIMATES; FORECAST
      1. BY MATERIAL, 2025-2035 (USD Billion)
      2. BY PRODUCT, 2025-2035 (USD Billion)
      3. BY BARRIER STRENGTH, 2025-2035 (USD Billion)
      4. BY APPLICATION, 2025-2035 (USD Billion)
    17. South Korea MARKET SIZE ESTIMATES; FORECAST
      1. BY MATERIAL, 2025-2035 (USD Billion)
      2. BY PRODUCT, 2025-2035 (USD Billion)
      3. BY BARRIER STRENGTH, 2025-2035 (USD Billion)
      4. BY APPLICATION, 2025-2035 (USD Billion)
    18. Malaysia MARKET SIZE ESTIMATES; FORECAST
      1. BY MATERIAL, 2025-2035 (USD Billion)
      2. BY PRODUCT, 2025-2035 (USD Billion)
      3. BY BARRIER STRENGTH, 2025-2035 (USD Billion)
      4. BY APPLICATION, 2025-2035 (USD Billion)
    19. Thailand MARKET SIZE ESTIMATES; FORECAST
      1. BY MATERIAL, 2025-2035 (USD Billion)
      2. BY PRODUCT, 2025-2035 (USD Billion)
      3. BY BARRIER STRENGTH, 2025-2035 (USD Billion)
      4. BY APPLICATION, 2025-2035 (USD Billion)
    20. Indonesia MARKET SIZE ESTIMATES; FORECAST
      1. BY MATERIAL, 2025-2035 (USD Billion)
      2. BY PRODUCT, 2025-2035 (USD Billion)
      3. BY BARRIER STRENGTH, 2025-2035 (USD Billion)
      4. BY APPLICATION, 2025-2035 (USD Billion)
    21. Rest of APAC MARKET SIZE ESTIMATES; FORECAST
      1. BY MATERIAL, 2025-2035 (USD Billion)
      2. BY PRODUCT, 2025-2035 (USD Billion)
      3. BY BARRIER STRENGTH, 2025-2035 (USD Billion)
      4. BY APPLICATION, 2025-2035 (USD Billion)
    22. South America MARKET SIZE ESTIMATES; FORECAST
      1. BY MATERIAL, 2025-2035 (USD Billion)
      2. BY PRODUCT, 2025-2035 (USD Billion)
      3. BY BARRIER STRENGTH, 2025-2035 (USD Billion)
      4. BY APPLICATION, 2025-2035 (USD Billion)
    23. Brazil MARKET SIZE ESTIMATES; FORECAST
      1. BY MATERIAL, 2025-2035 (USD Billion)
      2. BY PRODUCT, 2025-2035 (USD Billion)
      3. BY BARRIER STRENGTH, 2025-2035 (USD Billion)
      4. BY APPLICATION, 2025-2035 (USD Billion)
    24. Mexico MARKET SIZE ESTIMATES; FORECAST
      1. BY MATERIAL, 2025-2035 (USD Billion)
      2. BY PRODUCT, 2025-2035 (USD Billion)
      3. BY BARRIER STRENGTH, 2025-2035 (USD Billion)
      4. BY APPLICATION, 2025-2035 (USD Billion)
    25. Argentina MARKET SIZE ESTIMATES; FORECAST
      1. BY MATERIAL, 2025-2035 (USD Billion)
      2. BY PRODUCT, 2025-2035 (USD Billion)
      3. BY BARRIER STRENGTH, 2025-2035 (USD Billion)
      4. BY APPLICATION, 2025-2035 (USD Billion)
    26. Rest of South America MARKET SIZE ESTIMATES; FORECAST
      1. BY MATERIAL, 2025-2035 (USD Billion)
      2. BY PRODUCT, 2025-2035 (USD Billion)
      3. BY BARRIER STRENGTH, 2025-2035 (USD Billion)
      4. BY APPLICATION, 2025-2035 (USD Billion)
    27. MEA MARKET SIZE ESTIMATES; FORECAST
      1. BY MATERIAL, 2025-2035 (USD Billion)
      2. BY PRODUCT, 2025-2035 (USD Billion)
      3. BY BARRIER STRENGTH, 2025-2035 (USD Billion)
      4. BY APPLICATION, 2025-2035 (USD Billion)
    28. GCC Countries MARKET SIZE ESTIMATES; FORECAST
      1. BY MATERIAL, 2025-2035 (USD Billion)
      2. BY PRODUCT, 2025-2035 (USD Billion)
      3. BY BARRIER STRENGTH, 2025-2035 (USD Billion)
      4. BY APPLICATION, 2025-2035 (USD Billion)
    29. South Africa MARKET SIZE ESTIMATES; FORECAST
      1. BY MATERIAL, 2025-2035 (USD Billion)
      2. BY PRODUCT, 2025-2035 (USD Billion)
      3. BY BARRIER STRENGTH, 2025-2035 (USD Billion)
      4. BY APPLICATION, 2025-2035 (USD Billion)
    30. Rest of MEA MARKET SIZE ESTIMATES; FORECAST
      1. BY MATERIAL, 2025-2035 (USD Billion)
      2. BY PRODUCT, 2025-2035 (USD Billion)
      3. BY BARRIER STRENGTH, 2025-2035 (USD Billion)
      4. BY APPLICATION, 2025-2035 (USD Billion)
    31. PRODUCT LAUNCH/PRODUCT DEVELOPMENT/APPROVAL
    32. ACQUISITION/PARTNERSHIP

Agricultural Packaging Market Segmentation

Market Segmentation Overview

  • Detailed segmentation data will be available in the full report
  • Comprehensive analysis by multiple parameters
  • Regional and country-level breakdowns
  • Market size forecasts by segment
Infographic

Free Sample Request

Kindly complete the form below to receive a free sample of this Report

Get Free Sample

Customer Strories

“I am very pleased with how market segments have been defined in a relevant way for my purposes (such as "Portable Freezers & refrigerators" and "last-mile"). In general the report is well structured. Thanks very much for your efforts.”

Victoria Milne

Founder

Compare Licence

×
Features License Type
Single User Multiuser License Enterprise User
Price $4,950 $5,950 $7,250
Maximum User Access Limit 1 User Upto 10 Users Unrestricted Access Throughout the Organization
Free Customization
Direct Access to Analyst
Deliverable Format
Platform Access
Discount on Next Purchase 10% 15% 15%
Printable Versions