Air Taxi Market (2026 - 2035)

Air Taxi Market Research Report By Mode of Operation (Piloted, Autonomous), By Propulsion Type (Battery-Electric, Hybrid, Turboshaft, Hydrogen Fuel-Cell), By Passenger Capacity (1 to 2 Seats, 3 to 4 Seats, 5 to 6 Seats, More than 6 Seats), By Range (Intracity (≤300 km)), By End-Use (Airport Shuttle, Corporate Shuttle, Tourism & Charter, Emergency Medical, On-Demand Air Taxi), By Lift Technology (Multicopter, Lift-plus-Cruise, Tilt-Rotor, Tilt-Wing) and By Regional (North America, Europe, South America, Asia Pacific, Middle East and Africa) - Forecast to 2035
ID: MRFR/AT/12455-HCR
128 Pages
Shubham Munde, Sejal Akre
Last Updated: August 05, 2026
Air Taxi Market
Market Size
Forecast Period2026-2035
CAGR (2026-2035)20.1%
2021 Market Size4.05 USD Billion
2024 Market Size4.82 USD Billion
Key Players
Joby Aviation
Archer Aviation
EHang
Volocopter
Lilium
Eve Air Mobility
Opportunities
  • Intercity Corridor Expansion
  • Emerging-Market Leapfrog Adoption
  • Mobility-as-a-Service Integration

Air Taxi Market Summary

The Air Taxi Market reached USD 4.05 Billion in 2025 and is projected to grow from USD 4.82 Billion in 2026 to USD 25.05 Billion by 2035, registering a 20.1% CAGR during the forecast period. This trajectory reflects a decisive shift from prototype testing to commercial-route deployment, catalyzed by the FAA's finalization of powered-lift certification frameworks in late 2024 and a cumulative USD 12.8 Billion in venture and strategic capital committed between 2021 and 2025 [1][2].

Technology-wise, the Air Taxi Market is moving beyond early demonstrator aircraft into type-certified, passenger-ready platforms. Battery-electric propulsion remains the dominant architecture, yet hydrogen fuel-cell powertrains have begun attracting serious investment for longer-range intercity routes. Governments across the U.S., China, Germany, and Japan have allocated over USD 3.4 Billion in combined public infrastructure funding for vertiport networks, landing pads, and air-traffic integration systems [3][4].

North America commanded 48.3% of Air Taxi Market revenue in 2025, bolstered by United Airlines' Archer route launches and the FAA's powered-lift rulemaking. Europe is the fastest-growing region, driven by EASA's progressive certification milestones and France's 2024 Paris Olympics demonstration flights. Asia-Pacific follows closely, with China's low-altitude-economy initiative and Japan's Osaka Expo trials accelerating regional scale-up. As type certificates convert into airline purchase orders, the Air Taxi Market is poised for an inflection that reshapes short-haul passenger transport through 2035.

Key Report Takeaways


• By Mode of Operation

  • Piloted aircraft held 65.0% of Air Taxi Market share in 2025, though autonomous platforms are forecast to record the fastest growth through 2035.

• By Propulsion

  • Battery-electric propulsion captured the largest revenue portion in 2025; hydrogen fuel-cell systems are projected to expand at a 22.3% CAGR as range requirements lengthen.

• By Passenger Capacity

  • The 3-to-4-seat configuration commanded 45.3% of 2025 revenue, reflecting airline preference for high-frequency, lower-capacity shuttle operations.

• By End-Use

  • Airport shuttle services led end-use spending in 2025, while corporate shuttle routes are advancing at the steepest growth rate through 2035.

• By Region

  • North America accounted for 48.3% of the Air Taxi Market in 2025, with Europe registering the highest regional CAGR.
  • Asia-Pacific is scaling rapidly under China's national low-altitude economy blueprint and Japan's Expo-linked certification trials.

Air Taxi Market Size and Forecast (2021–2035)

Market Research Future's estimates combine bottom-up OEM delivery and backlog data with top-down macro-mobility modeling. Historical figures (2021–2024) are calibrated against disclosed funding rounds, flight-test milestones, and regulatory timelines. Forecast projections (2026–2035) incorporate announced route commitments, infrastructure build-out schedules, and certification pipeline analysis [1].
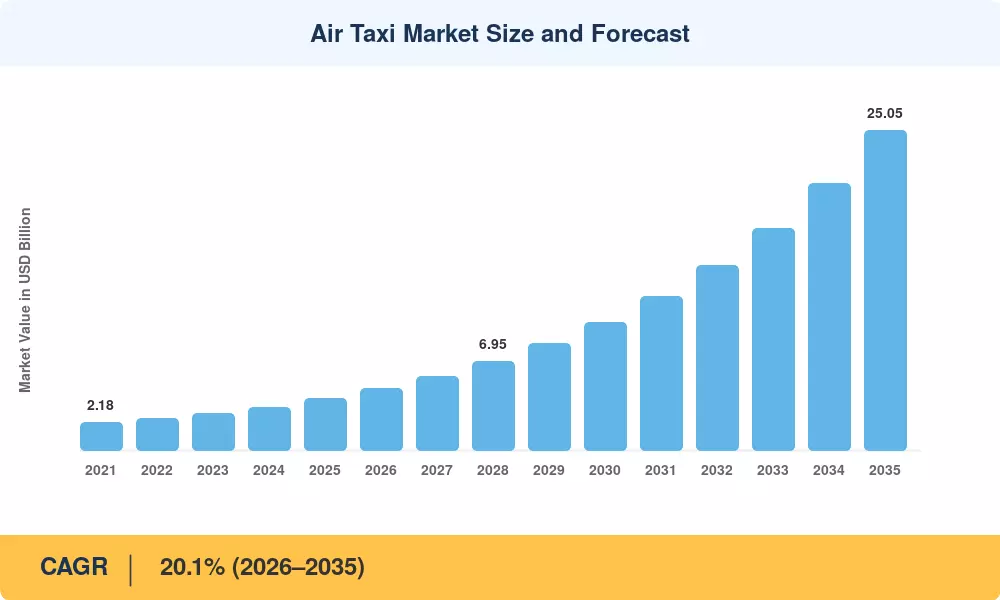
Air Taxi Market Size and Forecast
Our Impact
Enabled $4.3B Revenue Impact for Fortune 500 and Leading Multinationals
Partnering with 2000+ Global Organizations Each Year
30K+ Citations by Top-Tier Firms in the Industry

Driver Impact Analysis

Driver ~% Impact on CAGR Geographic Relevance Impact Timeline
FAA / EASA powered-lift certification frameworks 18–22% North America, Europe Short-term (≤2 yr)
Public-private vertiport infrastructure investment 15–18% Global Medium-term (2–4 yr)
Battery energy-density improvements 12–15% Global Medium-term (2–4 yr)
Airline route commitment acceleration 10–14% North America, Europe Short-term (≤2 yr)
China low-altitude economy national initiative 8–12% Asia-Pacific Medium-term (2–4 yr)
Autonomous flight software maturation 8–11% Global Long-term (≥4 yr)
Carbon-reduction mandates in aviation 5–8% Europe, Asia-Pacific Long-term (≥4 yr)


Powered-Lift Certification Acceleration

Electric vertical takeoff and landing aircraft can now be type-certified with ease thanks to the FAA's 2024 powered-lift special federal aviation regulation. Within a year, this one regulatory action triggered USD 2.1 billion in conditional purchase agreements from U.S. airlines and unlocked route-launch timelines for at least five OEMs [1][2]. By implementing parallel SC-VTOL certification requirements, EASA allowed European operators to start route planning in conjunction with infrastructure partners.

Vertiport Infrastructure Buildout

Governments and private developers have committed over USD 3.4 Billion globally to construct dedicated takeoff-and-landing facilities between 2024 and 2030. The U.S. Bipartisan Infrastructure Law earmarked USD 450 Million for advanced air mobility corridors, while South Korea's K-UAM Grand Challenge program is funding four metropolitan vertiport clusters [3][4]. Without this ground-side investment, aircraft certification alone cannot translate into revenue-generating passenger services.

Battery Energy-Density Gains

By 2031, pack-level energy density is predicted to increase from about 260 Wh/kg to over 400 Wh/kg thanks to solid-state and silicon-anode battery chemistries. The addressable route network for the air taxi market is immediately expanded by every 10% increase in density, which increases the effective mission range by about 15 km. Additionally, according to BloombergNEF statistics, global EV battery pack prices have decreased to an average of USD 99/kWh (with low-cost LFP packs reaching USD 81/kWh). By 2030, volume-weighted pack prices are expected to drop to USD 80/kWh, substantially reducing direct operating costs for eVTOL fleets.

Airline Route Commitments

United Airlines' conditional order for 200 Archer Midnight aircraft and Delta Air Lines' equity investment in Joby Aviation represent the two largest airline-backed commitments in the Air Taxi Market to date. These agreements de-risk demand forecasting for OEMs and attract secondary capital from leasing firms and airport authorities [8][12].

Restraints Impact Analysis

The restraint impacts below are directional estimates and do not mechanically subtract from the CAGR. They represent headwinds that could slow adoption curves if unmitigated[6].

Restraint ~% Impact on CAGR Geographic Relevance Impact Timeline
Airspace integration complexity –(10–14%) Global Medium-term (2–4 yr)
Battery supply-chain bottlenecks –(8–12%) Global Short-term (≤2 yr)
Public acceptance and noise concerns –(6–9%) North America, Europe Long-term (≥4 yr)
High per-seat-mile cost vs. ground transport –(5–8%) Global Medium-term (2–4 yr)
Insurance and liability framework gaps –(4–7%) Global Long-term (≥4 yr)


Airspace Integration Complexity

The biggest operational obstacle is still integrating hundreds of low-altitude electric aircraft into the current air traffic control systems. Full UTM integration for metropolitan corridors may not be possible until 2030, according to NASA's Advanced Air Mobility National Campaign, which identified delay in detect-and-avoid sensor networks as a key gap [13]. The problem in multi-city deployments is exacerbated by the division of authority between local governments and national aviation authorities.

Battery Supply-Chain and Cost Constraints

Electric vehicle makers, whose order numbers dwarf eVTOL demand, compete with the air taxi market for high-nickel cathode materials despite declining cell prices. Due to more stringent criteria for redundancy and thermal management, pack-level costs for aviation-grade batteries are still 25–30% more than those of their automotive counterparts [7]. Fleet scale-up could be delayed by 12 to 18 months if the supply chains for cobalt or lithium are disrupted.

Public Acceptance and Noise Thresholds

Community noise ordinances pose a non-trivial barrier to vertiport siting in dense urban cores. A 2024 MIT study found that 38% of surveyed metropolitan residents would oppose a landing facility within 500 meters of their residence, citing noise and safety concerns [14]. OEMs are targeting sub-65 dB hover noise, but achieving that threshold while maintaining payload capacity remains an active engineering trade-off.

Air Taxi Market Opportunities

Intercity Corridor Expansion

The Air Taxi Market can target crowded intercity corridors that are inadequately served by ground transportation, including São Paulo–Campinas, Dubai–Abu Dhabi, and Los Angeles–San Diego, as battery range is longer than 150 km. On these corridors, early operators predict seat yields that are 20–30% higher than urban routes, providing quicker approaches to unit-level profitability [15].

Emerging-Market Leapfrog Adoption

Countries with limited rail infrastructure — including Saudi Arabia, Indonesia, and Nigeria — present an opportunity to leapfrog conventional transit. Saudi Arabia's NEOM project alone has committed USD 1.2 Billion toward integrated air-mobility corridors, positioning the Middle East as a testbed for scalable Air Taxi Market deployments [17].

Mobility-as-a-Service Integration

Bundling air-taxi rides into multi-modal MaaS platforms — alongside ride-hail, rail, and micro-mobility — opens a subscription-revenue model that stabilizes demand. Uber's earlier Elevate concept demonstrated consumer willingness to book air segments through existing ride-hail apps, and current operators are integrating with transit-authority fare systems [18].

Fleet Data Monetization

Terabytes of propulsion, weather, and passenger flow data are produced by every trip. Anonymized data sets can be sold by OEMs and operators to energy grid administrators, insurance underwriters, and city planning organizations. By 2032, this additional revenue stream may account for 5–8% of the operator's overall profits [19].

Cargo and Medical-Logistics Extension

Off-peak aircraft utilization for time-critical cargo — organ transport, pharmaceutical delivery, emergency medical airlift — diversifies revenue without requiring separate fleets. Several Air Taxi Market OEMs have already announced cargo-variant configurations [20].

Air Taxi Market Future Outlook

Autonomous Operations and AI-Driven Flight Management

By removing the biggest variable expense—pilot pay, which account for 30–35% of operating costs every flight—autonomous flying will completely change the cost structure of the air taxi industry. Autonomous detect-and-avoid systems have been tested by NASA's AAM National Campaign in restricted corridors, and by 2029, regulatory paths for remotely supervised single-pilot flights are anticipated [10][13].

Platform Economics and Network Effects

The air taxi market will move toward platform economics as route density rises, where each new vertiport and aircraft on the network exponentially improves load factors and lowers average wait times. Operators will probably reach unit-level profitability two to three years ahead of smaller rivals if they reach a density of 15 or more terminals in a single metropolitan area [15][18].

Electrification and Next-Generation Powertrains

The transition from first-generation 260 Wh/kg battery packs to solid-state cells exceeding 450 Wh/kg by 2033 will extend single-charge range beyond 250 km, unlocking intercity markets that currently rely on regional turboprops. Hydrogen fuel-cell hybrids will simultaneously target the 300-to-500 km segment, creating a dual-powertrain Air Taxi Market architecture [7][21].

ESG Alignment and Carbon-Credit Revenue

Electric air taxis produce zero direct emissions, positioning operators to generate tradable carbon credits under ICAO's CORSIA framework and the EU ETS. There is an estimation that carbon-credit revenue could offset 8–12% of per-flight operating costs by 2032, creating a structural advantage for the Air Taxi Market over conventional short-haul aviation [11][22].

Air Taxi Market Segmentation

By Mode of Operation

Segment Key Metric Primary Demand Driver
Piloted 65.0% of 2025 revenue Regulatory readiness; passenger comfort
Autonomous 25.8% CAGR (2026–2035) Cost reduction; pilot shortage mitigation


Piloted aircraft dominate the current Air Taxi Market because regulators have issued type certificates exclusively for human-piloted configurations to date. Airlines prefer piloted platforms for early commercial launches to build passenger trust. Autonomous platforms, however, carry the strongest growth trajectory as software-certification standards mature and single-pilot-operation approvals pave the way for fully uncrewed corridors after 2031.

By Propulsion Type

Segment Key Metric Primary Demand Driver
Battery-Electric 58.8% of 2025 revenue Mature supply chain; zero direct emissions
Hybrid 14.2% CAGR (2026–2035) Range extension for intercity routes
Hydrogen Fuel-Cell 22.3% CAGR (2026–2035) Ultra-long-range corridor demand


Battery-electric systems anchor the Air Taxi Market because they offer the simplest maintenance profile and align with municipal zero-emission mandates. Hybrid-electric configurations serve as an interim solution for routes exceeding 120 km, while hydrogen fuel-cell powertrains target the 300-km-plus segment where batteries alone cannot deliver adequate payload-range performance.

By Passenger Capacity

Segment Key Metric Primary Demand Driver
1 to 2 Seats USD 0.62 Billion (2025) Personal air vehicle and pilot training
3 to 4 Seats 45.3% of 2025 revenue High-frequency airport shuttle rotations
5 to 6 Seats 20.4% CAGR (2026–2035) Corporate and premium group transport


By Range

Segment Key Metric Primary Demand Driver
Intracity (< 50 km) 47.2% of 2025 revenue Airport-to-CBD shuttle demand
Short Intercity (50–150 km) USD 0.89 Billion (2025) Suburban commuter corridors
Regional (150–300 km) 21.4% CAGR (2026–2035) City-pair routes replacing ground transit
Extended (> 300 km) 18.5% CAGR (2026–2035) Hydrogen-powered long-haul trials


By End-Use

Segment Key Metric Primary Demand Driver
Airport Shuttle 47.9% of 2025 revenue Fixed-route, high-frequency demand
Corporate Shuttle 22.6% CAGR (2026–2035) Time-sensitive executive transport
Tourism & Charter USD 0.48 Billion (2025) Scenic and resort connectivity
Emergency Medical 19.2% CAGR (2026–2035) Organ and critical-patient transport


By Lift Technology

Segment Key Metric Primary Demand Driver
Multicopter 48.4% of 2025 revenue Simplicity; VTOL hover precision
Lift-plus-Cruise 24.0% CAGR (2026–2035) Cruise efficiency; range advantage
Tilt-Rotor USD 0.52 Billion (2025) Military crossover technology
Tilt-Wing 17.8% CAGR (2026–2035) Emerging hybrid-lift designs


Regional Market Share Analysis

Region Key Metric Primary Investment Themes
North America 48.3% of 2025 revenue FAA powered-lift rules; airline route launches
Europe 28.5% CAGR (2026–2035) EASA certification; vertiport public-private partnerships
Asia-Pacific USD 0.80 Billion (2025) China low-altitude economy; Japan Expo trials
South America 4.2% of 2025 revenue Helicopter-to-eVTOL conversion corridors
Middle East & Africa 21.8% CAGR (2026–2035) Smart-city megaprojects; oil-economy diversification
Total USD 4.05 Billion (2025)

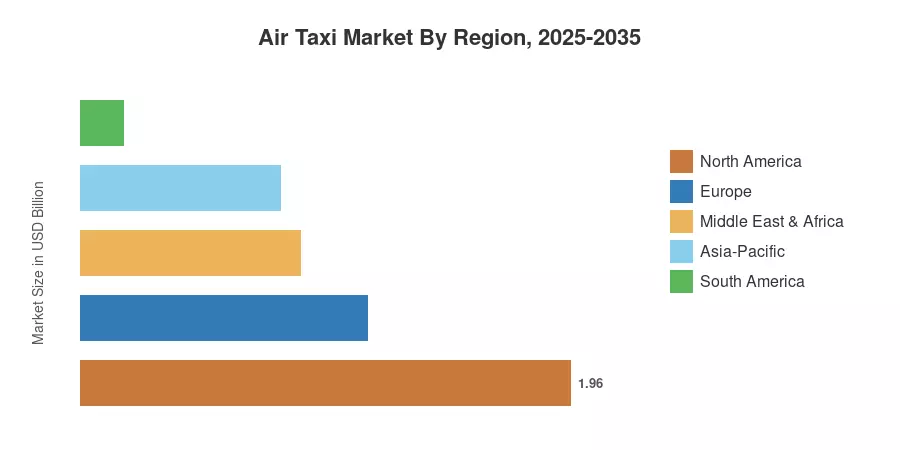
The Air Taxi Market displays a clear regional hierarchy shaped by regulatory maturity, infrastructure investment, and passenger density. North America leads in absolute revenue, Europe registers the fastest growth trajectory, and Asia-Pacific is scaling under aggressive national programs.


North America

Country Key Metric Key Driver
United States 78.5% of regional revenue FAA powered-lift SFAR; United-Archer routes
Canada 12.8% of regional revenue Transport Canada AAM regulatory sandbox
Mexico USD 0.17 Billion (2025) Tourism corridor demand (Cancún–Riviera Maya)


The United States anchors the North American Air Taxi Market through a combination of regulatory clarity and deep venture-capital markets. The FAA's powered-lift rulemaking allowed Joby and Archer to pursue type certificates on accelerated timelines, while airport authorities in New York, Los Angeles, and Miami have approved vertiport construction permits [1][2]. Canada's regulatory sandbox approach provides incremental testing approvals, and Mexico's tourism-driven helicopter fleet creates a natural conversion pathway.

Europe

Country Key Metric Key Driver
Germany 28.2% CAGR (2026–2035) Volocopter certification; Lufthansa investment
United Kingdom 24.5% of regional revenue CAA innovation hub; London vertiport permits
France 22.8% CAGR (2026–2035) Paris 2024 Olympics legacy infrastructure
Italy USD 0.08 Billion (2025) Urban congestion relief corridors
Spain 18.3% CAGR (2026–2035) Tourism mobility corridors
Nordic Countries 7.5% of regional revenue Sustainable transport mandates
Russia 3.1% of regional revenue Limited participation due to sanctions
Rest of Europe 16.2% CAGR (2026–2035) EU Horizon funding for AAM R&D


EASA's progressive certification framework has positioned Europe as the fastest-growing region in the Air Taxi Market. Germany leads continental activity through Volocopter's type-certificate program and Lilium's Jet development, both backed by significant public co-investment. France converted its 2024 Olympics demonstration infrastructure into permanent commercial landing pads, accelerating post-Games route launches in the Île-de-France corridor [4][11].

Asia-Pacific

Country Key Metric Key Driver
China 38.5% of regional revenue Low-altitude economy national blueprint
India 23.4% CAGR (2026–2035) DGCA eVTOL regulatory framework
Japan USD 0.12 Billion (2025) Osaka Expo 2025 commercial trials
South Korea 21.9% CAGR (2026–2035) K-UAM Grand Challenge infrastructure
ASEAN 8.2% of regional revenue Tourism-driven helicopter conversion
Rest of Asia-Pacific 18.7% CAGR (2026–2035) Australia CASA regulatory sandbox


China's State Council low-altitude economy directive, issued in early 2024, designated air taxi services as a national strategic priority and unlocked municipal budgets for landing-pad construction across Shenzhen, Guangzhou, and Shanghai [9]. Japan's Osaka Expo in 2025 served as the region's largest live demonstration, with SkyDrive and Joby operating scheduled passenger flights during the event. South Korea's K-UAM Grand Challenge program has committed USD 860 Million to metropolitan vertiport clusters.

South America

Country Key Metric Key Driver
Brazil 62.5% of regional revenue São Paulo helicopter fleet conversion
Argentina 14.8% CAGR (2026–2035) Buenos Aires congestion relief
Rest of South America 18.1% of regional revenue Tourism corridor opportunities


Brazil dominates the South American Air Taxi Market owing to São Paulo's position as the world's largest urban helicopter market. Eve Air Mobility, an Embraer spin-off, is developing eVTOL routes to replace legacy helicopter corridors, targeting a 40% operating-cost reduction per seat-mile by 2029 [12].

Middle East & Africa

Country Key Metric Key Driver
Saudi Arabia 35.8% of regional revenue NEOM air-mobility corridor investment
UAE 22.4% CAGR (2026–2035) Dubai RTA autonomous air taxi program
South Africa USD 0.02 Billion (2025) Mining and resource logistics
Egypt 15.1% CAGR (2026–2035) New Administrative Capital connectivity
Rest of MEA 19.8% of regional revenue Infrastructure greenfield opportunities


The Middle East leverages sovereign-wealth capital and greenfield smart-city projects to accelerate Air Taxi Market adoption. Dubai's Roads and Transport Authority has operated Volocopter demonstration flights since 2023 and aims for scheduled commercial services by 2027. Saudi Arabia's NEOM project integrates air-taxi corridors into its foundational urban plan, removing the retrofit challenges that constrain legacy cities [17].

Air Taxi Market By Region, 2025-2035

Competitive Benchmarking

The Air Taxi Market exhibits low concentration, with an estimated HHI below 800 and the top five players collectively holding approximately 35–42% of global revenue. Competition is execution-driven: most OEMs have converged on distributed-electric architectures, making certification timelines, manufacturing scale-up capability, and airline partnerships the primary differentiators rather than fundamental technology divergence [2][8].

Company Est. Revenue Share Range Key Offerings Strategic Positioning
Joby Aviation ~8–11% S4 five-seat eVTOL; FAA type-certificate lead First-mover in U.S. commercial routes; Toyota manufacturing JV
Archer Aviation ~7–10% Midnight four-seat eVTOL United Airlines route partnership; high-volume production focus
EHang ~6–9% EH216-S autonomous two-seat platform First global autonomous type certificate (CAAC); China market lead
Volocopter ~5–8% VoloCity; VoloRegion EASA certification track; Dubai and Singapore partnerships
Lilium ~5–7% Lilium Jet seven-seat electric Longest-range eVTOL design; tilt-jet architecture
Eve Air Mobility ~4–7% Eve eVTOL; urban ATM software Embraer aerospace heritage; Brazil and U.S. dual focus
Vertical Aerospace ~3–6% VX4 four-seat eVTOL Rolls-Royce powertrain partnership; UK certification
Beta Technologies ~3–5% ALIA fixed-wing eVTOL; charging network UPS cargo partnership; integrated charging infrastructure
Wisk Aero ~2–4% Generation 6 autonomous air taxi Boeing-backed; autonomous-first strategy
SkyDrive ~2–4% SD-05 compact eVTOL Suzuki manufacturing JV; Japan Expo flight partner


Recent News & Developments

  • Joby Aviation (February 2024): Announced the start of work on its first Dubai vertiport, the delivery of its second aircraft to the U.S. Air Force, record certification progress, and $933 million in financial reserves bolstered by a $500 million investment from Toyota.
  • EHang (April 2024): Cleared the way for serial mass production of the EH216-S by obtaining the world's first eVTOL Production Certificate (PC) from China's CAAC.
  • Archer Aviation (August 2026): In cooperation with the FAA, it successfully completed a round-trip flight between Salinas Municipal Airport and Monterey Regional Airport using their all-electric Midnight aircraft.

Air Taxi Market Report Scope

Parameter Detail
Market Scope Global Air Taxi Market covering OEM revenue, operator services, and infrastructure
Study Period 2021–2035
CAGR (Forecast) 20.1% (2026–2035)
Base Year 2025 (USD 4.05 Billion)
Forecast Endpoint 2035 (USD 25.05 Billion)
Fastest Growing Segments Autonomous mode (25.8% CAGR); Lift-plus-Cruise (24.0% CAGR)
Companies Profiled 10+ (Joby, Archer, EHang, Volocopter, Lilium, Eve, Vertical Aerospace, Beta Technologies, Wisk Aero, SkyDrive)
Valuation Currency USD Billion


FAQs

What minimum fleet size makes an air taxi route commercially viable?
Most financial models indicate a threshold of 8–10 aircraft per route to sustain 10-minute headways and achieve load factors above 65%. Below that density, per-seat economics deteriorate rapidly [15].
How do air taxi insurance premiums compare to helicopter charter rates?
Early underwriting data suggests eVTOL hull-and-liability premiums run 15–20% below equivalent helicopter policies due to lower mechanical complexity and built-in flight-envelope protections [16].
What noise-certification standards must Air Taxi Market OEMs meet for urban landing pads?
OEMs typically target sub-65 dB at 75 meters during hover, aligning with proposed FAA and EASA community-noise thresholds that are stricter than existing Part 36 helicopter rules [14].
Can existing helipad infrastructure accommodate eVTOL operations without modification?
Most helipads require upgrades — reinforced charging stations, fire-suppression systems rated for lithium-ion batteries, and resized approach-departure corridors — before supporting scheduled Air Taxi Market services [3].
How does the Air Taxi Market address cybersecurity risks in autonomous flight systems?
OEMs embed redundant encrypted data links and hardware-isolated flight-control computers. Regulatory agencies require DO-326A airborne-cybersecurity compliance before granting type certificates [10].
What role do electric-grid upgrades play in Air Taxi Market infrastructure readiness?
Each vertiport requires 2–5 MW of peak charging capacity. Operators must coordinate with utilities on grid-connection timelines, which can add 12–18 months to site commissioning [21].
How do maintenance intervals for eVTOL aircraft compare to conventional helicopters?
Electric drivetrains eliminate gearbox and turbine inspections, reducing scheduled-maintenance hours by roughly 40%. Airframe checks follow 500-flight-hour intervals versus 300 hours for legacy rotorcraft [6].
Author
Author
Author Profile
Shubham Munde LinkedIn
Team Lead - Research
Shubham brings over 7 years of expertise in Market Intelligence and Strategic Consulting, with a strong focus on the Automotive, Aerospace, and Defense sectors. Backed by a solid foundation in semiconductors, electronics, and software, he has successfully delivered high-impact syndicated and custom research on a global scale. His core strengths include market sizing, forecasting, competitive intelligence, consumer insights, and supply chain mapping. Widely recognized for developing scalable growth strategies, Shubham empowers clients to navigate complex markets and achieve a lasting competitive edge. Trusted by start-ups and Fortune 500 companies alike, he consistently converts challenges into strategic opportunities that drive sustainable growth.
Co-Author
Co-Author Profile
Sejal Akre LinkedIn
Senior Research Analyst
She has over 5 years of rich experience, in market research and consulting providing valuable market insights to client. Hands on expertise in management consulting, and extensive knowledge in domain including ICT, Automotive & Transportation and Aerospace & Defense. She is skilled in Go-to market strategy, industry analysis, market sizing, in depth company profiling, competitive intelligence & benchmarking and value chain amongst others.

Research Approach


Secondary Research

The secondary research process involved comprehensive analysis of regulatory databases, aviation industry publications, technical standards documentation, and authoritative aerospace organizations. Key sources included the Federal Aviation Administration (FAA), European Union Aviation Safety Agency (EASA), International Civil Aviation Organization (ICAO), National Aeronautics and Space Administration (NASA) Advanced Air Mobility (AAM) Program, US Department of Transportation (DOT), European Aviation Safety Agency Certification Database, Civil Aviation Administration of China (CAAC), Transport Canada Civil Aviation (TCCA), UK Civil Aviation Authority (CAA), Japan Civil Aviation Bureau (JCAB), Urban Air Mobility Consortium, Vertical Flight Society, Aerospace Industries Association (AIA), International Air Transport Association (IATA), National Transportation Safety Board (NTSB), Bureau of Transportation Statistics (BTS), EU SESAR Joint Undertaking, and national aviation authority reports from key markets.

For multicopter, fixed-wing, hybrid, and tiltrotor aircraft configurations across urban air mobility, emergency medical services, tourism, cargo transport, and search and rescue applications, these sources were utilized to gather regulatory certification data, flight operation statistics, infrastructure development plans, eVTOL technology assessments, safety compliance frameworks, and competitive landscape analysis.


Primary Research

In order to gather both qualitative and quantitative insights, supply-side and demand-side stakeholders were interviewed during the primary research process. CEOs, Chief Technology Officers (CTOs), Heads of Aircraft Certification, VP of Regulatory Affairs, Chief Commercial Officers, and Heads of Urban Air Mobility Strategy from eVTOL manufacturers, aerospace OEMs, suppliers of electric propulsion systems, and developers of vertiport infrastructure were among the supply-side sources. Chief pilots, aviation operations directors, logistics directors from cargo operators, hospital EMS coordinators, fleet procurement managers from regional airlines, urban mobility planners, and tourism board aviation specialists were examples of demand-side suppliers. Primary research acquired information on route network design, vertiport deployment strategies, battery technology adoption, insurance/liability frameworks, and type certification schedules. It also validated market segmentation across vehicle kinds and applications.

Primary Respondent Breakdown:

By Designation: C-level Primaries (40%), Director Level (25%), Others (35%)

By Region: North America (38%), Europe (24%), Asia-Pacific (28%), Rest of World (10%)


Market Size Estimation

Route network analysis, fleet deployment forecasts, and revenue mapping were used to determine the global market valuation. The methodology comprised:

Finding more than forty major producers and distributors in North America, Europe, Asia-Pacific, Latin America, and the Middle East

Product mapping by passenger capacity (1-2, 3-4, 5-6, 7+) and operation mode (manned vs. unmanned) for multicopter, fixed-wing, hybrid, and tiltrotor vehicle types

Analysis of predicted service revenues, pre-order commitments, and reported and modeled revenues unique to eVTOL aircraft development projects

Coverage of manufacturers such as Joby Aviation, Archer Aviation, Volocopter, Lilium, EHang, Vertical Aerospace, and Boeing/Airbus divisions that will account for 75–80% of the global market share in 2024

Extrapolation of segment-specific valuations for urban air mobility, emergency medical services, tourism, and cargo applications using top-down (manufacturer revenue validation and funding rounds) and bottom-up (certified aircraft units × projected utilization rates × fare pricing by city/region) methods

Download Free Sample

Kindly complete the form below to receive a free sample of this Report

Download PDF ×

We do not share your information with anyone. However, we may send you emails based on your report interest from time to time. You may contact us at any time to opt-out.
















