Aircraft Seating Market (2025 - 2035)

Aircraft Seating Market Size, Share, Industry Trend & Analysis Research Report By Aircraft Type (Narrow-Body, Wide-Body, Regional Jet, Turboprop), By Cabin Class (Economy, Premium Economy, Business, First), By Seat Type (Standard Fixed-Back, Recliner, Lie-Flat, Suite/Full-Privacy), By Fitment (Line-Fit, Retrofit), By Geography (North America, South America, Europe, Asia-Pacific, Middle East & Africa) - Forecast to 2035
ID: MRFR/AD/0767-CR
200 Pages
Shubham Munde, Sejal Akre
Last Updated: August 24, 2026
Aircraft Seating Market
Market Size
Forecast Period2025-2035
CAGR (2025-2035)6.55%
2025 Market SizeUSD 3.91 Billion
2026 Market SizeUSD 4.14 Billion
2035 Market SizeUSD 7.33 Billion
Key Players
Safran Seats
Collins Aerospace
Recaro Aircraft Seating
Adient Aerospace
Jamco Corporation
Thompson Aero Seating
Opportunities
  • Densification Engineering for Low-Cost Carriers
  • Retrofit-as-a-Service Business Models
  • Seat-Embedded Data Monetisation

Aircraft Seating Market Summary

The Aircraft Seating Market was valued at USD 3.91 billion in 2025 and opens the forecast window at USD 4.14 billion in 2026, climbing to USD 7.33 billion by 2035 at a 6.55% CAGR. Two catalysts anchor that trajectory. Airbus and Boeing together carry a combined commercial backlog exceeding 14,000 aircraft, each one requiring a certified seating package before delivery [1]. Alongside that, ICAO's CORSIA offsetting phase — now binding on more than 120 states — has pushed carriers to treat every kilogram of cabin furniture as a fuel-burn line item rather than a fixed cost [7].

Cabin hardware is quietly changing shape. Heavy aluminium sub-frames and fixed-back economy shells are giving way to carbon-composite spars, thermoplastic cushion carriers, and slimline backrests that recover two to three inches of living space per row without adding pitch. Safran, Collins Aerospace, and Recaro have collectively committed over USD 800 million since 2023 to composite tooling, certification test rigs, and automated upholstery lines [3][5][8]. The result is a seat that weighs 20–30% less than its 2015 equivalent while carrying more electronics.

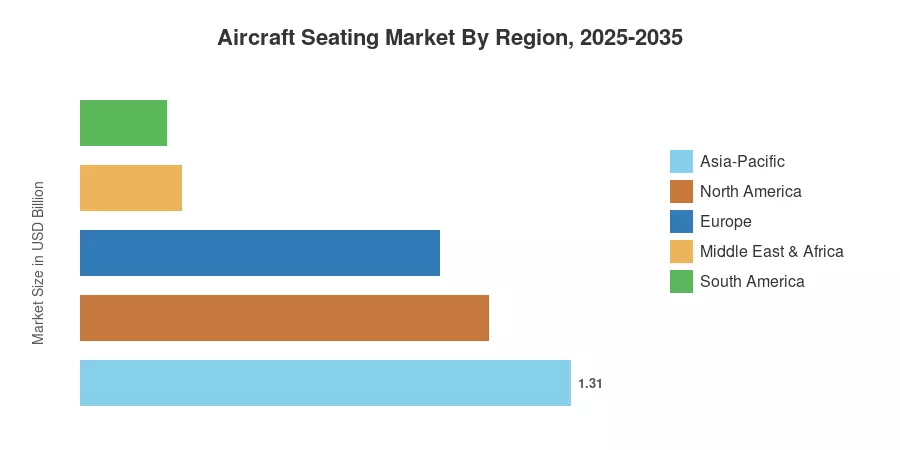
Regionally, Asia-Pacific holds 33.5% of the Aircraft Seating Market and simultaneously posts the fastest expansion at a 7.18% CAGR, propelled by Chinese and Indian narrow-body inductions. North America follows with USD 1.09 billion in 2025 revenue, sustained less by new deliveries than by refresh programmes across ageing A320ceo and 737NG fleets. Europe ranks third on the strength of Airbus line-fit volumes out of Hamburg and Toulouse. Through 2035, the Aircraft Seating Market will reward suppliers who can certify quickly, not merely design elegantly.


Key Report Takeaways

• By Aircraft Type

  • Narrow-body platforms commanded 47.4% of Aircraft Seating Market revenue in 2025, reflecting single-aisle dominance in global fleet plans
  • Regional jets are advancing at a 6.64% CAGR through 2035 as sub-100-seat replacement cycles restart in North America

• By Cabin Class

  • Economy cabins accounted for 44.3% of 2025 revenue, the largest single class pool in the Aircraft Seating Market
  • Premium economy is the growth outlier at a 7.40% CAGR, now a deliberate yield instrument rather than an upgrade zone
  • Business class contributed USD 1.09 billion in 2025

• By Seat Type

  • Recliner products captured 34.5% share in 2025
  • Suite and full-privacy seating leads all product categories at an 8.78% CAGR


• By Fitment


  • Line-fit installations represented 59.7% of installed value in 2025

• By Region

Market Size and Forecast (2021–2035)

Figures below blend OEM delivery data, seat-count assumptions by variant and cabin configuration, published supplier segment revenue, and airline capital expenditure disclosures. Historical years were reconciled against traffic recovery curves published by IATA, then cross-checked against shipset pricing bands observed in supplier filings [2][4][8]. The Aircraft Seating Market forecast assumes no structural disruption to twin-aisle production rates after 2027.
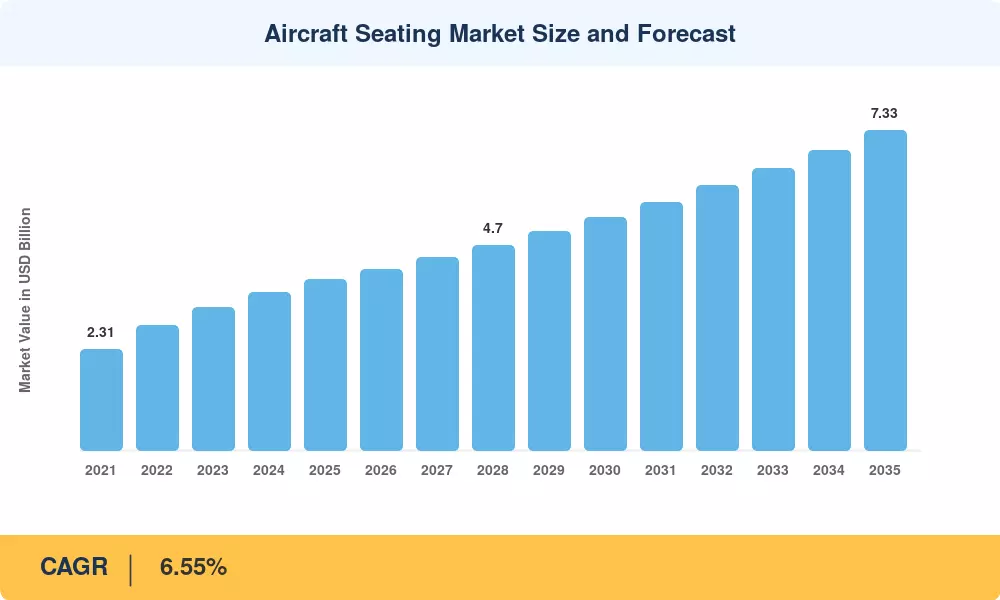
Aircraft Seating Market Size and Forecast
Our Impact
Enabled $4.3B Revenue Impact for Fortune 500 and Leading Multinationals
Partnering with 2000+ Global Organizations Each Year
30K+ Citations by Top-Tier Firms in the Industry

Driver Impact Analysis

Driver ~% Impact on CAGR Geographic Relevance Impact Timeline
Record single-aisle order backlogs +1.4 pp Global Long-term (≥4 yr)
Premium economy monetisation +1.1 pp APAC, Europe, MEA Medium-term (2–4 yr)
Weight reduction tied to fuel burn and CORSIA +0.9 pp Global Long-term (≥4 yr)
Refresh cycles on ageing A320ceo / 737NG fleets +0.8 pp North America, Europe Short-term (≤2 yr)
Low-cost carrier densification +0.7 pp Asia-Pacific Medium-term (2–4 yr)
In-seat power and IFE integration mandates +0.5 pp Global Medium-term (2–4 yr)
Gulf carrier suite investment programmes +0.4 pp Middle East Short-term (≤2 yr)


Backlogs Convert Directly into Seat Demand

The Aircraft Seating Market is exceptionally predictable on the upside since every supplied aircraft has a required seating shipset. By the end of 2024, Airbus alone claimed a backlog of over 8,600 aircraft, of which almost three-quarters were A320neo family aircraft [1]. The committed pipeline surpasses USD 9 billion in seating value before any retrofit effort is taken into account, with an average economy shipset value of USD 0.9–1.3 million per single-aisle frame. The binding variable is delivery timing rather than order intake.


Premium Economy Became a Profit Centre

Airlines discovered that a premium economy row generates 1.8 to 2.4 times the revenue per square foot of a standard economy row while costing far less to install than lie-flat business hardware. Cathay Pacific, Lufthansa, and Emirates each expanded premium cabins across long-haul fleets between 2023 and 2025, with Emirates alone committing USD 5 billion to a multi-year cabin retrofit spanning 219 aircraft [15]. Suppliers responded by building dedicated premium economy platforms rather than adapting economy shells.

Weight Is Now a Regulated Cost

Composite and thermoplastic construction has moved from marketing differentiator to procurement requirement. A 6 kg per-seat reduction across an 180-seat narrow-body saves roughly 1,080 kg, translating to approximately 3,900 litres of annual fuel per aircraft under typical utilisation [7]. With EU ETS free allowances for aviation fully phased out in 2026, that saving carries a direct carbon cost avoidance, and airline tender documents increasingly score bids on certified seat mass [10].

Retrofit Volumes Are Rising Faster Than Expected

Roughly 4,700 A320ceo and 737NG aircraft remain in service with cabins configured before 2016, and lease extensions triggered by delivery delays have pushed many of these frames past their original retirement windows [9]. Lessors, not airlines, are increasingly funding these cabin upgrades to protect asset residual values — a financing shift that has expanded the addressable pool of aircraft interior refurbishment programmes well beyond traditional operator budgets.


Restraints Impact Analysis

Restraint weightings represent estimated drag on growth. Values are directional and interact with one another; certification delays, for instance, amplify supply-chain pressure rather than acting independently of it.

Restraint ~% Impact on CAGR Geographic Relevance Impact Timeline
Seat certification and TSO approval backlogs −0.9 pp Global Medium-term (2–4 yr)
Composite and aerostructure supply constraints −0.7 pp Europe, North America Short-term (≤2 yr)
OEM delivery slippage −0.6 pp Global Short-term (≤2 yr)
Rising warranty and in-service support costs −0.4 pp Global Medium-term (2–4 yr)
MRO and cabin engineering labour shortages −0.3 pp North America, Europe Long-term (≥4 yr)


Certification Has Become the Critical Path

Dynamic 16g testing under 14 CFR 25.562, combined with flammability and head-injury-criterion compliance, now consumes 14 to 22 months for a new seat platform — roughly double the 2015 norm [6]. EASA and the FAA both reported extended review queues through 2024 as post-MAX oversight reforms increased documentation depth. Suppliers have responded by freezing platform architectures and selling configuration variants instead, which protects schedules but narrows genuine product differentiation.

Supply Chains Remain Thin at the Second Tier

Seat structures depend on a small population of qualified suppliers for gas struts, recline actuators, aerospace-grade foam, and fire-blocking textiles. Lead times for certain actuator assemblies stretched to 40 weeks during 2024, and dual-sourcing is constrained because each alternate part requires its own qualification campaign [3][14]. Single-source dependency at tier two therefore propagates directly into airline delivery schedules.

Aftermarket Costs Are Eroding Programme Margins

Warranty reserves at major seat suppliers rose materially between 2022 and 2025 as electrically actuated business seats accumulated field hours [17]. Each powered seat carries motors, control boards, and wiring harnesses, so mean time between failures falls as complexity rises. Several carriers have consequently renegotiated support agreements toward availability-based terms, transferring reliability risk back onto manufacturers.


Aircraft Seating Market Opportunities

Densification Engineering for Low-Cost Carriers

Asia-Pacific budget carriers are ordering high-density single-aisle configurations at 186 to 240 seats. Suppliers able to certify a 28-inch pitch product that still delivers acceptable knee clearance can capture volume unavailable to premium-focused competitors. Lightweight aircraft cabin seats designed specifically for this envelope command lower unit prices but far higher annual shipset counts.

Retrofit-as-a-Service Business Models

Rather than selling hardware outright, suppliers can bundle installation, spares pooling, and residual-value guarantees into a per-aircraft monthly charge. Lessors managing 300-plus aircraft portfolios find this structurally attractive because it converts a capital decision into an operating expense aligned to lease terms.

Seat-Embedded Data Monetisation

Modern seats generate occupancy, recline, actuator-cycle, and power-draw telemetry. Aggregated across a fleet, that stream supports predictive maintenance scheduling and cabin utilisation analytics that airlines currently buy separately. Suppliers who retain data rights at contract signature open a recurring software revenue line inside the Aircraft Seating Market.

African and South Asian Fleet Formation

Bangladesh, Ethiopia, Vietnam, and Nigeria are all growing their low-base jet fleets. Due to the restricted capability for local certification, providers who provide turnkey configuration documentation and regulatory liaison are given preference.


Circular Cabin Materials

Demand for recyclable dress covers, mono-material foams, and end-of-lease take-back programs is being driven by changes to the EU waste framework and airline net-zero declarations. A sustainability premium that the aircraft seating market has not previously supported can be priced by early adopters.


Aircraft Seating Market Future Outlook

Connected Cabins and Predictive Maintenance

Seats will become networked assets. By 2030, most new business-class installations will report actuator health and power-draw data to airline maintenance systems, allowing failures to be scheduled rather than discovered. Analysts expect connected cabin spending across commercial fleets to exceed USD 3 billion annually by the early 2030s [13]. The Aircraft Seating Market therefore gains a services layer it did not previously possess.

Certification Reform as a Growth Unlock

Regulators are piloting risk-based approval pathways that reuse prior test evidence for derivative configurations. If the FAA and EASA harmonise dynamic-test credit transfer, platform-to-variant timelines could compress by 30–40%, releasing revenue that is currently trapped in queues [6]. That single procedural change would materially reshape supplier competition in the Aircraft Seating Market.

Electrification and Cabin Power Architecture

More-electric aircraft architectures raise available cabin power budgets substantially, enabling higher-wattage in-seat charging and powered actuation deeper into economy cabins. IATA projects continued growth in passenger device density per seat, which pushes power provisioning from a premium feature toward a baseline expectation [2][13].

Sustainability Reporting Reaches the Seat

Airlines reporting under CSRD and ISSB frameworks must now disclose Scope 3 emissions from purchased goods. Seat suppliers will be asked for verified product carbon footprints as a condition of tender participation, and IATA's net-zero roadmap explicitly identifies cabin weight reduction as a near-term efficiency lever [2][7].


Aircraft Seating Market Segmentation

By Aircraft Type

Segment Metric Primary Demand Driver
Narrow-Body 47.4% share Single-aisle backlog dominance
Wide-Body USD 1.24 Billion Premium cabin value density
Regional Jet 6.64% CAGR Sub-100-seat replacement cycle
Turboprop 4.85% CAGR Thin-route connectivity


Narrow-body platforms dominate the Aircraft Seating Market on volume rather than value per unit. A 180-seat single-aisle shipset typically prices below a 300-seat twin-aisle package, yet single-aisle deliveries outnumber twin-aisle by roughly four to one, and refresh intervals are shorter. Wide-body seating tells the opposite story: fewer units, far higher content value, with a single business suite occasionally exceeding USD 80,000 installed.

Regional jets are recovering after a decade of neglect. Operators deferred replacements through the traffic downturn, and the resulting age profile now forces action, particularly across North American feeder fleets [16].

By Cabin Class

Segment Metric Primary Demand Driver
Economy 44.3% share Seat count volume
Premium Economy 7.40% CAGR Yield per square foot
Business USD 1.09 Billion Product differentiation spending
First 3.9% CAGR Selective ultra-premium retention


Economy remains the largest revenue pool in the Aircraft Seating Market simply because it occupies most of the cabin. Competition here turns on manufacturing throughput and weight, not features. Premium economy grows fastest because it solved a real commercial problem: it monetises leisure travellers who will pay a moderate premium but not a business fare.

First class continues to shrink in seat count while rising in per-unit value, as carriers concentrate ultra-premium product on a handful of flagship routes [4].

By Seat Type

Segment Metric Primary Demand Driver
Standard Fixed-Back USD 0.98 Billion Low-cost carrier densification
Recliner 34.5% share Regional and premium economy fitment
Lie-Flat 6.9% CAGR Long-haul business standardisation
Suite / Full-Privacy 8.78% CAGR Brand differentiation on flagship routes


Suites lead growth across the Aircraft Seating Market despite representing a small unit share, because their content value is extreme — doors, monitors, powered actuation, and stowage multiply the bill of materials. Recliners hold the largest installed share, spanning regional jets, premium economy, and short-haul business configurations.

By Fitment

Segment Metric Primary Demand Driver
Line-Fit 59.7% share New aircraft delivery volumes
Retrofit 6.47% CAGR Lease extensions and cabin refresh cycles


Line-fit dominates value because every delivery mandates a full shipset. Retrofit grows faster, driven by aircraft staying in service longer than planned as OEM delivery slippage extends existing fleet lives [1][9].


Regional Market Share Analysis

Region Metric (2025) Primary Investment Themes
North America USD 1.09 Billion Fleet refresh, lessor-funded retrofits, regional jet replacement
Europe 24.6% share Line-fit volume, composite structures, ETS-driven weight reduction
Asia-Pacific 33.5% share Narrow-body inductions, densification, premium cabin build-out
South America 5.9% CAGR Low-cost expansion, turboprop network renewal
Middle East & Africa 7.0% CAGR Suite programmes, ultra-long-haul cabin reinvestment
Total USD 3.91 Billion


North America

Country Metric Key Driver
US 84.1% of region Largest installed narrow-body base; retrofit density
Canada USD 0.09 Billion Regional jet and turboprop configuration work
Mexico 6.4% CAGR Low-cost carrier fleet growth


Demand here is refresh-led rather than delivery-led. Major US carriers ran overlapping interior programmes through 2024–2025, and the FAA's continued scrutiny of cabin evacuation standards has kept certification workload elevated for domestic modification houses [6][9]. Regional jet operators face a separate pressure: scope-clause seat limits shape configuration choices as much as passenger preference does.

Europe

Country Metric Key Driver
Germany 23.8% of region Airbus line-fit and Recaro production base
UK USD 0.16 Billion Long-haul premium cabin refresh
France 21.2% of region Safran engineering and assembly footprint
Italy 5.8% CAGR Regional jet and narrow-body seat manufacture
Spain 6.1% CAGR Leisure carrier densification
Nordic Countries USD 0.05 Billion Short-haul fleet modernisation
Russia 3.2% of region Domestic programme substitution
Rest of Europe 5.4% CAGR Regional carrier consolidation


Europe's position rests on manufacturing concentration rather than airline spending alone. Three of the five largest seat suppliers operate primary assembly in France, Germany, or the UK, and EU ETS exposure has made cabin weight a board-level metric for continental carriers [10]. Airbus Atlantic's expansion of composite seat-structure capability further deepens the regional supply base.

Asia-Pacific

Country Metric Key Driver
China 31.6% of region COMAC C919 ramp and domestic fleet growth
India 8.4% CAGR IndiGo and Air India order execution
Japan USD 0.14 Billion Premium cabin refresh on long-haul fleets
South Korea 9.1% of region Post-merger fleet harmonisation
ASEAN 7.6% CAGR Low-cost carrier densification
Rest of Asia-Pacific USD 0.08 Billion Regional connectivity programmes


Asia-Pacific leads the Aircraft Seating Market because order books and traffic growth reinforce each other. India's fleet is scheduled to roughly double by 2030 under committed orders exceeding 1,000 aircraft, while China's CAAC continues to certify domestic cabin suppliers to reduce import dependency [11][19]. Both dynamics favour suppliers willing to localise assembly.

South America

Country Metric Key Driver
Brazil 61.4% of region Embraer line-fit and domestic carrier renewal
Argentina USD 0.02 Billion Network restoration and fleet additions
Rest of South America 5.5% CAGR Andean and Caribbean route expansion


Brazil anchors the region through Embraer's E2 programme, which specifies seat configurations at the factory and pulls suppliers into long-term line-fit agreements [16]. Currency volatility remains the principal constraint on discretionary cabin spending among regional operators.

Middle East & Africa

Country Metric Key Driver
Saudi Arabia 9.4% CAGR Riyadh Air launch and national fleet build-out
UAE 44.7% of region Emirates and Etihad retrofit programmes
South Africa USD 0.02 Billion Domestic carrier restructuring
Egypt 6.2% CAGR EgyptAir fleet modernisation
Rest of MEA USD 0.04 Billion African network expansion


Gulf carriers spend disproportionately on cabin differentiation because product quality is their principal competitive weapon on connecting itineraries. Saudi Arabia's aviation strategy targets 330 million annual passengers by 2030 and has already generated firm orders across two new carriers [15][20]. African demand is smaller but structurally underserved.


Aircraft Seating Market By Region, 2025-2035

Competitive Benchmarking

Concentration is moderate. The top five suppliers control an estimated 62–68% of global installed value, producing an HHI in the 1,050–1,250 range — concentrated enough that scale matters, fragmented enough that specialists survive in defined niches. The Aircraft Seating Market rewards two very different models: full-line incumbents with certification depth, and focused challengers competing on weight or lead time.

Company Est. Revenue Share Range Key Offerings for Aircraft Seating Market Strategic Positioning
Safran Seats ~20–24% Full cabin range, business suites, economy platforms Scale leader with deep OEM line-fit integration
Collins Aerospace (RTX) ~16–20% Business, premium economy, economy, monuments Systems bundling across cabin interiors
Recaro Aircraft Seating ~10–13% Economy and premium economy platforms Weight leadership and delivery reliability
Adient Aerospace ~5–8% Business class seating Automotive manufacturing discipline applied to aerospace
Jamco Corporation ~4–7% Premium suites, galleys, lavatories Strong Japanese and US carrier relationships
Thompson Aero Seating ~3–6% Herringbone and staggered business products Space-efficiency specialist
HAECO Cabin Solutions ~3–5% Economy, premium economy, retrofit integration Combined MRO and seat manufacturing
STELIA / Airbus Atlantic ~3–5% Business class and composite structures OEM-affiliated supply security
Geven S.p.A. ~2–4% Economy and regional seating Cost-competitive European manufacturer
Expliseat ~1–3% Titanium-composite ultralight economy Weight-reduction pure play
Acro Aircraft Seating ~1–3% High-density economy Low-cost carrier specialist
ZIM Aircraft Seating ~1–3% Economy and business platforms Flexible configuration engineering


Recent News & Developments

  • Safran (March 2024): Opened expanded seat assembly capacity in Mexico to relieve delivery bottlenecks on economy platforms, addressing a persistent constraint on line-fit schedules [3].


  • EASA (September 2024): Published updated guidance on cabin crashworthiness substantiation, clarifying evidence reuse for derivative seat configurations and easing part of the certification bottleneck [6].
  • Recaro (November 2024): Launched a next-generation economy platform claiming a further reduction in per-seat mass through revised backrest architecture [5].
  • Air India (January 2025): Began a wide-body cabin retrofit spanning its legacy 787 and 777 fleet, one of the largest single retrofit awards in South Asia [11].


  • Riyadh Air (June 2025): Finalised cabin supplier selections ahead of wide-body inductions, signalling sustained Saudi investment in premium product [20].
  • FAA (August 2025): Issued revised policy on seat-mounted electronic device power provisioning, standardising certification expectations for high-wattage in-seat charging [18].


Aircraft Seating Market Report Scope

Parameter Detail
Market Scope Global Aircraft Seating Market covering aircraft type, cabin class, seat type, fitment, and geography
Study Period 2021–2035
Historical Period 2021–2024
Base Year 2025
Forecast Period 2026–2035
CAGR (2026–2035) 6.55%
Market Size (2025) USD 3.91 Billion
Market Size (2026) USD 4.14 Billion
Market Size (2035) USD 7.33 Billion
Fastest Growing Segments Suite / Full-Privacy seating; Premium Economy; Asia-Pacific
Companies Profiled 12 major suppliers across line-fit and retrofit channels
Valuation Currency USD Billion

FAQs

What procurement lead time should an airline plan for a new seat programme in the Aircraft Seating Market?
Budget 24 to 36 months from specification freeze to first installed shipset. Certification consumes most of that window, not manufacturing [6].
How should buyers evaluate supplier risk when sourcing in the Aircraft Seating Market?
Examine tier-two dependency, not headline supplier size. Actuator and fire-blocking textile sourcing concentration predicts delivery risk more reliably than a manufacturer's revenue scale [14].
Is it cheaper to retrofit an existing cabin or specify seats at line-fit?
Line-fit is cheaper per seat because installation happens during assembly. Retrofit adds downtime costs of roughly USD 60,000–90,000 per aircraft day for wide-bodies [9].
What contractual terms matter most in the Aircraft Seating Market beyond unit price?
Spares availability guarantees and warranty scope on powered components. These drive total cost of ownership far more than the initial purchase price on business-class hardware [17].
How do scope clauses affect regional jet seating decisions?
US pilot contracts cap regional aircraft seat counts, usually at 76. Configuration choices follow labour agreements rather than passenger demand or aircraft capability [16].
Can carriers claim emissions credit for lighter cabin hardware?
Yes, indirectly. Reduced mass lowers fuel burn and therefore reportable Scope 1 emissions, though no scheme awards separate credit for the hardware itself [7].
What integration challenge most often delays cabin programmes?
Wiring and power provisioning between seats, IFE, and aircraft systems. Interface responsibility gaps between suppliers cause more schedule slippage than seat structure issues [13].      
Author
Author
Author Profile
Shubham Munde LinkedIn
Team Lead - Research
Shubham brings over 7 years of expertise in Market Intelligence and Strategic Consulting, with a strong focus on the Automotive, Aerospace, and Defense sectors. Backed by a solid foundation in semiconductors, electronics, and software, he has successfully delivered high-impact syndicated and custom research on a global scale. His core strengths include market sizing, forecasting, competitive intelligence, consumer insights, and supply chain mapping. Widely recognized for developing scalable growth strategies, Shubham empowers clients to navigate complex markets and achieve a lasting competitive edge. Trusted by start-ups and Fortune 500 companies alike, he consistently converts challenges into strategic opportunities that drive sustainable growth.
Co-Author
Co-Author Profile
Sejal Akre LinkedIn
Senior Research Analyst
She has over 5 years of rich experience, in market research and consulting providing valuable market insights to client. Hands on expertise in management consulting, and extensive knowledge in domain including ICT, Automotive & Transportation and Aerospace & Defense. She is skilled in Go-to market strategy, industry analysis, market sizing, in depth company profiling, competitive intelligence & benchmarking and value chain amongst others.

Research Approach

Research Methodology on Aircraft Seating Market

Introduction

The research methodology used in the study conducted on the “Aircraft Seating Market” is mainly centred on primary and secondary data. The objectives of the study are to identify the market dynamics, drivers and trends, growth opportunities and challenges, understand the market segments and their expansion opportunities, and assess the overall outlook for the market for 2023-2030.

Research Objectives

The main objective of the research is to assess the global Aircraft Seating market and its influence on the aircraft industry from 2023-2030. The specific objectives of the research are:

  • To identify the key market trends, drivers and challenges in the global Aircraft Seating market and analyze the impact of these on the growth of the industry.
  • To analyze the market segments, it's growth potential and expansion opportunities in the global Aircraft Seating market.
  • To assess the overall outlook of the market for 2023-2030 and make forecasts based on market trends and major players’ performance.
  • To provide an in-depth analysis of the competitive landscape of the global Aircraft Seating market, including the major companies and their strategies.

Research Methodology

The research conducted for the Aircraft Seating Market report requires the use of both primary and secondary data sources. Primary data sources include interviews and online surveys of industry participants and their opinions about the market drivers and trends. Secondary data is gathered from various sources, including reports from companies, magazines, newspapers, websites and other published material. In addition, data from government and industry bodies were used.

Primary research methods helped us evaluate market positioning, identify and map customer needs and expectations, assess market trends and profile customers’ preferences. This enabled us to build a clear picture of the current situation and define the market in terms of size, scope and growth potential.

Interview questions were sent to key leaders in the aerospace industry, including both suppliers and manufacturers, to get their insights and perspectives on the current market dynamics, competitive scenario, and future potential.

Secondary research sources used include published material such as reports, industry magazines, and other industry publications. The websites of the key players in the market were also thoroughly researched to get an understanding of their strategies and performance.

Data Analysis

After the primary and secondary research is conducted, the data is analyzed for key insights. Market size and growth potential were assessed based on the analysis of the primary and secondary data sources. Market segments and their size were evaluated to understand the scope of the industry. Market shares are calculated for 2023-2030 based on the industry analysis conducted.

The qualitative and quantitative data collected are used to generate thorough market assessments and forecasts. The data is validated through data triangulation, where data from multiple sources is collected and triangulated for accuracy. This enables us to build a reliable picture of the market and study the major trends and challenges in the market.

In addition, the data is analyzed using techniques such as Porter’s five forces analysis and SWOT analysis to get a better understanding of the competitive dynamics and market potential.

Finally, the research study included market assessment through ‘bottom up’ and ‘top down’ approaches to making sure all the relevant topics are covered and all the underlying trends are considered.

Conclusion

In conclusion, the research conducted on the global Aircraft Seating market is aimed at providing a comprehensive assessment of the market and its potential for the 2023-2030 period. A detailed analysis of the competitive landscape, market segments, and expansion opportunities is made, as well as an in-depth evaluation of the key market trends, drivers and challenges. The research methodology used is based on primary and secondary data sources and includes a market size and growth estimation.

Download Free Sample

Kindly complete the form below to receive a free sample of this Report

* Please use a valid business email

Download PDF ×

We do not share your information with anyone. However, we may send you emails based on your report interest from time to time. You may contact us at any time to opt-out.
















