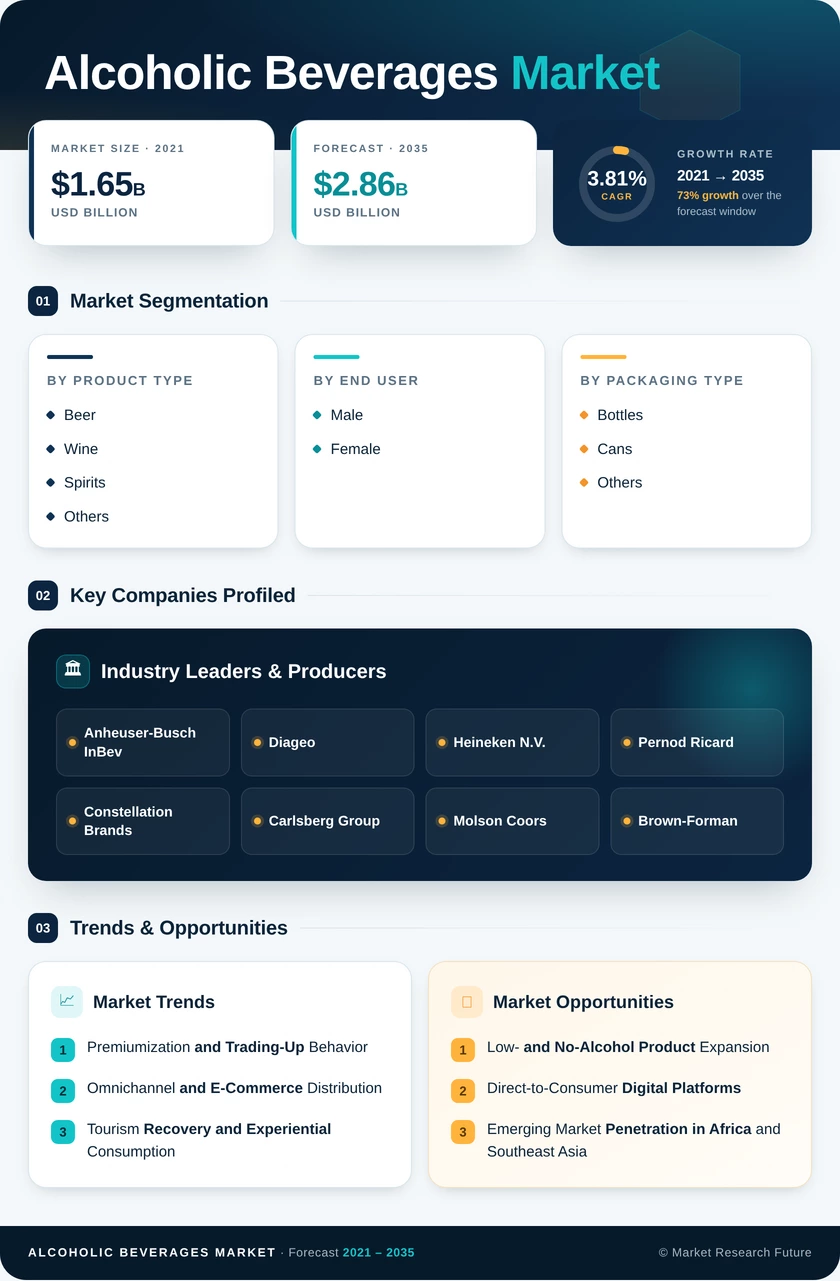
Alcoholic Beverages Market (2025 - 2035)

ID: MRFR/FnB/2299-HCR
200 Pages
Snehal Singh
Last Updated: June 25, 2026
Alcoholic Beverages Market Size, Share, Industry Trend & Analysis Research Report By Product Type (Beer, Wine, Spirits, Others), By End User (Male, Female), By Packaging Type (Bottles, Cans, Others), By Distribution Channel (On-Trade, Off-Trade) - Forecast to 2035
Alcoholic Beverages Market
Market Size
Forecast Period2025-2035
CAGR (2025-2035)3.81%
2025 Market SizeUSD 1.96 Trillion
2035 Market SizeUSD 2.86 Trillion
Key Players
Anheuser-Busch InBev
Diageo
Heineken N.V.
Pernod Ricard
Constellation Brands
Carlsberg Group
Opportunities
  • Low- and No-Alcohol Product Expansion
  • Direct-to-Consumer Digital Platforms
  • Emerging Market Penetration in Africa and Southeast Asia
  1. 1 Market Overview |
    1. 1.1 Study Assumptions & Market Definition |
    2. 1.2 Scope of the Study |
    3. 1.3 Research Methodology
  2. 2 Market Summary & Key Takeaways
  3. 3 Market Dynamics |
    1. 3.1 Market Drivers Analysis | |
      1. 3.1.1 Premiumization and Trading-Up Behavior | |
      2. 3.1.2 Omnichannel and E-Commerce Distribution | |
      3. 3.1.3 Tourism Recovery and Experiential Consumption | |
      4. 3.1.4 Middle-Class Expansion in Emerging Economies | |
      5. 3.1.5 Regulatory Modernization and Fill-Standard Updates | |
      6. 3.1.6 Sustainability-Driven Brand Equity Gains | |
      7. 3.1.7 Low- and No-Alcohol Product Innovation |
    2. 3.2 Market Restraints Analysis | |
      1. 3.2.1 Health Awareness and Anti-Alcohol Campaigns | |
      2. 3.2.2 Excise Tax Escalation | |
      3. 3.2.3 Raw Material Cost Inflation | |
      4. 3.2.4 Counterfeit and Illicit Alcohol Trade | |
      5. 3.2.5 Generational Moderation Trends |
    3. 3.3 Market Opportunity Analysis | |
      1. 3.3.1 Low- and No-Alcohol Product Expansion | |
      2. 3.3.2 Direct-to-Consumer Digital Platforms | |
      3. 3.3.3 Emerging Market Penetration in Africa and Southeast Asia | |
      4. 3.3.4 Sustainability as a Competitive Differentiator | |
      5. 3.3.5 Functional and Wellness-Infused Formulations |
    4. 3.4 Industry Value Chain Analysis |
    5. 3.5 Porter's Five Forces Analysis
  4. 4 Global Alcoholic Beverages Market Size & Forecast (2021–2035) |
    1. 4.1 Historical Market Size (2021–2025) |
    2. 4.2 Current & Forecast Market Size (2026–2035) |
    3. 4.3 Market Size by Revenue (USD Trillion) |
    4. 4.4 Year-over-Year Growth Analysis
  5. 5 Segmentation Analysis |
    1. 5.1 By Product Type | |
      1. 5.1.1 Beer | |
      2. 5.1.2 Wine | |
      3. 5.1.3 Spirits | |
      4. 5.1.4 Others |
    2. 5.2 By End User | |
      1. 5.2.1 Male | |
      2. 5.2.2 Female |
    3. 5.3 By Packaging Type | |
      1. 5.3.1 Bottles | |
      2. 5.3.2 Cans | |
      3. 5.3.3 Others |
    4. 5.4 By Distribution Channel | |
      1. 5.4.1 On-Trade | |
      2. 5.4.2 Off-Trade
  6. 6 Regional Analysis |
    1. 6.1 North America | |
      1. 6.1.1 United States | |
      2. 6.1.2 Canada | |
      3. 6.1.3 Mexico |
    2. 6.2 Europe | |
      1. 6.2.1 Germany | |
      2. 6.2.2 United Kingdom | |
      3. 6.2.3 France | |
      4. 6.2.4 Italy | |
      5. 6.2.5 Spain | |
      6. 6.2.6 Nordic Countries | |
      7. 6.2.7 Russia | |
      8. 6.2.8 Rest of Europe |
    3. 6.3 Asia-Pacific | |
      1. 6.3.1 China | |
      2. 6.3.2 India | |
      3. 6.3.3 Japan | |
      4. 6.3.4 South Korea | |
      5. 6.3.5 ASEAN | |
      6. 6.3.6 Rest of Asia-Pacific |
    4. 6.4 South America | |
      1. 6.4.1 Brazil | |
      2. 6.4.2 Argentina | |
      3. 6.4.3 Rest of South America |
    5. 6.5 Middle East & Africa | |
      1. 6.5.1 Saudi Arabia | |
      2. 6.5.2 UAE | |
      3. 6.5.3 South Africa | |
      4. 6.5.4 Egypt | |
      5. 6.5.5 Rest of MEA
  7. 7 Competitive Landscape |
    1. 7.1 Market Share Analysis (2025) |
    2. 7.2 Competitive Benchmarking Matrix |
    3. 7.3 Company Profiles | |
      1. 7.3.1 Anheuser-Busch InBev | |
      2. 7.3.2 Diageo | |
      3. 7.3.3 Heineken N.V. | |
      4. 7.3.4 Pernod Ricard | |
      5. 7.3.5 Constellation Brands | |
      6. 7.3.6 Carlsberg Group | |
      7. 7.3.7 Molson Coors | |
      8. 7.3.8 Brown-Forman | |
      9. 7.3.9 Asahi Group Holdings | |
      10. 7.3.10 LVMH (Moët Hennessy)
  8. 8 Future Outlook & Strategic Recommendations (2026–2035) |
    1. 8.1 AI-Driven Supply Chain and Production Optimization |
    2. 8.2 Sustainability-Driven Packaging Revolution |
    3. 8.3 Experience Economy and Premiumization Deepening |
    4. 8.4 Digital Commerce and Personalization at Scale
  9. 9 Recent Developments & News
  10. 10 Frequently Asked Questions (FAQs)
  11. 11 Report Scope & Methodology |
    1. 11.1 Study Period & Base Year |
    2. 11.2 Data Sources & Citations |
    3. 11.3 Abbreviations
  12. 12 LIST OF TABLES |
  13. TABLE 1 Global Alcoholic Beverages Market Size & Forecast, by Revenue (USD Trillion), 2021–2035 |
  14. TABLE 2 Global Alcoholic Beverages Market — Year-over-Year Growth Analysis, 2021–2035 |
  15. TABLE 3 Global Alcoholic Beverages Market — Driver Impact Analysis |
  16. TABLE 4 Global Alcoholic Beverages Market — Restraint Impact Analysis |
  17. TABLE 5 Global Alcoholic Beverages Market — Regional Summary, 2025 |
  18. TABLE 6 North America Alcoholic Beverages Market Size, by Country, 2021–2035 (USD Billion) |
  19. TABLE 7 Europe Alcoholic Beverages Market Size, by Country, 2021–2035 (USD Billion) |
  20. TABLE 8 Asia-Pacific Alcoholic Beverages Market Size, by Country, 2021–2035 (USD Billion) |
  21. TABLE 9 South America Alcoholic Beverages Market Size, by Country, 2021–2035 (USD Billion) |
  22. TABLE 10 Middle East & Africa Alcoholic Beverages Market Size, by Country, 2021–2035 (USD Billion) |
  23. TABLE 11 Global Alcoholic Beverages Market Size, by Product Type, 2021–2035 (USD Billion) |
  24. TABLE 12 Global Alcoholic Beverages Market Size, by End User, 2021–2035 (USD Billion) |
  25. TABLE 13 Global Alcoholic Beverages Market Size, by Packaging Type, 2021–2035 (USD Billion) |
  26. TABLE 14 Global Alcoholic Beverages Market Size, by Distribution Channel, 2021–2035 (USD Billion) |
  27. TABLE 15 Competitive Benchmarking Matrix — Global Alcoholic Beverages Market, 2025 |
  28. TABLE 16 Company Profiles — Key Players, Global Alcoholic Beverages Market |
  29. TABLE 17 Recent Developments & Strategic Announcements, 2023–2025 |
  30. TABLE 18 Report Scope & Methodology Summary
  31. 13 LIST OF FIGURES |
  32. FIGURE 1 Global Alcoholic Beverages Market — Market Dynamics Overview |
  33. FIGURE 2 Industry Value Chain Analysis — Alcoholic Beverages Market |
  34. FIGURE 3 Porter's Five Forces Analysis — Alcoholic Beverages Market |
  35. FIGURE 4 Global Alcoholic Beverages Market Size Trend (USD Trillion), 2021–2035 |
  36. FIGURE 5 Alcoholic Beverages Market Share, by Product Type (%), 2025 |
  37. FIGURE 6 Alcoholic Beverages Market Share, by End User (%), 2025 |
  38. FIGURE 7 Alcoholic Beverages Market Share, by Packaging Type (%), 2025 |
  39. FIGURE 8 Alcoholic Beverages Market Share, by Distribution Channel (%), 2025 |
  40. FIGURE 9 Alcoholic Beverages Market Share, by Region (%), 2025 |
  41. FIGURE 10 Competitive Landscape — Market Concentration & Share Distribution, 2025

Segmentation Quick Reference

DimensionSub-SegmentsDominant SegmentFastest Growing Segment
Product TypeBeer, Wine, Spirits, OthersBeer (46.0% share, 2025)Spirits (3.97% CAGR)
End UserMale, FemaleMale (67.0% share, 2025)Female (4.21% CAGR)
Packaging TypeBottles, Cans, OthersBottles (69.0% share, 2025)Cans (4.58% CAGR)
Distribution ChannelOn-Trade, Off-TradeOn-Trade (53.0% share, 2025)Off-Trade (4.24% CAGR)


Market Segmentation Overview

By Product Type

Sub-SegmentKey Trend
BeerCraft and microbrewery expansion globally; premiumization within mainstream lager brands
WineOrganic and biodynamic certifications are gaining share; rosé and sparkling outperforming still
SpiritsCocktail culture renaissance; aged and single-origin expressions commanding price premiums
OthersHard seltzers, RTD cocktails, and ciders are diversifying the product mix beyond traditional categories


The product-type dimension captures the broadest revenue differentiation across the Alcoholic Beverages Market. Mainstream and economy tiers dominate absolute volume, while premium-plus tiers drive the majority of incremental value creation. Category boundaries are blurring as hybrid products (spirit-based RTDs, wine spritzers, flavored malt beverages) create crossover consumption occasions.

By End User

Sub-SegmentKey Trend
MaleStable base with premiumization in whiskey, craft, and collectible categories
FemaleFastest-growing demographic; driving innovation in lower-ABV, flavored, and lighter-format products


Gender-based consumption patterns are converging as social norms evolve, and producers invest in inclusive marketing. The female consumer cohort is the primary growth driver for new product categories, including botanical-infused cocktails, premium rosé, and single-serve formats designed for convenience and portion control.

By Packaging Type

Sub-SegmentKey Trend
BottlesGlass remains dominant for premium tiers; lightweight bottle technology is reducing transport costs
CansSustainability appeal and outdoor occasion suitability; expanding from mainstream into premium tiers
OthersBag-in-box for value wine; pouches and kegs for on-premise efficiency


Packaging innovation is a strategic battleground in the Alcoholic Beverages Market. Aluminum cans offer the strongest sustainability narrative (infinite recyclability), while glass retains consumer perception advantages in premium and ultra-premium positioning. Emerging formats like paper-based bottles are in early commercial trials across Northern European markets.

By Distribution Channel

Sub-SegmentKey Trend
On-TradePost-pandemic recovery; experiential consumption and premiumization at the point of service
Off-TradeE-commerce expansion; convenience-store penetration; DTC subscription models


The distribution channel split reflects a structural tension in the Alcoholic Beverages Market: on-trade captures higher per-unit margins but faces labor and real-estate cost pressures, while off-trade benefits from scalable digital infrastructure and lower overhead. The fastest value growth is occurring at the intersection — hybrid models like click-and-collect, on-premise retail integration, and dark-kitchen cocktail delivery.


 

Download PDF ×

We do not share your information with anyone. However, we may send you emails based on your report interest from time to time. You may contact us at any time to opt-out.