• Cat-intel
  • MedIntelliX
  • Resources
  • About Us
  • Hero Background
    English
    Chinese
    French
    Japanese
    Korean
    German
    Spanish

    Asia Pacific Tortilla Market Share

    ID: MRFR/F-B & N/3720-CR
    128 Pages
    Snehal Singh
    January 2018

    Asia Pacific Tortilla Market Report Information by Product Type (Tortilla Mix, Pre-Cooked Tortilla, Frozen Tortilla, Tortilla Chips), Source (Corn, Wheat), Claim (Gluten-Free, Low-carb), Distribution Channel (Store & Non-store) & Region - Forecast till 2035

    Share:
    Download PDF ×

    We do not share your information with anyone. However, we may send you emails based on your report interest from time to time. You may contact us at any time to opt-out.

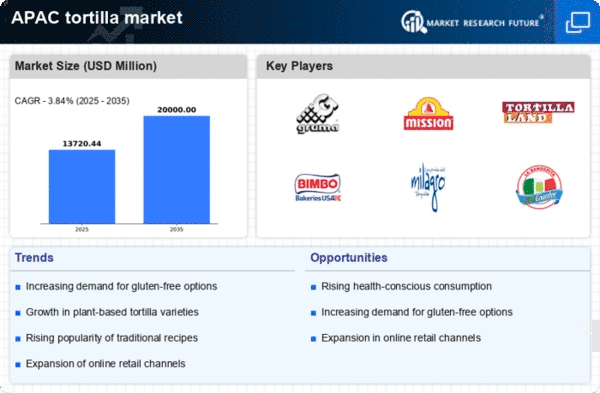
    Asia Pacific Tortilla Market Infographic
    $ 4,950.0
    $ 5,950.0
    $ 7,250.0

    Market Share

    Asia Pacific Tortilla Market Share Analysis

    The Asia Pacific Tortilla Market is a vibrant and diverse landscape where market share positioning strategies play a pivotal role in shaping the success of various brands. One fundamental strategy employed by companies in this market is flavor customization. Recognizing the diverse culinary preferences across the region, brands develop a variety of tortilla options that cater to local tastes. Whether it's adapting to regional spices, incorporating traditional flavors, or experimenting with fusion cuisines, customization allows brands to connect with consumers on a personal and cultural level. Pricing strategies are another crucial aspect of market share positioning. Brands often adopt a flexible pricing approach, balancing affordability and perceived value. Some target the premium segment, emphasizing high-quality ingredients and artisanal crafting processes, while others focus on providing budget-friendly options to capture a wider consumer base. Striking the right balance ensures that brands are competitive in both high-end culinary experiences and everyday meals, thereby securing a diverse market share. Distribution channels play a significant role in reaching consumers across the expansive Asia Pacific region. Brands strategically choose their distribution partners to ensure widespread availability. Whether through supermarkets, local grocery stores, or e-commerce platforms, an effective distribution strategy contributes to a brand's visibility and accessibility. In some cases, partnerships with local retailers or collaborations with popular food outlets can enhance a brand's presence and appeal. Innovation remains a driving force in the Asia Pacific Tortilla Market. Brands invest in research and development to introduce novel tortilla varieties, incorporating unique ingredients, textures, or shapes. Innovation not only attracts adventurous consumers seeking new gastronomic experiences but also positions the brand as a trendsetter in the market. Staying attuned to evolving food trends and dietary preferences is key for companies aiming to maintain a competitive edge and grow their market share. Marketing and branding strategies are paramount in capturing consumer attention and loyalty. Effective communication of a brand's story, values, and commitment to quality can create lasting connections with consumers. Social media, influencer partnerships, and engaging advertising campaigns are commonly used to enhance brand visibility. Brands often highlight their sourcing practices, sustainability initiatives, or cultural authenticity to differentiate themselves and build a unique market position. Global market expansion is a strategy embraced by some brands to increase their market share. Identifying and entering new markets within the Asia Pacific region allows companies to diversify their consumer base and adapt to varying preferences. Customizing products to suit local tastes and collaborating with regional partners can be instrumental in successfully establishing a presence in diverse markets. Consumer education is an essential strategy that is sometimes overlooked. Brands invest in educating consumers about the versatility of tortillas, providing recipe ideas, and showcasing their adaptability to different cuisines. By creating awareness and enhancing the perceived value of tortillas, companies can influence consumer preferences and expand their market share.

    Market Summary

    As per Market Research Future Analysis, the Asia Pacific Tortilla Market is projected to grow at a CAGR of 6.2% and reach USD 2,997.2 million by 2032. The market is driven by the increasing consumer preference for healthy convenience foods, with corn-based tortillas witnessing a surge in demand. Innovations in product offerings, such as fortification with fiber and seeds, are attracting consumers. However, fluctuations in corn supply due to climatic conditions may impact production and pricing. China is expected to dominate the market, reaching USD 580.96 million by 2023, while Australia & New Zealand are projected to grow at a CAGR of 2.88%. The pre-cooked tortilla segment is anticipated to hold the largest market share, growing at a CAGR of 2.92%.

    Key Market Trends & Highlights

    Key trends influencing the Asia Pacific Tortilla Market include health-focused innovations and regional consumption patterns.

    • China is projected to retain market dominance, estimated to reach USD 580.96 million by 2023.
    • The pre-cooked tortilla segment is expected to grow at a CAGR of 2.92% during the forecast period.
    • The low-carb segment is anticipated to be the fastest growing at a CAGR of 3.03% due to rising obesity rates.
    • Store-based distribution channels dominate with a 90% market share, emphasizing consumer preference for one-stop shopping.

    Market Size & Forecast

    2023 Market Size USD 2,001.18 million
    2032 Market Size USD 2,997.2 million
    CAGR 6.2%
    Dominant Region China

    Major Players

    Tyson Foods, Inc. (U.S.), Gruma SAB de CV (Mexico), Grupo Bimbo SAB de CV (Mexico), General Mills, Inc. (U.S.), Azteca Foods Inc. (U.S.), Ole Mexican Foods Inc. (U.S.), Grupo Liven, S.A. (Spain)

    Market Trends

    Asia Pacific Tortilla Market Market Drivers

    Market Segment Insights

    Regional Insights

    Key Companies in the Asia Pacific Tortilla Market market include

    Industry Developments

    Market Segmentation

    Report Scope

    {}

    Market Highlights

    Author

    Snehal Singh
    Assistant Manager - Research

    She holds an experience of about 6+ years in market research and business consulting, working under the spectrum of information communication technology, telecommunications and semiconductor domains. aarti conceptualizes and implements a scalable business strategy and provides strategic leadership to the clients. her expertise lies in market estimation, competitive intelligence, pipeline analysis, customer assessment, etc.

    Leave a Comment

    Latest Comments

    John Doe
    john@example.com

    This is a great article! Really helped me understand the topic better.

    Posted on July 23, 2025, 10:15 AM
    Jane Smith
    jane@domain.com

    Thanks for sharing this. I’ve bookmarked it for later reference.

    Posted on July 22, 2025, 7:45 PM

    FAQs

    1. Report Prologue
    2. Introduction
      1. Definition 11
        1. Tortilla 11
      2. Scope of the Study 11
        1. Research Methodology 11
      3. Assumptions 11
      4. Limitations 11
      5. Research Process/Methodology 12
      6. Primary Research 13
      7. Secondary Research 14
      8. Forecast Model 15
    3. Premium Insights
      1. Asia Pacific Tortilla Market: Market Mapping & Research Methodology 16
      2. Market Overview: Asia Pacific Tortilla Market 17
      3. Industry Trends and Market Environment: Asia Pacific Tortilla Market 18
    4. Market Dynamics
      1. Introduction 20
      2. Drivers 21
        1. Rapidly growing Hispanic population 21
        2. Rising population of health conscious consumers 21
        3. Increasing consumption of tortilla in the form of tortilla chips 21
      3. Restraints 22
        1. High R&D investments 22
      4. Opportunities 22
        1. Increasing demand in developing countries 22
        2. Enhanced production techniques 22
      5. Challenges 23
        1. Fluctuation in the product prices 23
    5. Market Factor Analysis
      1. Introduction 24
      2. Value Chain Analysis 24
      3. Supply Chain Analysis 26
      4. Porter''s Five Forces 27
        1. Porter''s 5 Forces Analysis: Tortilla Market 27
        2. Threat of New Entrants 28
        3. Threat of Substitutes 28
        4. Bargaining Power of Buyers 29
        5. Bargaining Power of Suppliers 29
        6. Internal Rivalry 30
    6. Asia Pacific Tortilla Market, By Product Type
      1. Introduction 31
      2. Asia Pacific Tortilla Market, By Product Type 31
    7. Asia Pacific Tortilla Market, By Source
      1. Introduction 33
      2. Asia Pacific Tortilla Market- By Source 33
    8. Asia Pacific Tortilla Market, By Claim
      1. Introduction 35
      2. Asia Pacific Tortilla Market- By Claim 35
    9. Asia Pacific Tortilla Market, By Distribution Channel
      1. Introduction 37
      2. Asia Pacific Tortilla Market, By Distribution Channel 37
    10. Asia Pacific Tortilla Market, By Country
      1. Asia Pacific Tortilla Market, By Country 39
    11. Asia Pacific Tortilla Market, By Product Type
    12. Asia Pacific Tortilla Market, By Source
    13. Asia Pacific Tortilla Market, By Claim
    14. Asia Pacific Tortilla Market, By Distribution Channel
      1. China 41
    15. Asia Pacific Tortilla Market, By Source
    16. Asia Pacific Tortilla Market, By Claim
    17. Asia Pacific Tortilla Market, By Distribution Channel
      1. India 44
    18. Asia Pacific Tortilla Market, By Product Type
    19. Asia Pacific Tortilla Market, By Claim
      1. Japan 47
    20. Asia Pacific Tortilla Market, By Source
    21. Asia Pacific Tortilla Market, By Distribution Channel
      1. Australia & New Zealand 50
      2. Indonesia 53
    22. Asia Pacific Tortilla Market, By Product Type
    23. Asia Pacific Tortilla Market, By Distribution Channel
      1. Republic of Korea 57
    24. Asia Pacific Tortilla Market, By Product Type
    25. Asia Pacific Tortilla Market, By Claim
      1. Thailand 60
      2. Vietnam 63
      3. Rest of Asia Pacific 66
    26. Asia Pacific Tortilla Market, By Product Type
    27. Asia Pacific Tortilla Market, By Claim
    28. Competitive Landscape
    29. Company Profiles
      1. Tyson Foods, Inc. 73
        1. Company Overview 73
        2. Financials 73
        3. Products 73
        4. Strategy 73
        5. Key Developments 73
      2. Gruma SAB de CV 74
        1. Company Overview 74
        2. Financials 74
        3. Products 74
        4. Strategy 74
        5. Key Developments 74
      3. Grupo Bimbo SAB de CV 75
        1. Company Overview 75
        2. Financials 75
        3. Products 75
        4. Strategy 75
        5. Key Developments 75
      4. General Mills, Inc. 76
        1. Company Overview 76
        2. Financials 76
        3. Products 76
        4. Strategy 76
        5. Key Developments 76
      5. Azteca Foods Inc. 77
        1. Company Overview 77
        2. Financials 77
        3. Products 77
        4. Strategy 77
        5. Key Developments 77
      6. Ole Mexican Foods Inc. 78
        1. Company Overview 78
        2. Financials 78
        3. Products 78
        4. Strategy 78
        5. Key Developments 78
      7. Grupo Liven, S.A. 79
        1. Company Overview 79
        2. Financials 79
        3. Products 79
        4. Strategy 79
        5. Key Developments 79
    30. List of Tables and Figures
      1. 13 List of Tables
      2. TABLE 1 ASIA PACIFIC TORTILLA MARKET, BY PRODUCT TYPE (2024-2032), (USD MN) 32
      3. TABLE 2 ASIA PACIFIC TORTILLA MARKET, BY PRODUCT TYPE (2024-2032), (USD MN) 32
      4. TABLE 3 ASIA PACIFIC TORTILLA MARKET, BY SOURCE (2024-2032), USD MN 34
      5. TABLE 4 ASIA PACIFIC TORTILLA MARKET, BY SOURCE (2024-2032), USD MN 34
      6. TABLE 5 ASIA PACIFIC TORTILLA MARKET, BY CLAIM (2024-2032), USD MN 36
      7. TABLE 6 ASIA PACIFIC TORTILLA MARKET, BY CLAIM (2024-2032), USD MN 36
      8. TABLE 7 ASIA PACIFIC TORTILLA MARKET, BY DISTRIBUTION CHANNEL (2024-2032), (USD MN) 38
      9. TABLE 8 ASIA PACIFIC TORTILLA MARKET, BY DISTRIBUTION CHANNEL (2024-2032), (USD MN) 38
      10. TABLE 9 ASIA PACIFIC TORTILLA MARKET, BY COUNTRY (2024-2032), USD MN 40
      11. TABLE 10 ASIA PACIFIC TORTILLA MARKET, BY COUNTRY (2024-2032), USD MN 40
      12. TABLE 11 CHINA TORTILLA MARKET, BY PRODUCT TYPE (2024-2032), (USD MN) 41
      13. TABLE 12 CHINA TORTILLA MARKET, BY PRODUCT TYPE (2024-2032), (USD MN) 41
      14. TABLE 13 CHINA TORTILLA MARKET, BY SOURCE (2024-2032), USD MN 42
      15. TABLE 14 CHINA TORTILLA MARKET, BY SOURCE (2024-2032), USD MN 42
      16. TABLE 15 CHINA TORTILLA MARKET, BY CLAIM (2024-2032), USD MN 42
      17. TABLE 16 CHINA TORTILLA MARKET, BY CLAIM (2024-2032), USD MN 43
      18. TABLE 17 CHINA TORTILLA MARKET, BY DISTRIBUTION CHANNEL (2024-2032), USD MN 43
      19. TABLE 18 CHINA TORTILLA MARKET, BY DISTRIBUTION CHANNEL (2024-2032), USD MN 43
      20. TABLE 19 INDIA TORTILLA MARKET, BY PRODUCT TYPE (2024-2032), (USD MN) 44
      21. TABLE 20 INDIA TORTILLA MARKET, BY PRODUCT TYPE (2024-2032), (USD MN) 44
      22. TABLE 21 INDIA TORTILLA MARKET, BY SOURCE (2024-2032), USD MN 45
      23. TABLE 22 INDIA TORTILLA MARKET, BY SOURCE (2024-2032), USD MN 45
      24. TABLE 23 INDIA TORTILLA MARKET, BY CLAIM (2024-2032), USD MN 45
      25. TABLE 24 INDIA TORTILLA MARKET, BY CLAIM (2024-2032), USD MN 46
      26. TABLE 25 INDIA TORTILLA MARKET, BY DISTRIBUTION CHANNEL (2024-2032), USD MN 46
      27. TABLE 26 INDIA TORTILLA MARKET, BY DISTRIBUTION CHANNEL (2024-2032), USD MN 46
      28. TABLE 27 JAPAN TORTILLA MARKET, BY PRODUCT TYPE (2024-2032), (USD MN) 47
      29. TABLE 28 JAPAN TORTILLA MARKET, BY PRODUCT TYPE (2024-2032), (USD MN) 47
      30. TABLE 29 JAPAN TORTILLA MARKET, BY SOURCE (2024-2032), USD MN 48
      31. TABLE 30 JAPAN TORTILLA MARKET, BY SOURCE (2024-2032), USD MN 48
      32. TABLE 31 JAPAN TORTILLA MARKET, BY CLAIM (2024-2032), USD MN 48
      33. TABLE 32 JAPAN TORTILLA MARKET, BY CLAIM (2024-2032), USD MN 49
      34. TABLE 33 JAPAN TORTILLA MARKET, BY DISTRIBUTION CHANNEL (2024-2032), USD MN 49
      35. TABLE 34 JAPAN TORTILLA MARKET, BY DISTRIBUTION CHANNEL (2024-2032), USD MN 49
      36. TABLE 35 AUSTRALIA & NEW ZEALAND TORTILLA MARKET, BY PRODUCT TYPE (2024-2032), (USD MN) 50
      37. TABLE 36 AUSTRALIA & NEW ZEALAND TORTILLA MARKET, BY PRODUCT TYPE (2024-2032), (USD MN) 50
      38. TABLE 37 AUSTRALIA & NEW ZEALAND TORTILLA MARKET, BY SOURCE (2024-2032), USD MN 51
      39. TABLE 38 AUSTRALIA & NEW ZEALAND TORTILLA MARKET, BY SOURCE (2024-2032), USD MN 51
      40. TABLE 39 AUSTRALIA & NEW ZEALAND TORTILLA MARKET, BY CLAIM (2024-2032), USD MN 51
      41. TABLE 40 AUSTRALIA & NEW ZEALAND TORTILLA MARKET, BY CLAIM (2024-2032), USD MN 52
      42. TABLE 41 AUSTRALIA & NEW ZEALAND TORTILLA MARKET, BY DISTRIBUTION CHANNEL (2024-2032), USD MN 52
      43. TABLE 42 AUSTRALIA & NEW ZEALAND TORTILLA MARKET, BY DISTRIBUTION CHANNEL (2024-2032), USD MN 53
      44. TABLE 43 INDONESIA TORTILLA MARKET, BY PRODUCT TYPE (2024-2032), (USD MN) 53
      45. TABLE 44 INDONESIA TORTILLA MARKET, BY PRODUCT TYPE (2024-2032), (USD MN) 54
      46. TABLE 45 INDONESIA TORTILLA MARKET, BY SOURCE (2024-2032), USD MN 54
      47. TABLE 46 INDONESIA TORTILLA MARKET, BY SOURCE (2024-2032), USD MN 54
      48. TABLE 47 INDONESIA TORTILLA MARKET, BY CLAIM (2024-2032), USD MN 55
      49. TABLE 48 INDONESIA TORTILLA MARKET, BY CLAIM (2024-2032), USD MN 55
      50. TABLE 49 INDONESIA TORTILLA MARKET, BY DISTRIBUTION CHANNEL (2024-2032), USD MN 56
      51. TABLE 50 INDONESIA TORTILLA MARKET, BY DISTRIBUTION CHANNEL (2024-2032), USD MN 56
      52. TABLE 51 REPUBLIC OF KOREA TORTILLA MARKET, BY PRODUCT TYPE (2024-2032), (USD MN) 57
      53. TABLE 52 REPUBLIC OF KOREA TORTILLA MARKET, BY PRODUCT TYPE (2024-2032), (USD MN) 57
      54. TABLE 53 REPUBLIC OF KOREA TORTILLA MARKET, BY SOURCE (2024-2032), USD MN 58
      55. TABLE 54 REPUBLIC OF KOREA TORTILLA MARKET, BY SOURCE (2024-2032), USD MN 58
      56. TABLE 55 REPUBLIC OF KOREA TORTILLA MARKET, BY CLAIM (2024-2032), USD MN 58
      57. TABLE 56 REPUBLIC OF KOREA TORTILLA MARKET, BY CLAIM (2024-2032), USD MN 59
      58. TABLE 57 REPUBLIC OF KOREA TORTILLA MARKET, BY DISTRIBUTION CHANNEL (2024-2032), USD MN 59
      59. TABLE 58 REPUBLIC OF KOREA TORTILLA MARKET, BY DISTRIBUTION CHANNEL (2024-2032), USD MN 59
      60. TABLE 59 THAILAND TORTILLA MARKET, BY PRODUCT TYPE (2024-2032), (USD MN) 60
      61. TABLE 60 THAILAND TORTILLA MARKET, BY PRODUCT TYPE (2024-2032), (USD MN) 60
      62. TABLE 61 THAILAND TORTILLA MARKET, BY SOURCE (2024-2032), USD MN 61
      63. TABLE 62 THAILAND TORTILLA MARKET, BY SOURCE (2024-2032), USD MN 61
      64. TABLE 63 THAILAND TORTILLA MARKET, BY CLAIM (2024-2032), USD MN 61
      65. TABLE 64 THAILAND TORTILLA MARKET, BY CLAIM (2024-2032), USD MN 62
      66. TABLE 65 THAILAND TORTILLA MARKET, BY DISTRIBUTION CHANNEL (2024-2032), USD MN 62
      67. TABLE 66 THAILAND TORTILLA MARKET, BY DISTRIBUTION CHANNEL (2024-2032), USD MN 62
      68. TABLE 67 VIETNAM TORTILLA MARKET, BY PRODUCT TYPE (2024-2032), (USD MN) 63
      69. TABLE 68 VIETNAM TORTILLA MARKET, BY PRODUCT TYPE (2024-2032), (USD MN) 63
      70. TABLE 69 VIETNAM TORTILLA MARKET, BY SOURCE (2024-2032), USD MN 64
      71. TABLE 70 VIETNAM TORTILLA MARKET, BY SOURCE (2024-2032), USD MN 64
      72. TABLE 71 VIETNAM TORTILLA MARKET, BY CLAIM (2024-2032), USD MN 64
      73. TABLE 72 VIETNAM TORTILLA MARKET, BY CLAIM (2024-2032), USD MN 65
      74. TABLE 73 VIETNAM TORTILLA MARKET, BY DISTRIBUTION CHANNEL (2024-2032), USD MN 65
      75. TABLE 74 VIETNAM TORTILLA MARKET, BY DISTRIBUTION CHANNEL (2024-2032), USD MN 65
      76. TABLE 75 REST OF ASIA PACIFIC TORTILLA MARKET, BY PRODUCT TYPE (2024-2032), (USD MN) 66
      77. TABLE 76 REST OF ASIA PACIFIC TORTILLA MARKET, BY PRODUCT TYPE (2024-2032), (USD MN) 66
      78. TABLE 77 REST OF ASIA PACIFIC TORTILLA MARKET, BY SOURCE (2024-2032), USD MN 67
      79. TABLE 78 REST OF ASIA PACIFIC TORTILLA MARKET, BY SOURCE (2024-2032), USD MN 67
      80. TABLE 79 REST OF ASIA PACIFIC TORTILLA MARKET, BY CLAIM (2024-2032), USD MN 68
      81. TABLE 80 REST OF ASIA PACIFIC TORTILLA MARKET, BY CLAIM (2024-2032), USD MN 68
      82. TABLE 81 REST OF ASIA PACIFIC TORTILLA MARKET, BY DISTRIBUTION CHANNEL (2024-2032), USD MN 68
      83. TABLE 82 REST OF ASIA PACIFIC TORTILLA MARKET, BY DISTRIBUTION CHANNEL (2024-2032), USD MN 69
      84. TABLE 83 COMPETITIVE LANDSCAPING: ASIA PACIFIC TORTILLA MARKET: BY STRATEGY (2024-2032) 72   14 List of Figures
      85. FIGURE 1 RESEARCH PROCESS OF MRFR 12
      86. FIGURE 2 PRIMARY RESEARCH PROCESS 13
      87. FIGURE 3 SECONDARY RESEARCH PROCESS: TOP DOWN & BOTTOM UP APPROACH 14
      88. FIGURE 4 FORECAST MODEL 15
      89. FIGURE 5 Market Segmentation: ASIA PACIFIC TORTILLA MARKET 17
      90. FIGURE 6 PRODUCT LIFECYLE: ASIA PACIFIC TORTILLA MARKET 18
      91. FIGURE 7 PRODUCT LIFECYLE: ASIA PACIFIC TORTILLA MARKET, BY COUNTRY 19
      92. FIGURE 8 DRIVERS & RESTRAINTS ANALYSIS OF TORTILLA 20
      93. FIGURE 9 VALUE CHAIN ANALYSIS OF ASIA PACIFIC TORTILLA MARKET 24
      94. FIGURE 10 PRODUCTION OF TORTILLA AND DERIVATIVES 25
      95. FIGURE 11 SUPPLY CHAIN ANALYSIS OF ASIA PACIFIC TORTILLA MARKET 26
      96. FIGURE 12 PORTER''S 5 FORCES ANALYSIS OF ASIA PACIFIC TORTILLA MARKET 27
      97. FIGURE 13 ASIA PACIFIC TORTILLA MARKET, BY PRODUCT TYPE USD MN 31
      98. FIGURE 14 ASIA PACIFIC TORTILLA MARKET, BY SOURCE 33
      99. FIGURE 15 ASIA PACIFIC TORTILLA MARKET, BY CLAIM 35
      100. FIGURE 16 ASIA PACIFIC TORTILLA MARKET, BY DISTRIBUTION CHANNEL USD MN 37
      101. FIGURE 17 ASIA PACIFIC TORTILLA MARKET, BY COUNTRY 39
      102. FIGURE 18 ASIA PACIFIC TORTILLA MARKET:MAJOR PLAYER MARKET DEVELOPMENT SHARE 2024-2032 70
      103. FIGURE 19 ASIA PACIFIC TORTILLA MARKET: STRATEGY ANALYSIS 71
      104. FIGURE 20 ASIA PACIFIC TORTILLA MARKET: MARKET DEVELOPMENT (2024-2032) 72

    Asia Pacific Tortilla Market Segmentation

    Market Segmentation Overview

    • Detailed segmentation data will be available in the full report
    • Comprehensive analysis by multiple parameters
    • Regional and country-level breakdowns
    • Market size forecasts by segment
    Infographic

    Free Sample Request

    Kindly complete the form below to receive a free sample of this Report

    Get Free Sample

    Customer Strories

    “I am very pleased with how market segments have been defined in a relevant way for my purposes (such as "Portable Freezers & refrigerators" and "last-mile"). In general the report is well structured. Thanks very much for your efforts.”

    Victoria Milne

    Founder
    Case Study
    Chemicals and Materials