• Cat-intel
  • MedIntelliX
  • Resources
  • About Us
  • Hero Background
    English
    Chinese
    French
    Japanese
    Korean
    German
    Spanish

    Autoclave Indicator Tape Market Trends

    ID: MRFR/PNT/3182-HCR
    111 Pages
    Pradeep Nandi
    October 2025

    Autoclave Indicator Tape Market Research Report: By Application (Medical, Pharmaceutical, Laboratory), By Material Type (Paper, Plastic, Polyimide), By Indicator Type (Temperature Indicator, Chemical Indicator, Biological Indicator), By End Use (Hospitals, Clinics, Research Institutions) and By Regional (North America, Europe, South America, Asia Pacific, Middle East and Africa) - Forecast to 2...

    Share:
    Download PDF ×

    We do not share your information with anyone. However, we may send you emails based on your report interest from time to time. You may contact us at any time to opt-out.

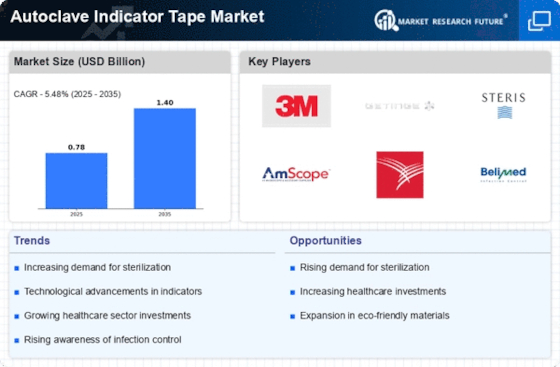
    Autoclave Indicator Tape Market Infographic
    $ 4,950.0
    $ 5,950.0
    $ 7,250.0

    Market Trends

    Key Emerging Trends in the Autoclave Indicator Tape Market

    Autoclave indicator tape is critical in assuring the efficiency and total reliability of sterilization processes in various sectors like healthcare and laboratories. This special kind of tape is developed to show whether any item was subjected to the required sterilizing conditions within an autoclave. Most importantly, autoclave indicator tape is used to indicate when a successful process, such as sterilization, has been accomplished as it changes its color or shows certain markings when exposed to high temperatures together with pressure prevailing inside an autoclave. Thus, visual indication allows health professionals and laboratory technicians to identify items that have undergone proper sterilization rapidly and easily. One key driver of the Autoclave Indicator Tape market is increased attention toward infection control and prevention within healthcare settings. Hospitals, clinics, and other healthcare facilities require strict adherence to sterilization protocols so as to curb infections spreading among patients under their care. Similarly, research facilities, including medical laboratories, depend heavily on autoclave indicator tape, which makes sure that they stay sterile always. In research labs where contamination can compromise experiments, leading to misleading results, sterilizing processes must be effectively done, therefore making autoclaving a necessity because researchers will not focus on their work if they do not trust their instrument's cleanliness. Admittedly, if these countries want to make sure their healthcare infrastructure is in step with the modern world, then they need to invest in reliable sterilization verification. On the other hand, manufacturers have made improvements on autoclave indicator tape with regard to technology, which has come a long way towards enhancing the reliability and accuracy of sterilization indicators. These color changes are unmistakable because manufacturers have incorporated modern materials in order for tapes to remain unaffected by environmental factors such as moisture and humidity. Also, regulatory standards and guidelines play a big role in the autoclave indicator tape market. Therefore, various healthcare institutions, especially within the USA, should adhere to all regulations surrounding hospital settings since this will prevent some of the infections that can be avoided through proper sterilization strategies. Globalization, coupled with the expansion of healthcare and research facilities throughout the world, further deepens demand for the autoclave indicator tape while making it universal. That's why most developing countries, including China, are doing everything possible to put up reliable sterilization verifications, thus bringing them into line with their counterparts in developed nations.

    Market Summary

    The Global Autoclave Indicator Tape Market is projected to grow from 0.77 USD Billion in 2024 to 1.41 USD Billion by 2035.

    Key Market Trends & Highlights

    Autoclave Indicator Tape Key Trends and Highlights

    • The market is expected to experience a compound annual growth rate (CAGR) of 5.6 percent from 2025 to 2035.
    • By 2035, the market valuation is anticipated to reach 1.41 USD Billion, indicating robust growth potential.
    • In 2024, the market is valued at 0.77 USD Billion, reflecting a solid foundation for future expansion.
    • Growing adoption of sterilization processes in healthcare facilities due to increasing safety regulations is a major market driver.

    Market Size & Forecast

    2024 Market Size 0.77 (USD Billion)
    2035 Market Size 1.41 (USD Billion)
    CAGR (2025-2035) 5.6%
    Largest Regional Market Share in 2024 latin_america)

    Major Players

    AccuMed, Becton Dickinson, Biological Indicators, Amsino International, Vanguard Health Solutions, Crosstex International, 3M, Halyard Health, MediFlex, Steris, Germitec, ColeParmer, Getinge, Thermo Fisher Scientific

    Market Trends

    The Autoclaves Indicator Tape market is building traction owing to the rising trends of sterilization in health care services. In market’s primary focus infection control as well as monitoring requirement of the sterilization procedures in hospitals and laboratories in particular. A accompanying trend, towards more stringent health regulation, has been the increased demand for reliable indicators of sterilization processes including autoclave indicator tape, which is a pictorial representation of the sterilisation cycle and ensures that the correct and safe processing of the equipment has taken place.

    The increasing emphasis on sterilization protocols in healthcare settings appears to drive the demand for autoclave indicator tape, which serves as a critical component in ensuring effective sterilization processes.

    U.S. Food and Drug Administration (FDA)

    Autoclave Indicator Tape Market Market Drivers

    Market Trends and Projections

    The Global Autoclave Indicator Tape Market Industry is poised for substantial growth, with projections indicating a market value of 0.77 USD Billion in 2024 and an anticipated increase to 1.41 USD Billion by 2035. The compound annual growth rate (CAGR) of 5.6% from 2025 to 2035 suggests a robust expansion trajectory. This growth is likely influenced by various factors, including technological advancements, regulatory compliance, and the increasing demand for sterilization in healthcare settings. The market trends indicate a dynamic landscape, with evolving needs and innovations shaping the future of autoclave indicator tapes.

    Regulatory Compliance and Standards

    Regulatory compliance and adherence to industry standards play a pivotal role in the Global Autoclave Indicator Tape Market Industry. Various health organizations and regulatory bodies mandate the use of reliable sterilization indicators to ensure patient safety and effective infection control. Compliance with these regulations drives healthcare facilities to invest in high-quality autoclave indicator tapes. As the global healthcare landscape continues to emphasize safety protocols, the demand for compliant indicator tapes is expected to rise, further solidifying the market's position. This trend underscores the importance of maintaining rigorous standards in sterilization practices.

    Rising Awareness of Infection Control Practices

    Rising awareness of infection control practices among healthcare professionals and patients significantly impacts the Global Autoclave Indicator Tape Market Industry. Educational initiatives and training programs emphasize the importance of effective sterilization methods in preventing healthcare-associated infections. This heightened awareness leads to increased adoption of autoclave indicator tapes, which provide a visual assurance of sterilization efficacy. As healthcare facilities strive to enhance their infection control measures, the demand for reliable and effective sterilization indicators is expected to grow, contributing to the overall expansion of the market.

    Technological Advancements in Autoclave Systems

    Technological advancements in autoclave systems contribute significantly to the Global Autoclave Indicator Tape Market Industry. Innovations in autoclave technology enhance the efficiency and reliability of sterilization processes, necessitating the use of advanced indicator tapes that can accurately reflect sterilization conditions. As autoclave systems evolve, the integration of sophisticated monitoring features may lead to increased demand for specialized indicator tapes. This evolution is expected to support the market's growth trajectory, with a projected CAGR of 5.6% from 2025 to 2035, indicating a robust future for the industry as it adapts to new technological standards.

    Increasing Demand for Sterilization in Healthcare

    The Global Autoclave Indicator Tape Market Industry experiences a surge in demand driven by the increasing need for sterilization in healthcare settings. Hospitals and clinics are prioritizing infection control measures, leading to a heightened reliance on autoclave processes. This trend is underscored by the projected market value of 0.77 USD Billion in 2024, reflecting a growing awareness of patient safety and hygiene. As healthcare facilities adopt stringent sterilization protocols, the demand for reliable autoclave indicator tape, which provides visual confirmation of sterilization, is likely to rise, thereby propelling market growth.

    Growth of the Pharmaceutical and Biotechnology Sectors

    The growth of the pharmaceutical and biotechnology sectors significantly influences the Global Autoclave Indicator Tape Market Industry. As these sectors expand, the need for sterilization in laboratories and production facilities becomes increasingly critical. Autoclave indicator tapes serve as essential tools in ensuring that sterilization processes are effective, thereby supporting the integrity of pharmaceutical products. The projected market value of 1.41 USD Billion by 2035 highlights the potential for growth driven by these sectors. As the pharmaceutical industry continues to innovate, the demand for reliable sterilization solutions, including indicator tapes, is likely to increase.

    Market Segment Insights

    Autoclave Indicator Tape Market Application Insights

    The Autoclave Indicator Tape Market has shown significant growth, particularly within its Applicationapplication segment encompassing areas such as Medical, Pharmaceutical, and Laboratory sectors. This market segment valuation was recorded at 0.74 USD Billion in 2023 and is expected to grow steadily over the coming years, reflecting a positive trend in the adoption of autoclave indicator tape technology across various applications. The Medical application accounts for a considerable portion of this market, having achieved a value of 0.3 USD Billion in 2023 and projected to rise to 0.48 USD Billion by 2032.

    The increasing emphasis on sterilization procedures in healthcare settings underscores the Medical segment's majority holding as healthcare facilities continually strive for improved infection control measures.In the Pharmaceutical arena, the market was valued at 0.25 USD Billion in 2023, expected to increase to 0.4 USD Billion by 2032. This growth is driven primarily by the stringent regulations surrounding drug manufacturing and the need for reliable sterilization in the production process.

    The significance of Autoclave Indicator Tape in the Pharmaceutical industry lies in its key role in ensuring that equipment and materials used are adequately sterilized before use, thus preventing contamination and ensuring product integrity.The Laboratory segment shows a value of 0.19 USD Billion in 2023, with expectations to grow to 0.32 USD Billion by 2032. While this segment represents the smallest value among the three, it is nonetheless vital, as laboratories often conduct critical research and experiments that require stringent sterilization processes.

    The increasing number of research initiatives and improved laboratory practices contribute to the growth of this segment.Overall, the Autoclave Indicator Tape Market reveals clear drivers for growth across the Application segment, fueled by rising health standards and regulatory requirements. Each of these segments contributes to the overall dynamics of the market, where the Medical application clearly dominates in terms of value due to heightened demands for safety in healthcare.

    The synergy amongst these sectors highlights the importance of autoclave indicator tape as a critical component in achieving effective sterilization protocols, which in turn supports the ongoing advancements in health and safety practices.The combined Autoclave Indicator Tape Market data showcases substantial room for growth, providing opportunities for manufacturers and suppliers to cater to the evolving needs of the Medical, Pharmaceutical, and Laboratory sectors. Given the anticipated growth trajectory, stakeholders can capitalize on emerging trends that reinforce market growth, lay out new strategies, and explore advancements that could strengthen their position in the Autoclave Indicator Tape Market industry.

    Autoclave Indicator Tape Market Material Type Insights

    The Autoclave Indicator Tape Market, valued at 0.74 USD Billion in 2023, showcases a diverse range of material typestypes of integral to its growth. The Material Type segmentation includes Paper, Plastic, and Polyimide, each with its unique properties and applications. Paper-based indicator tapes are widely utilized in many settings due to their cost-effectiveness and suitable performance in autoclave environments. The Plastic variety offers enhanced durability and resistance to moisture, making it essential for long-term storage applications.

    Polyimide tapes, renowned for their high-temperature resistance, play a significant role in specialized applications.By 2032, the market is projected to experience growth as these materials address various industry needs, reflecting the broader trends of increasing sterilization processes in healthcare and laboratory contexts. The Autoclave Indicator Tape Market statistics reveal a robust trajectory, fueled by ongoing advancements in material technology and the rising demand for effective sterilization methods across multiple sectors. Understanding the differentiation among these material types is pivotal, as each contributes uniquely to the overall market dynamics and drives the corresponding market growth.

    Autoclave Indicator Tape Market Indicator Type Insights

    In 2023, the Autoclave Indicator Tape Market wais valued at 0.74 USD Billion, reflecting a growing demand for sterilization processes key in medical and laboratory settings. The market classification around Indicator Type prominently features Temperature Indicators, Chemical Indicators, and Biological Indicators, each with essential roles in ensuring effective sterilization. Temperature Indicators are pivotal as they provide immediate confirmation that the autoclave has reached the required temperature.

    Chemical Indicators, on the other hand, facilitate monitoring through chemical reactions that visually signal whether the necessary conditions were met.Biological Indicators are also significant, as they use living organisms to validate the efficacy of the sterilization process, ensuring safety in healthcare environments. As the market expands, these indicator types collectively cater to heightened safety standards and regulatory compliance, driving further growth. Furthermore, the Autoclave Indicator Tape Market data highlights that these indicators are crucial in building trust in sterilization outcomes, enhancing their dominance in the market.

    Autoclave Indicator Tape Market End Use Insights

    The Autoclave Indicator Tape Market is poised for growth across various end-use sectors, notably Hospitals, Clinics, and Research Institutions. As of 2023, the market is was valued at approximately 0.74 billion USD, reflecting the critical role autoclave indicator tapes play in healthcare and research settings, which ensure the proper sterilization of instruments.

    Hospitals often dominate the market due to their high volume of sterilization processes, adherence to strict health regulations, and the need for efficient infection control measures, making them a significant contributor to market revenue growth.Similarly, Clinics are increasingly adopting these tapes to assure patients of safety standards and uphold cleanliness protocols in smaller settings. Research Institutions also represent an essential segment, highlighting the importance of sterilization in laboratory environments to ensure the accuracy and reliability of experimental results.

    The integration of advanced materials and technologies is likely to enhance the functionalities of autoclave indicator tapes, creating opportunities for innovation and increased adoption in these critical segments of the Autoclave Indicator Tape Market industry.Addressing the challenges of supply chain disruptions and maintaining consistent product quality will be vital for sustained market growth.

    Get more detailed insights about Autoclave Indicator Tape Market Research Report - Global Forecast to 2034

    Regional Insights

    The Autoclave Indicator Tape Market is experiencing expansion, with significant revenue contributions from various regions. In North America, the market reached a valuation of 0.25 USD Billion in 2023 and is expected to grow to 0.4 USD Billion by 2032, indicating a dominant position in the market due to established healthcare infrastructure and high demand for sterilization products.

    Europe follows with a valuation of 0.18 USD Billion in 2023, reflecting an increasing emphasis on laboratory safety and hygiene, growing to 0.3 USD Billion by 2032.The APAC region is witnessing promising growth, valued at 0.2 USD Billion in 2023, as countries invest in healthcare improvements and medical device production, with expectations of reaching 0.35 USD Billion by 2032. South America shows a stable market presence, with a current valuation of 0.05 USD Billion, projected to double to 0.1 USD Billion, as healthcare access improves.

    Meanwhile, the MEA region, though valued at 0.06 USD Billion in 2023, is being increasingly prioritized for healthcare upgrades and sterilization needs, holding a smaller market share expected to decrease slightly to 0.05 USD Billion by 2032.The overall market trends suggest a clear prioritization of sterile environments across multiple industries, driven by ongoing healthcare investments and regulatory standards, contributing to the steady market growth across these regions.

    Source: Primary Research, Secondary Research, Market Research Future Database and Analyst Review

    Key Players and Competitive Insights

    The Autoclave Indicator Tape Market plays a crucial role in ensuring effective sterilization processes across various industries, particularly healthcare and laboratory settings. With the increasing emphasis on sterilization standards and infection control, the market for autoclave indicator tape has experienced significant growth. Companies engaged in this sector are focusing on innovation and the development of high-quality tape that accurately indicates the effectiveness of sterilization processes. The competitive landscape is marked by a diverse range of players, each striving for market share through strategic product launches, partnerships, and enhancements in technology.

    As the demand for reliable sterilization solutions rises, understanding the strengths and market positions of key industry players becomes essential for stakeholders.AccuMed stands out in the Autoclave Indicator Tape Market due to its commitment to quality and reliability. The company has developed a strong reputation for producing high-performance indicator tapes that meet stringent industry standards. AccuMed focuses on delivering products that provide clear visual indications of successful sterilization, which is vital for healthcare providers. Their innovative approaches in product formulation and manufacturing have allowed them to cater to a wide range of sterilization methods, ensuring compatibility with various autoclave systems.

    The company's robust distribution network and customer-centric approach further enhance its presence in the market, enabling it to meet the growing demand from healthcare facilities and laboratories. Overall, AccuMed's emphasis on precision and user satisfaction solidifies its strength in the competitive landscape of the autoclave indicator tape market.Becton Dickinson is another prominent player in the Autoclave Indicator Tape Market, recognized for its advanced healthcare solutions and commitment to patient safety. The company leverages its extensive research and development capabilities to create high-quality autoclave indicator tapes that are dependable and effective.

    Becton Dickinson's strategic investments in technology allow them to stay ahead of market trends and deliver innovative products tailored to the needs of healthcare providers. Their established brand presence, complemented by a strong focus on customer education regarding sterilization practices, positions them favorably within the industry. Additionally, the company's reach enhances accessibility to its products, making Becton Dickinson a key competitor in catering to the increasing demand for reliable sterilization solutions in various healthcare settings.

    Key Companies in the Autoclave Indicator Tape Market market include

    Industry Developments

    Recent developments in the Autoclave Indicator Tape Market have shown notable advancements and activities. Companies such as AccuMed, Becton Dickinson, and 3M are experiencing growth in market valuation due to increasing demand for sterilization solutions in healthcare settings. There are ongoing innovations in product technology, with firms investing in enhanced functionality and eco-friendly materials. Additionally, Amsino International and Vanguard Health Solutions are noted for their collaborations aimed at expanding product reach and improving service delivery. Recent acquisitions have also been reported, such as Steris acquiring Germitec to bolster its portfolio of sterilization products, reinforcing market competition.

    Further, ColeParmer and Getinge are actively pursuing strategic partnerships to enhance market presence and streamline production. The rising need for quality assurance in sterile processing is significantly impacting market growth, prompting companies to elevate their operational standards and expand their offerings. Overall, the interplay of technological advancements and strategic mergers is shaping the future landscape of the Autoclave Indicator Tape Market, indicating a robust trajectory for industry players.

    Future Outlook

    Autoclave Indicator Tape Market Future Outlook

    The Autoclave Indicator Tape Market is projected to grow at a 5.6% CAGR from 2024 to 2035, driven by advancements in sterilization technologies and increasing healthcare standards.

    New opportunities lie in:

    • Develop eco-friendly autoclave tapes to meet sustainability demands.
    • Leverage digital marketing strategies to enhance brand visibility in emerging markets.
    • Innovate product designs for specialized applications in diverse healthcare settings.

    By 2035, the Autoclave Indicator Tape Market is expected to achieve substantial growth, reflecting evolving healthcare needs.

    Market Segmentation

    Autoclave Indicator Tape Market End Use Outlook

    • Hospitals
    • Clinics
    • Research Institutions

    Autoclave Indicator Tape Market Regional Outlook

    • North America
    • Europe
    • South America
    • Asia Pacific
    • Middle East and Africa

    Autoclave Indicator Tape Market Application Outlook

    • Medical
    • Pharmaceutical
    • Laboratory

    Autoclave Indicator Tape Market Material Type Outlook

    • Paper
    • Plastic
    • Polyimide

    Autoclave Indicator Tape Market Indicator Type Outlook

    • Temperature Indicator
    • Chemical Indicator
    • Biological Indicator

    Report Scope

    Attribute/Metric Details
    Market Size 2022 0.7(USD Billion)
    Market Size 2023 0.74(USD Billion)
    Market Size 2032 1.2(USD Billion)
    Compound Annual Growth Rate (CAGR) 5.48% (2024 - 2032)
    Report Coverage Revenue Forecast, Competitive Landscape, Growth Factors, and Trends
    Base Year 2023
    Market Forecast Period 2024 - 2032
    Historical Data 2019 - 2023 2022
    Market Forecast Units USD Billion
    Key Companies Profiled AccuMed, Becton Dickinson, Biological Indicators, Amsino International, Vanguard Health Solutions, Crosstex International, 3M, Halyard Health, MediFlex, Steris, Germitec, ColeParmer, Getinge, Thermo Fisher Scientific
    Segments Covered Application, Material Type, Indicator Type, End Use, Regional
    Key Market Opportunities Rising healthcare sector demand, Increased sterilization processes, Growth in dental practices, Technological advancements in indicators, Expansion in emerging markets
    Key Market Dynamics Growing sterilization requirements, Increasingincreasing healthcare investments, Technological advancements in indicators, Rising awareness of infection control, Expanding applications in various industries
    Countries Covered North America, Europe, APAC, South America, MEA

    Market Highlights

    Author

    Pradeep Nandi
    Senior Research Analyst

    She holds an experience of about 6+ years in market research and business consulting, working under the spectrum of information communication technology, telecommunications and semiconductor domains. aarti conceptualizes and implements a scalable business strategy and provides strategic leadership to the clients. her expertise lies in market estimation, competitive intelligence, pipeline analysis, customer assessment, etc.

    Leave a Comment

    Latest Comments

    John Doe
    john@example.com

    This is a great article! Really helped me understand the topic better.

    Posted on July 23, 2025, 10:15 AM
    Jane Smith
    jane@domain.com

    Thanks for sharing this. I’ve bookmarked it for later reference.

    Posted on July 22, 2025, 7:45 PM

    FAQs

    What is the expected market size of the Autoclave Indicator Tape Market in 2032?

    The Autoclave Indicator Tape Market is expected to reach a size of 1.2 USD Billion by the year 2032.

    What is the compound annual growth rate (CAGR) for the Autoclave Indicator Tape Market from 2024 to 2032?

    The CAGR for the Autoclave Indicator Tape Market is projected to be 5.48% during the period from 2024 to 2032.

    Which region is projected to have the largest market share for the Autoclave Indicator Tape Market in 2032?

    North America is projected to have the largest market share, valued at 0.4 USD Billion in 2032.

    What is the 2023 market value for the Autoclave Indicator Tape Market in the medical application segment?

    The medical application segment of the Autoclave Indicator Tape Market is valued at 0.3 USD Billion in 2023.

    Which key players are major competitors within the Autoclave Indicator Tape Market?

    Key players include AccuMed, Becton Dickinson, 3M, Steris, and Thermo Fisher Scientific among others.

    What is the expected market value for the Autoclave Indicator Tape Market in the pharmaceutical application by 2032?

    The market for the pharmaceutical applicationpharmaceutical applications is expected to reach 0.4 USD Billion by 2032.

    How much is the Autonomous Indicator Tape Market valued at in the APAC region for 2023?

    In the APAC region, the market is valued at 0.2 USD Billion in the year 2023.

    What market growth can be expected for the laboratory application segment from 2024 to 2032?

    The laboratory application segment is expected to grow from 0.19 USD Billion in 2023 to 0.32 USD Billion by 2032.

    What is the projected value of the South American market for Autoclave Indicator Tape in 2032?

    The South American market for Autoclave Indicator Tape is projected to reach 0.1 USD Billion by 2032.

    What challenges might the Autoclave Indicator Tape Market face in the future?

    The market may face challenges such as regulatory changes and supply chain disruptions impacting growth.

    1. List of Tables and Figures
      1. |-
      2. Table of Contents                1. Executive Summary            1.1. Market Overview              1.2. Key Findings              1.3. Market Segmentation              1.4. Competitive Landscape              1.5. Challenges and Opportunities              1.6. Future Outlook                      2. Market Introduction            2.1. Definition              2.2. Scope of the Study                2.2.1. Research Objective                      2.2.2. Assumption                      2.2.3. Limitations                   3. Research Methodology            3.1. Overview              3.2. Data Mining              3.3. Secondary Research              3.4. Primary Research                3.4.1. Primary Interviews and Information Gathering Process                      3.4.2. Breakdown of Primary Respondents                    3.5. Forecasting Model              3.6. Market Size Estimation                3.6.1. Bottom-up Approach                      3.6.2. Top-Down Approach                    3.7. Data Triangulation              3.8. Validation                      4. MARKET DYNAMICS            4.1. Overview              4.2. Drivers              4.3. Restraints              4.4. Opportunities             5. MARKET FACTOR ANALYSIS            5.1. Value chain Analysis              5.2. Porter's Five Forces Analysis                5.2.1. Bargaining Power of Suppliers                      5.2.2. Bargaining Power of Buyers                      5.2.3. Threat of New Entrants                      5.2.4. Threat of Substitutes                      5.2.5. Intensity of Rivalry                    5.3. COVID-19 Impact Analysis                5.3.1. Market Impact Analysis                      5.3.2. Regional Impact                      5.3.3. Opportunity and Threat Analysis                            6. Autoclave Indicator Tape Market, BY Application (USD Billion)            6.1. Medical              6.2. Pharmaceutical              6.3. Laboratory             7. Autoclave Indicator Tape Market, BY Material Type (USD Billion)            7.1. Paper              7.2. Plastic              7.3. Polyimide             8. Autoclave Indicator Tape Market, BY Indicator Type (USD Billion)            8.1. Temperature Indicator              8.2. Chemical Indicator              8.3. Biological Indicator             9. Autoclave Indicator Tape Market, BY End Use (USD Billion)            9.1. Hospitals              9.2. Clinics              9.3. Research Institutions             10. Autoclave Indicator Tape Market, BY Regional (USD Billion)            10.1. North America                10.1.1. US                      10.1.2. Canada                    10.2. Europe                10.2.1. Germany                      10.2.2. UK                      10.2.3. France                      10.2.4. Russia                      10.2.5. Italy                      10.2.6. Spain                      10.2.7. Rest of Europe                    10.3. APAC                10.3.1. China                      10.3.2. India                      10.3.3. Japan                      10.3.4. South Korea                      10.3.5. Malaysia                      10.3.6. Thailand                      10.3.7. Indonesia                      10.3.8. Rest of APAC                    10.4. South America                10.4.1. Brazil                      10.4.2. Mexico                      10.4.3. Argentina                      10.4.4. Rest of South America                    10.5. MEA                10.5.1. GCC Countries                      10.5.2. South Africa                      10.5.3. Rest of MEA                            11. Competitive Landscape            11.1. Overview              11.2. Competitive Analysis              11.3. Market share Analysis              11.4. Major Growth Strategy in the Autoclave Indicator Tape Market              11.5. Competitive Benchmarking              11.6. Leading Players in Terms of Number of Developments in the Autoclave Indicator Tape Market              11.7. Key developments and growth strategies                11.7.1. New Product Launch/Service Deployment                      11.7.2. Merger & Acquisitions                      11.7.3. Joint Ventures                    11.8. Major Players Financial Matrix                 11.8.1. Sales and Operating Income                      11.8.2. Major Players R&D Expenditure. 2023                   12. Company Profiles            12.1. AccuMed                12.1.1. Financial Overview                      12.1.2. Products Offered                      12.1.3. Key Developments                      12.1.4. SWOT Analysis                      12.1.5. Key Strategies                    12.2. Becton Dickinson                12.2.1. Financial Overview                      12.2.2. Products Offered                      12.2.3. Key Developments                      12.2.4. SWOT Analysis                      12.2.5. Key Strategies                    12.3. Biological Indicators                12.3.1. Financial Overview                      12.3.2. Products Offered                      12.3.3. Key Developments                      12.3.4. SWOT Analysis                      12.3.5. Key Strategies                    12.4. Amsino International                12.4.1. Financial Overview                      12.4.2. Products Offered                      12.4.3. Key Developments                      12.4.4. SWOT Analysis                      12.4.5. Key Strategies                    12.5. Vanguard Health Solutions                12.5.1. Financial Overview                      12.5.2. Products Offered                      12.5.3. Key Developments                      12.5.4. SWOT Analysis                      12.5.5. Key Strategies                    12.6. Crosstex International                12.6.1. Financial Overview                      12.6.2. Products Offered                      12.6.3. Key Developments                      12.6.4. SWOT Analysis                      12.6.5. Key Strategies                    12.7. 3M                12.7.1. Financial Overview                      12.7.2. Products Offered                      12.7.3. Key Developments                      12.7.4. SWOT Analysis                      12.7.5. Key Strategies                    12.8. Halyard Health                12.8.1. Financial Overview                      12.8.2. Products Offered                      12.8.3. Key Developments                      12.8.4. SWOT Analysis                      12.8.5. Key Strategies                    12.9. MediFlex                12.9.1. Financial Overview                      12.9.2. Products Offered                      12.9.3. Key Developments                      12.9.4. SWOT Analysis                      12.9.5. Key Strategies                    12.10. Steris                12.10.1. Financial Overview                      12.10.2. Products Offered                      12.10.3. Key Developments                      12.10.4. SWOT Analysis                      12.10.5. Key Strategies                    12.11. Germitec                12.11.1. Financial Overview                      12.11.2. Products Offered                      12.11.3. Key Developments                      12.11.4. SWOT Analysis                      12.11.5. Key Strategies                    12.12. ColeParmer                12.12.1. Financial Overview                      12.12.2. Products Offered                      12.12.3. Key Developments                      12.12.4. SWOT Analysis                      12.12.5. Key Strategies                    12.13. Getinge                12.13.1. Financial Overview                      12.13.2. Products Offered                      12.13.3. Key Developments                      12.13.4. SWOT Analysis                      12.13.5. Key Strategies                    12.14. Thermo Fisher Scientific                12.14.1. Financial Overview                      12.14.2. Products Offered                      12.14.3. Key Developments                      12.14.4. SWOT Analysis                      12.14.5. Key Strategies                   13. Appendix            13.1. References              13.2. Related Reports         LIST Of tables      
      3. Table 1. LIST OF ASSUMPTIONS       
      4. Table 2. North America Autoclave Indicator Tape Market SIZE ESTIMATES & FORECAST, BY APPLICATION, 2019-2032 (USD Billions)       
      5. Table 3. North America Autoclave Indicator Tape Market SIZE ESTIMATES & FORECAST, BY MATERIAL TYPE, 2019-2032 (USD Billions)       
      6. Table 4. North America Autoclave Indicator Tape Market SIZE ESTIMATES & FORECAST, BY INDICATOR TYPE, 2019-2032 (USD Billions)       
      7. Table 5. North America Autoclave Indicator Tape Market SIZE ESTIMATES & FORECAST, BY END USE, 2019-2032 (USD Billions)       
      8. Table 6. North America Autoclave Indicator Tape Market SIZE ESTIMATES & FORECAST, BY REGIONAL, 2019-2032 (USD Billions)       
      9. Table 7. US Autoclave Indicator Tape Market SIZE ESTIMATES & FORECAST, BY APPLICATION, 2019-2032 (USD Billions)       
      10. Table 8. US Autoclave Indicator Tape Market SIZE ESTIMATES & FORECAST, BY MATERIAL TYPE, 2019-2032 (USD Billions)       
      11. Table 9. US Autoclave Indicator Tape Market SIZE ESTIMATES & FORECAST, BY INDICATOR TYPE, 2019-2032 (USD Billions)       
      12. Table 10. US Autoclave Indicator Tape Market SIZE ESTIMATES & FORECAST, BY END USE, 2019-2032 (USD Billions)       
      13. Table 11. US Autoclave Indicator Tape Market SIZE ESTIMATES & FORECAST, BY REGIONAL, 2019-2032 (USD Billions)       
      14. Table 12. Canada Autoclave Indicator Tape Market SIZE ESTIMATES & FORECAST, BY APPLICATION, 2019-2032 (USD Billions)       
      15. Table 13. Canada Autoclave Indicator Tape Market SIZE ESTIMATES & FORECAST, BY MATERIAL TYPE, 2019-2032 (USD Billions)       
      16. Table 14. Canada Autoclave Indicator Tape Market SIZE ESTIMATES & FORECAST, BY INDICATOR TYPE, 2019-2032 (USD Billions)       
      17. Table 15. Canada Autoclave Indicator Tape Market SIZE ESTIMATES & FORECAST, BY END USE, 2019-2032 (USD Billions)       
      18. Table 16. Canada Autoclave Indicator Tape Market SIZE ESTIMATES & FORECAST, BY REGIONAL, 2019-2032 (USD Billions)       
      19. Table 17. Europe Autoclave Indicator Tape Market SIZE ESTIMATES & FORECAST, BY APPLICATION, 2019-2032 (USD Billions)       
      20. Table 18. Europe Autoclave Indicator Tape Market SIZE ESTIMATES & FORECAST, BY MATERIAL TYPE, 2019-2032 (USD Billions)       
      21. Table 19. Europe Autoclave Indicator Tape Market SIZE ESTIMATES & FORECAST, BY INDICATOR TYPE, 2019-2032 (USD Billions)       
      22. Table 20. Europe Autoclave Indicator Tape Market SIZE ESTIMATES & FORECAST, BY END USE, 2019-2032 (USD Billions)       
      23. Table 21. Europe Autoclave Indicator Tape Market SIZE ESTIMATES & FORECAST, BY REGIONAL, 2019-2032 (USD Billions)       
      24. Table 22. Germany Autoclave Indicator Tape Market SIZE ESTIMATES & FORECAST, BY APPLICATION, 2019-2032 (USD Billions)       
      25. Table 23. Germany Autoclave Indicator Tape Market SIZE ESTIMATES & FORECAST, BY MATERIAL TYPE, 2019-2032 (USD Billions)       
      26. Table 24. Germany Autoclave Indicator Tape Market SIZE ESTIMATES & FORECAST, BY INDICATOR TYPE, 2019-2032 (USD Billions)       
      27. Table 25. Germany Autoclave Indicator Tape Market SIZE ESTIMATES & FORECAST, BY END USE, 2019-2032 (USD Billions)       
      28. Table 26. Germany Autoclave Indicator Tape Market SIZE ESTIMATES & FORECAST, BY REGIONAL, 2019-2032 (USD Billions)       
      29. Table 27. UK Autoclave Indicator Tape Market SIZE ESTIMATES & FORECAST, BY APPLICATION, 2019-2032 (USD Billions)       
      30. Table 28. UK Autoclave Indicator Tape Market SIZE ESTIMATES & FORECAST, BY MATERIAL TYPE, 2019-2032 (USD Billions)       
      31. Table 29. UK Autoclave Indicator Tape Market SIZE ESTIMATES & FORECAST, BY INDICATOR TYPE, 2019-2032 (USD Billions)       
      32. Table 30. UK Autoclave Indicator Tape Market SIZE ESTIMATES & FORECAST, BY END USE, 2019-2032 (USD Billions)       
      33. Table 31. UK Autoclave Indicator Tape Market SIZE ESTIMATES & FORECAST, BY REGIONAL, 2019-2032 (USD Billions)       
      34. Table 32. France Autoclave Indicator Tape Market SIZE ESTIMATES & FORECAST, BY APPLICATION, 2019-2032 (USD Billions)       
      35. Table 33. France Autoclave Indicator Tape Market SIZE ESTIMATES & FORECAST, BY MATERIAL TYPE, 2019-2032 (USD Billions)       
      36. Table 34. France Autoclave Indicator Tape Market SIZE ESTIMATES & FORECAST, BY INDICATOR TYPE, 2019-2032 (USD Billions)       
      37. Table 35. France Autoclave Indicator Tape Market SIZE ESTIMATES & FORECAST, BY END USE, 2019-2032 (USD Billions)       
      38. Table 36. France Autoclave Indicator Tape Market SIZE ESTIMATES & FORECAST, BY REGIONAL, 2019-2032 (USD Billions)       
      39. Table 37. Russia Autoclave Indicator Tape Market SIZE ESTIMATES & FORECAST, BY APPLICATION, 2019-2032 (USD Billions)       
      40. Table 38. Russia Autoclave Indicator Tape Market SIZE ESTIMATES & FORECAST, BY MATERIAL TYPE, 2019-2032 (USD Billions)       
      41. Table 39. Russia Autoclave Indicator Tape Market SIZE ESTIMATES & FORECAST, BY INDICATOR TYPE, 2019-2032 (USD Billions)       
      42. Table 40. Russia Autoclave Indicator Tape Market SIZE ESTIMATES & FORECAST, BY END USE, 2019-2032 (USD Billions)       
      43. Table 41. Russia Autoclave Indicator Tape Market SIZE ESTIMATES & FORECAST, BY REGIONAL, 2019-2032 (USD Billions)       
      44. Table 42. Italy Autoclave Indicator Tape Market SIZE ESTIMATES & FORECAST, BY APPLICATION, 2019-2032 (USD Billions)       
      45. Table 43. Italy Autoclave Indicator Tape Market SIZE ESTIMATES & FORECAST, BY MATERIAL TYPE, 2019-2032 (USD Billions)       
      46. Table 44. Italy Autoclave Indicator Tape Market SIZE ESTIMATES & FORECAST, BY INDICATOR TYPE, 2019-2032 (USD Billions)       
      47. Table 45. Italy Autoclave Indicator Tape Market SIZE ESTIMATES & FORECAST, BY END USE, 2019-2032 (USD Billions)       
      48. Table 46. Italy Autoclave Indicator Tape Market SIZE ESTIMATES & FORECAST, BY REGIONAL, 2019-2032 (USD Billions)       
      49. Table 47. Spain Autoclave Indicator Tape Market SIZE ESTIMATES & FORECAST, BY APPLICATION, 2019-2032 (USD Billions)       
      50. Table 48. Spain Autoclave Indicator Tape Market SIZE ESTIMATES & FORECAST, BY MATERIAL TYPE, 2019-2032 (USD Billions)       
      51. Table 49. Spain Autoclave Indicator Tape Market SIZE ESTIMATES & FORECAST, BY INDICATOR TYPE, 2019-2032 (USD Billions)       
      52. Table 50. Spain Autoclave Indicator Tape Market SIZE ESTIMATES & FORECAST, BY END USE, 2019-2032 (USD Billions)       
      53. Table 51. Spain Autoclave Indicator Tape Market SIZE ESTIMATES & FORECAST, BY REGIONAL, 2019-2032 (USD Billions)       
      54. Table 52. Rest of Europe Autoclave Indicator Tape Market SIZE ESTIMATES & FORECAST, BY APPLICATION, 2019-2032 (USD Billions)       
      55. Table 53. Rest of Europe Autoclave Indicator Tape Market SIZE ESTIMATES & FORECAST, BY MATERIAL TYPE, 2019-2032 (USD Billions)       
      56. Table 54. Rest of Europe Autoclave Indicator Tape Market SIZE ESTIMATES & FORECAST, BY INDICATOR TYPE, 2019-2032 (USD Billions)       
      57. Table 55. Rest of Europe Autoclave Indicator Tape Market SIZE ESTIMATES & FORECAST, BY END USE, 2019-2032 (USD Billions)       
      58. Table 56. Rest of Europe Autoclave Indicator Tape Market SIZE ESTIMATES & FORECAST, BY REGIONAL, 2019-2032 (USD Billions)       
      59. Table 57. APAC Autoclave Indicator Tape Market SIZE ESTIMATES & FORECAST, BY APPLICATION, 2019-2032 (USD Billions)       
      60. Table 58. APAC Autoclave Indicator Tape Market SIZE ESTIMATES & FORECAST, BY MATERIAL TYPE, 2019-2032 (USD Billions)       
      61. Table 59. APAC Autoclave Indicator Tape Market SIZE ESTIMATES & FORECAST, BY INDICATOR TYPE, 2019-2032 (USD Billions)       
      62. Table 60. APAC Autoclave Indicator Tape Market SIZE ESTIMATES & FORECAST, BY END USE, 2019-2032 (USD Billions)       
      63. Table 61. APAC Autoclave Indicator Tape Market SIZE ESTIMATES & FORECAST, BY REGIONAL, 2019-2032 (USD Billions)       
      64. Table 62. China Autoclave Indicator Tape Market SIZE ESTIMATES & FORECAST, BY APPLICATION, 2019-2032 (USD Billions)       
      65. Table 63. China Autoclave Indicator Tape Market SIZE ESTIMATES & FORECAST, BY MATERIAL TYPE, 2019-2032 (USD Billions)       
      66. Table 64. China Autoclave Indicator Tape Market SIZE ESTIMATES & FORECAST, BY INDICATOR TYPE, 2019-2032 (USD Billions)       
      67. Table 65. China Autoclave Indicator Tape Market SIZE ESTIMATES & FORECAST, BY END USE, 2019-2032 (USD Billions)       
      68. Table 66. China Autoclave Indicator Tape Market SIZE ESTIMATES & FORECAST, BY REGIONAL, 2019-2032 (USD Billions)       
      69. Table 67. India Autoclave Indicator Tape Market SIZE ESTIMATES & FORECAST, BY APPLICATION, 2019-2032 (USD Billions)       
      70. Table 68. India Autoclave Indicator Tape Market SIZE ESTIMATES & FORECAST, BY MATERIAL TYPE, 2019-2032 (USD Billions)       
      71. Table 69. India Autoclave Indicator Tape Market SIZE ESTIMATES & FORECAST, BY INDICATOR TYPE, 2019-2032 (USD Billions)       
      72. Table 70. India Autoclave Indicator Tape Market SIZE ESTIMATES & FORECAST, BY END USE, 2019-2032 (USD Billions)       
      73. Table 71. India Autoclave Indicator Tape Market SIZE ESTIMATES & FORECAST, BY REGIONAL, 2019-2032 (USD Billions)       
      74. Table 72. Japan Autoclave Indicator Tape Market SIZE ESTIMATES & FORECAST, BY APPLICATION, 2019-2032 (USD Billions)       
      75. Table 73. Japan Autoclave Indicator Tape Market SIZE ESTIMATES & FORECAST, BY MATERIAL TYPE, 2019-2032 (USD Billions)       
      76. Table 74. Japan Autoclave Indicator Tape Market SIZE ESTIMATES & FORECAST, BY INDICATOR TYPE, 2019-2032 (USD Billions)       
      77. Table 75. Japan Autoclave Indicator Tape Market SIZE ESTIMATES & FORECAST, BY END USE, 2019-2032 (USD Billions)       
      78. Table 76. Japan Autoclave Indicator Tape Market SIZE ESTIMATES & FORECAST, BY REGIONAL, 2019-2032 (USD Billions)       
      79. Table 77. South Korea Autoclave Indicator Tape Market SIZE ESTIMATES & FORECAST, BY APPLICATION, 2019-2032 (USD Billions)       
      80. Table 78. South Korea Autoclave Indicator Tape Market SIZE ESTIMATES & FORECAST, BY MATERIAL TYPE, 2019-2032 (USD Billions)       
      81. Table 79. South Korea Autoclave Indicator Tape Market SIZE ESTIMATES & FORECAST, BY INDICATOR TYPE, 2019-2032 (USD Billions)       
      82. Table 80. South Korea Autoclave Indicator Tape Market SIZE ESTIMATES & FORECAST, BY END USE, 2019-2032 (USD Billions)       
      83. Table 81. South Korea Autoclave Indicator Tape Market SIZE ESTIMATES & FORECAST, BY REGIONAL, 2019-2032 (USD Billions)       
      84. Table 82. Malaysia Autoclave Indicator Tape Market SIZE ESTIMATES & FORECAST, BY APPLICATION, 2019-2032 (USD Billions)       
      85. Table 83. Malaysia Autoclave Indicator Tape Market SIZE ESTIMATES & FORECAST, BY MATERIAL TYPE, 2019-2032 (USD Billions)       
      86. Table 84. Malaysia Autoclave Indicator Tape Market SIZE ESTIMATES & FORECAST, BY INDICATOR TYPE, 2019-2032 (USD Billions)       
      87. Table 85. Malaysia Autoclave Indicator Tape Market SIZE ESTIMATES & FORECAST, BY END USE, 2019-2032 (USD Billions)       
      88. Table 86. Malaysia Autoclave Indicator Tape Market SIZE ESTIMATES & FORECAST, BY REGIONAL, 2019-2032 (USD Billions)       
      89. Table 87. Thailand Autoclave Indicator Tape Market SIZE ESTIMATES & FORECAST, BY APPLICATION, 2019-2032 (USD Billions)       
      90. Table 88. Thailand Autoclave Indicator Tape Market SIZE ESTIMATES & FORECAST, BY MATERIAL TYPE, 2019-2032 (USD Billions)       
      91. Table 89. Thailand Autoclave Indicator Tape Market SIZE ESTIMATES & FORECAST, BY INDICATOR TYPE, 2019-2032 (USD Billions)       
      92. Table 90. Thailand Autoclave Indicator Tape Market SIZE ESTIMATES & FORECAST, BY END USE, 2019-2032 (USD Billions)       
      93. Table 91. Thailand Autoclave Indicator Tape Market SIZE ESTIMATES & FORECAST, BY REGIONAL, 2019-2032 (USD Billions)       
      94. Table 92. Indonesia Autoclave Indicator Tape Market SIZE ESTIMATES & FORECAST, BY APPLICATION, 2019-2032 (USD Billions)       
      95. Table 93. Indonesia Autoclave Indicator Tape Market SIZE ESTIMATES & FORECAST, BY MATERIAL TYPE, 2019-2032 (USD Billions)       
      96. Table 94. Indonesia Autoclave Indicator Tape Market SIZE ESTIMATES & FORECAST, BY INDICATOR TYPE, 2019-2032 (USD Billions)       
      97. Table 95. Indonesia Autoclave Indicator Tape Market SIZE ESTIMATES & FORECAST, BY END USE, 2019-2032 (USD Billions)       
      98. Table 96. Indonesia Autoclave Indicator Tape Market SIZE ESTIMATES & FORECAST, BY REGIONAL, 2019-2032 (USD Billions)       
      99. Table 97. Rest of APAC Autoclave Indicator Tape Market SIZE ESTIMATES & FORECAST, BY APPLICATION, 2019-2032 (USD Billions)       
      100. Table 98. Rest of APAC Autoclave Indicator Tape Market SIZE ESTIMATES & FORECAST, BY MATERIAL TYPE, 2019-2032 (USD Billions)       
      101. Table 99. Rest of APAC Autoclave Indicator Tape Market SIZE ESTIMATES & FORECAST, BY INDICATOR TYPE, 2019-2032 (USD Billions)       
      102. Table 100. Rest of APAC Autoclave Indicator Tape Market SIZE ESTIMATES & FORECAST, BY END USE, 2019-2032 (USD Billions)       
      103. Table 101. Rest of APAC Autoclave Indicator Tape Market SIZE ESTIMATES & FORECAST, BY REGIONAL, 2019-2032 (USD Billions)       
      104. Table 102. South America Autoclave Indicator Tape Market SIZE ESTIMATES & FORECAST, BY APPLICATION, 2019-2032 (USD Billions)       
      105. Table 103. South America Autoclave Indicator Tape Market SIZE ESTIMATES & FORECAST, BY MATERIAL TYPE, 2019-2032 (USD Billions)       
      106. Table 104. South America Autoclave Indicator Tape Market SIZE ESTIMATES & FORECAST, BY INDICATOR TYPE, 2019-2032 (USD Billions)       
      107. Table 105. South America Autoclave Indicator Tape Market SIZE ESTIMATES & FORECAST, BY END USE, 2019-2032 (USD Billions)       
      108. Table 106. South America Autoclave Indicator Tape Market SIZE ESTIMATES & FORECAST, BY REGIONAL, 2019-2032 (USD Billions)       
      109. Table 107. Brazil Autoclave Indicator Tape Market SIZE ESTIMATES & FORECAST, BY APPLICATION, 2019-2032 (USD Billions)       
      110. Table 108. Brazil Autoclave Indicator Tape Market SIZE ESTIMATES & FORECAST, BY MATERIAL TYPE, 2019-2032 (USD Billions)       
      111. Table 109. Brazil Autoclave Indicator Tape Market SIZE ESTIMATES & FORECAST, BY INDICATOR TYPE, 2019-2032 (USD Billions)       
      112. Table 110. Brazil Autoclave Indicator Tape Market SIZE ESTIMATES & FORECAST, BY END USE, 2019-2032 (USD Billions)       
      113. Table 111. Brazil Autoclave Indicator Tape Market SIZE ESTIMATES & FORECAST, BY REGIONAL, 2019-2032 (USD Billions)       
      114. Table 112. Mexico Autoclave Indicator Tape Market SIZE ESTIMATES & FORECAST, BY APPLICATION, 2019-2032 (USD Billions)       
      115. Table 113. Mexico Autoclave Indicator Tape Market SIZE ESTIMATES & FORECAST, BY MATERIAL TYPE, 2019-2032 (USD Billions)       
      116. Table 114. Mexico Autoclave Indicator Tape Market SIZE ESTIMATES & FORECAST, BY INDICATOR TYPE, 2019-2032 (USD Billions)       
      117. Table 115. Mexico Autoclave Indicator Tape Market SIZE ESTIMATES & FORECAST, BY END USE, 2019-2032 (USD Billions)       
      118. Table 116. Mexico Autoclave Indicator Tape Market SIZE ESTIMATES & FORECAST, BY REGIONAL, 2019-2032 (USD Billions)       
      119. Table 117. Argentina Autoclave Indicator Tape Market SIZE ESTIMATES & FORECAST, BY APPLICATION, 2019-2032 (USD Billions)       
      120. Table 118. Argentina Autoclave Indicator Tape Market SIZE ESTIMATES & FORECAST, BY MATERIAL TYPE, 2019-2032 (USD Billions)       
      121. Table 119. Argentina Autoclave Indicator Tape Market SIZE ESTIMATES & FORECAST, BY INDICATOR TYPE, 2019-2032 (USD Billions)       
      122. Table 120. Argentina Autoclave Indicator Tape Market SIZE ESTIMATES & FORECAST, BY END USE, 2019-2032 (USD Billions)       
      123. Table 121. Argentina Autoclave Indicator Tape Market SIZE ESTIMATES & FORECAST, BY REGIONAL, 2019-2032 (USD Billions)       
      124. Table 122. Rest of South America Autoclave Indicator Tape Market SIZE ESTIMATES & FORECAST, BY APPLICATION, 2019-2032 (USD Billions)       
      125. Table 123. Rest of South America Autoclave Indicator Tape Market SIZE ESTIMATES & FORECAST, BY MATERIAL TYPE, 2019-2032 (USD Billions)       
      126. Table 124. Rest of South America Autoclave Indicator Tape Market SIZE ESTIMATES & FORECAST, BY INDICATOR TYPE, 2019-2032 (USD Billions)       
      127. Table 125. Rest of South America Autoclave Indicator Tape Market SIZE ESTIMATES & FORECAST, BY END USE, 2019-2032 (USD Billions)       
      128. Table 126. Rest of South America Autoclave Indicator Tape Market SIZE ESTIMATES & FORECAST, BY REGIONAL, 2019-2032 (USD Billions)       
      129. Table 127. MEA Autoclave Indicator Tape Market SIZE ESTIMATES & FORECAST, BY APPLICATION, 2019-2032 (USD Billions)       
      130. Table 128. MEA Autoclave Indicator Tape Market SIZE ESTIMATES & FORECAST, BY MATERIAL TYPE, 2019-2032 (USD Billions)       
      131. Table 129. MEA Autoclave Indicator Tape Market SIZE ESTIMATES & FORECAST, BY INDICATOR TYPE, 2019-2032 (USD Billions)       
      132. Table 130. MEA Autoclave Indicator Tape Market SIZE ESTIMATES & FORECAST, BY END USE, 2019-2032 (USD Billions)       
      133. Table 131. MEA Autoclave Indicator Tape Market SIZE ESTIMATES & FORECAST, BY REGIONAL, 2019-2032 (USD Billions)       
      134. Table 132. GCC Countries Autoclave Indicator Tape Market SIZE ESTIMATES & FORECAST, BY APPLICATION, 2019-2032 (USD Billions)       
      135. Table 133. GCC Countries Autoclave Indicator Tape Market SIZE ESTIMATES & FORECAST, BY MATERIAL TYPE, 2019-2032 (USD Billions)       
      136. Table 134. GCC Countries Autoclave Indicator Tape Market SIZE ESTIMATES & FORECAST, BY INDICATOR TYPE, 2019-2032 (USD Billions)       
      137. Table 135. GCC Countries Autoclave Indicator Tape Market SIZE ESTIMATES & FORECAST, BY END USE, 2019-2032 (USD Billions)       
      138. Table 136. GCC Countries Autoclave Indicator Tape Market SIZE ESTIMATES & FORECAST, BY REGIONAL, 2019-2032 (USD Billions)       
      139. Table 137. South Africa Autoclave Indicator Tape Market SIZE ESTIMATES & FORECAST, BY APPLICATION, 2019-2032 (USD Billions)       
      140. Table 138. South Africa Autoclave Indicator Tape Market SIZE ESTIMATES & FORECAST, BY MATERIAL TYPE, 2019-2032 (USD Billions)       
      141. Table 139. South Africa Autoclave Indicator Tape Market SIZE ESTIMATES & FORECAST, BY INDICATOR TYPE, 2019-2032 (USD Billions)       
      142. Table 140. South Africa Autoclave Indicator Tape Market SIZE ESTIMATES & FORECAST, BY END USE, 2019-2032 (USD Billions)       
      143. Table 141. South Africa Autoclave Indicator Tape Market SIZE ESTIMATES & FORECAST, BY REGIONAL, 2019-2032 (USD Billions)       
      144. Table 142. Rest of MEA Autoclave Indicator Tape Market SIZE ESTIMATES & FORECAST, BY APPLICATION, 2019-2032 (USD Billions)       
      145. Table 143. Rest of MEA Autoclave Indicator Tape Market SIZE ESTIMATES & FORECAST, BY MATERIAL TYPE, 2019-2032 (USD Billions)       
      146. Table 144. Rest of MEA Autoclave Indicator Tape Market SIZE ESTIMATES & FORECAST, BY INDICATOR TYPE, 2019-2032 (USD Billions)       
      147. Table 145. Rest of MEA Autoclave Indicator Tape Market SIZE ESTIMATES & FORECAST, BY END USE, 2019-2032 (USD Billions)       
      148. Table 146. Rest of MEA Autoclave Indicator Tape Market SIZE ESTIMATES & FORECAST, BY REGIONAL, 2019-2032 (USD Billions)       
      149. Table 147. PRODUCT LAUNCH/PRODUCT DEVELOPMENT/APPROVAL       
      150. Table 148. ACQUISITION/PARTNERSHIP        LIST Of figures      
      151. Figure 1. MARKET SYNOPSIS     
      152. Figure 2. NORTH AMERICA AUTOCLAVE INDICATOR TAPE MARKET ANALYSIS     
      153. Figure 3. US AUTOCLAVE INDICATOR TAPE MARKET ANALYSIS BY APPLICATION     
      154. Figure 4. US AUTOCLAVE INDICATOR TAPE MARKET ANALYSIS BY MATERIAL TYPE     
      155. Figure 5. US AUTOCLAVE INDICATOR TAPE MARKET ANALYSIS BY INDICATOR TYPE     
      156. Figure 6. US AUTOCLAVE INDICATOR TAPE MARKET ANALYSIS BY END USE     
      157. Figure 7. US AUTOCLAVE INDICATOR TAPE MARKET ANALYSIS BY REGIONAL     
      158. Figure 8. CANADA AUTOCLAVE INDICATOR TAPE MARKET ANALYSIS BY APPLICATION     
      159. Figure 9. CANADA AUTOCLAVE INDICATOR TAPE MARKET ANALYSIS BY MATERIAL TYPE     
      160. Figure 10. CANADA AUTOCLAVE INDICATOR TAPE MARKET ANALYSIS BY INDICATOR TYPE     
      161. Figure 11. CANADA AUTOCLAVE INDICATOR TAPE MARKET ANALYSIS BY END USE     
      162. Figure 12. CANADA AUTOCLAVE INDICATOR TAPE MARKET ANALYSIS BY REGIONAL     
      163. Figure 13. EUROPE AUTOCLAVE INDICATOR TAPE MARKET ANALYSIS     
      164. Figure 14. GERMANY AUTOCLAVE INDICATOR TAPE MARKET ANALYSIS BY APPLICATION     
      165. Figure 15. GERMANY AUTOCLAVE INDICATOR TAPE MARKET ANALYSIS BY MATERIAL TYPE     
      166. Figure 16. GERMANY AUTOCLAVE INDICATOR TAPE MARKET ANALYSIS BY INDICATOR TYPE     
      167. Figure 17. GERMANY AUTOCLAVE INDICATOR TAPE MARKET ANALYSIS BY END USE     
      168. Figure 18. GERMANY AUTOCLAVE INDICATOR TAPE MARKET ANALYSIS BY REGIONAL     
      169. Figure 19. UK AUTOCLAVE INDICATOR TAPE MARKET ANALYSIS BY APPLICATION     
      170. Figure 20. UK AUTOCLAVE INDICATOR TAPE MARKET ANALYSIS BY MATERIAL TYPE     
      171. Figure 21. UK AUTOCLAVE INDICATOR TAPE MARKET ANALYSIS BY INDICATOR TYPE     
      172. Figure 22. UK AUTOCLAVE INDICATOR TAPE MARKET ANALYSIS BY END USE     
      173. Figure 23. UK AUTOCLAVE INDICATOR TAPE MARKET ANALYSIS BY REGIONAL     
      174. Figure 24. FRANCE AUTOCLAVE INDICATOR TAPE MARKET ANALYSIS BY APPLICATION     
      175. Figure 25. FRANCE AUTOCLAVE INDICATOR TAPE MARKET ANALYSIS BY MATERIAL TYPE     
      176. Figure 26. FRANCE AUTOCLAVE INDICATOR TAPE MARKET ANALYSIS BY INDICATOR TYPE     
      177. Figure 27. FRANCE AUTOCLAVE INDICATOR TAPE MARKET ANALYSIS BY END USE     
      178. Figure 28. FRANCE AUTOCLAVE INDICATOR TAPE MARKET ANALYSIS BY REGIONAL     
      179. Figure 29. RUSSIA AUTOCLAVE INDICATOR TAPE MARKET ANALYSIS BY APPLICATION     
      180. Figure 30. RUSSIA AUTOCLAVE INDICATOR TAPE MARKET ANALYSIS BY MATERIAL TYPE     
      181. Figure 31. RUSSIA AUTOCLAVE INDICATOR TAPE MARKET ANALYSIS BY INDICATOR TYPE     
      182. Figure 32. RUSSIA AUTOCLAVE INDICATOR TAPE MARKET ANALYSIS BY END USE     
      183. Figure 33. RUSSIA AUTOCLAVE INDICATOR TAPE MARKET ANALYSIS BY REGIONAL     
      184. Figure 34. ITALY AUTOCLAVE INDICATOR TAPE MARKET ANALYSIS BY APPLICATION     
      185. Figure 35. ITALY AUTOCLAVE INDICATOR TAPE MARKET ANALYSIS BY MATERIAL TYPE     
      186. Figure 36. ITALY AUTOCLAVE INDICATOR TAPE MARKET ANALYSIS BY INDICATOR TYPE     
      187. Figure 37. ITALY AUTOCLAVE INDICATOR TAPE MARKET ANALYSIS BY END USE     
      188. Figure 38. ITALY AUTOCLAVE INDICATOR TAPE MARKET ANALYSIS BY REGIONAL     
      189. Figure 39. SPAIN AUTOCLAVE INDICATOR TAPE MARKET ANALYSIS BY APPLICATION     
      190. Figure 40. SPAIN AUTOCLAVE INDICATOR TAPE MARKET ANALYSIS BY MATERIAL TYPE     
      191. Figure 41. SPAIN AUTOCLAVE INDICATOR TAPE MARKET ANALYSIS BY INDICATOR TYPE     
      192. Figure 42. SPAIN AUTOCLAVE INDICATOR TAPE MARKET ANALYSIS BY END USE     
      193. Figure 43. SPAIN AUTOCLAVE INDICATOR TAPE MARKET ANALYSIS BY REGIONAL     
      194. Figure 44. REST OF EUROPE AUTOCLAVE INDICATOR TAPE MARKET ANALYSIS BY APPLICATION     
      195. Figure 45. REST OF EUROPE AUTOCLAVE INDICATOR TAPE MARKET ANALYSIS BY MATERIAL TYPE     
      196. Figure 46. REST OF EUROPE AUTOCLAVE INDICATOR TAPE MARKET ANALYSIS BY INDICATOR TYPE     
      197. Figure 47. REST OF EUROPE AUTOCLAVE INDICATOR TAPE MARKET ANALYSIS BY END USE     
      198. Figure 48. REST OF EUROPE AUTOCLAVE INDICATOR TAPE MARKET ANALYSIS BY REGIONAL     
      199. Figure 49. APAC AUTOCLAVE INDICATOR TAPE MARKET ANALYSIS     
      200. Figure 50. CHINA AUTOCLAVE INDICATOR TAPE MARKET ANALYSIS BY APPLICATION     
      201. Figure 51. CHINA AUTOCLAVE INDICATOR TAPE MARKET ANALYSIS BY MATERIAL TYPE     
      202. Figure 52. CHINA AUTOCLAVE INDICATOR TAPE MARKET ANALYSIS BY INDICATOR TYPE     
      203. Figure 53. CHINA AUTOCLAVE INDICATOR TAPE MARKET ANALYSIS BY END USE     
      204. Figure 54. CHINA AUTOCLAVE INDICATOR TAPE MARKET ANALYSIS BY REGIONAL     
      205. Figure 55. INDIA AUTOCLAVE INDICATOR TAPE MARKET ANALYSIS BY APPLICATION     
      206. Figure 56. INDIA AUTOCLAVE INDICATOR TAPE MARKET ANALYSIS BY MATERIAL TYPE     
      207. Figure 57. INDIA AUTOCLAVE INDICATOR TAPE MARKET ANALYSIS BY INDICATOR TYPE     
      208. Figure 58. INDIA AUTOCLAVE INDICATOR TAPE MARKET ANALYSIS BY END USE     
      209. Figure 59. INDIA AUTOCLAVE INDICATOR TAPE MARKET ANALYSIS BY REGIONAL     
      210. Figure 60. JAPAN AUTOCLAVE INDICATOR TAPE MARKET ANALYSIS BY APPLICATION     
      211. Figure 61. JAPAN AUTOCLAVE INDICATOR TAPE MARKET ANALYSIS BY MATERIAL TYPE     
      212. Figure 62. JAPAN AUTOCLAVE INDICATOR TAPE MARKET ANALYSIS BY INDICATOR TYPE     
      213. Figure 63. JAPAN AUTOCLAVE INDICATOR TAPE MARKET ANALYSIS BY END USE     
      214. Figure 64. JAPAN AUTOCLAVE INDICATOR TAPE MARKET ANALYSIS BY REGIONAL     
      215. Figure 65. SOUTH KOREA AUTOCLAVE INDICATOR TAPE MARKET ANALYSIS BY APPLICATION     
      216. Figure 66. SOUTH KOREA AUTOCLAVE INDICATOR TAPE MARKET ANALYSIS BY MATERIAL TYPE     
      217. Figure 67. SOUTH KOREA AUTOCLAVE INDICATOR TAPE MARKET ANALYSIS BY INDICATOR TYPE     
      218. Figure 68. SOUTH KOREA AUTOCLAVE INDICATOR TAPE MARKET ANALYSIS BY END USE     
      219. Figure 69. SOUTH KOREA AUTOCLAVE INDICATOR TAPE MARKET ANALYSIS BY REGIONAL     
      220. Figure 70. MALAYSIA AUTOCLAVE INDICATOR TAPE MARKET ANALYSIS BY APPLICATION     
      221. Figure 71. MALAYSIA AUTOCLAVE INDICATOR TAPE MARKET ANALYSIS BY MATERIAL TYPE     
      222. Figure 72. MALAYSIA AUTOCLAVE INDICATOR TAPE MARKET ANALYSIS BY INDICATOR TYPE     
      223. Figure 73. MALAYSIA AUTOCLAVE INDICATOR TAPE MARKET ANALYSIS BY END USE     
      224. Figure 74. MALAYSIA AUTOCLAVE INDICATOR TAPE MARKET ANALYSIS BY REGIONAL     
      225. Figure 75. THAILAND AUTOCLAVE INDICATOR TAPE MARKET ANALYSIS BY APPLICATION     
      226. Figure 76. THAILAND AUTOCLAVE INDICATOR TAPE MARKET ANALYSIS BY MATERIAL TYPE     
      227. Figure 77. THAILAND AUTOCLAVE INDICATOR TAPE MARKET ANALYSIS BY INDICATOR TYPE     
      228. Figure 78. THAILAND AUTOCLAVE INDICATOR TAPE MARKET ANALYSIS BY END USE     
      229. Figure 79. THAILAND AUTOCLAVE INDICATOR TAPE MARKET ANALYSIS BY REGIONAL     
      230. Figure 80. INDONESIA AUTOCLAVE INDICATOR TAPE MARKET ANALYSIS BY APPLICATION     
      231. Figure 81. INDONESIA AUTOCLAVE INDICATOR TAPE MARKET ANALYSIS BY MATERIAL TYPE     
      232. Figure 82. INDONESIA AUTOCLAVE INDICATOR TAPE MARKET ANALYSIS BY INDICATOR TYPE     
      233. Figure 83. INDONESIA AUTOCLAVE INDICATOR TAPE MARKET ANALYSIS BY END USE     
      234. Figure 84. INDONESIA AUTOCLAVE INDICATOR TAPE MARKET ANALYSIS BY REGIONAL     
      235. Figure 85. REST OF APAC AUTOCLAVE INDICATOR TAPE MARKET ANALYSIS BY APPLICATION     
      236. Figure 86. REST OF APAC AUTOCLAVE INDICATOR TAPE MARKET ANALYSIS BY MATERIAL TYPE     
      237. Figure 87. REST OF APAC AUTOCLAVE INDICATOR TAPE MARKET ANALYSIS BY INDICATOR TYPE     
      238. Figure 88. REST OF APAC AUTOCLAVE INDICATOR TAPE MARKET ANALYSIS BY END USE     
      239. Figure 89. REST OF APAC AUTOCLAVE INDICATOR TAPE MARKET ANALYSIS BY REGIONAL     
      240. Figure 90. SOUTH AMERICA AUTOCLAVE INDICATOR TAPE MARKET ANALYSIS     
      241. Figure 91. BRAZIL AUTOCLAVE INDICATOR TAPE MARKET ANALYSIS BY APPLICATION     
      242. Figure 92. BRAZIL AUTOCLAVE INDICATOR TAPE MARKET ANALYSIS BY MATERIAL TYPE     
      243. Figure 93. BRAZIL AUTOCLAVE INDICATOR TAPE MARKET ANALYSIS BY INDICATOR TYPE     
      244. Figure 94. BRAZIL AUTOCLAVE INDICATOR TAPE MARKET ANALYSIS BY END USE     
      245. Figure 95. BRAZIL AUTOCLAVE INDICATOR TAPE MARKET ANALYSIS BY REGIONAL     
      246. Figure 96. MEXICO AUTOCLAVE INDICATOR TAPE MARKET ANALYSIS BY APPLICATION     
      247. Figure 97. MEXICO AUTOCLAVE INDICATOR TAPE MARKET ANALYSIS BY MATERIAL TYPE     
      248. Figure 98. MEXICO AUTOCLAVE INDICATOR TAPE MARKET ANALYSIS BY INDICATOR TYPE     
      249. Figure 99. MEXICO AUTOCLAVE INDICATOR TAPE MARKET ANALYSIS BY END USE     
      250. Figure 100. MEXICO AUTOCLAVE INDICATOR TAPE MARKET ANALYSIS BY REGIONAL     
      251. Figure 101. ARGENTINA AUTOCLAVE INDICATOR TAPE MARKET ANALYSIS BY APPLICATION     
      252. Figure 102. ARGENTINA AUTOCLAVE INDICATOR TAPE MARKET ANALYSIS BY MATERIAL TYPE     
      253. Figure 103. ARGENTINA AUTOCLAVE INDICATOR TAPE MARKET ANALYSIS BY INDICATOR TYPE     
      254. Figure 104. ARGENTINA AUTOCLAVE INDICATOR TAPE MARKET ANALYSIS BY END USE     
      255. Figure 105. ARGENTINA AUTOCLAVE INDICATOR TAPE MARKET ANALYSIS BY REGIONAL     
      256. Figure 106. REST OF SOUTH AMERICA AUTOCLAVE INDICATOR TAPE MARKET ANALYSIS BY APPLICATION     
      257. Figure 107. REST OF SOUTH AMERICA AUTOCLAVE INDICATOR TAPE MARKET ANALYSIS BY MATERIAL TYPE     
      258. Figure 108. REST OF SOUTH AMERICA AUTOCLAVE INDICATOR TAPE MARKET ANALYSIS BY INDICATOR TYPE     
      259. Figure 109. REST OF SOUTH AMERICA AUTOCLAVE INDICATOR TAPE MARKET ANALYSIS BY END USE     
      260. Figure 110. REST OF SOUTH AMERICA AUTOCLAVE INDICATOR TAPE MARKET ANALYSIS BY REGIONAL     
      261. Figure 111. MEA AUTOCLAVE INDICATOR TAPE MARKET ANALYSIS     
      262. Figure 112. GCC COUNTRIES AUTOCLAVE INDICATOR TAPE MARKET ANALYSIS BY APPLICATION     
      263. Figure 113. GCC COUNTRIES AUTOCLAVE INDICATOR TAPE MARKET ANALYSIS BY MATERIAL TYPE     
      264. Figure 114. GCC COUNTRIES AUTOCLAVE INDICATOR TAPE MARKET ANALYSIS BY INDICATOR TYPE     
      265. Figure 115. GCC COUNTRIES AUTOCLAVE INDICATOR TAPE MARKET ANALYSIS BY END USE     
      266. Figure 116. GCC COUNTRIES AUTOCLAVE INDICATOR TAPE MARKET ANALYSIS BY REGIONAL     
      267. Figure 117. SOUTH AFRICA AUTOCLAVE INDICATOR TAPE MARKET ANALYSIS BY APPLICATION     
      268. Figure 118. SOUTH AFRICA AUTOCLAVE INDICATOR TAPE MARKET ANALYSIS BY MATERIAL TYPE     
      269. Figure 119. SOUTH AFRICA AUTOCLAVE INDICATOR TAPE MARKET ANALYSIS BY INDICATOR TYPE     
      270. Figure 120. SOUTH AFRICA AUTOCLAVE INDICATOR TAPE MARKET ANALYSIS BY END USE     
      271. Figure 121. SOUTH AFRICA AUTOCLAVE INDICATOR TAPE MARKET ANALYSIS BY REGIONAL     
      272. Figure 122. REST OF MEA AUTOCLAVE INDICATOR TAPE MARKET ANALYSIS BY APPLICATION     
      273. Figure 123. REST OF MEA AUTOCLAVE INDICATOR TAPE MARKET ANALYSIS BY MATERIAL TYPE     
      274. Figure 124. REST OF MEA AUTOCLAVE INDICATOR TAPE MARKET ANALYSIS BY INDICATOR TYPE     
      275. Figure 125. REST OF MEA AUTOCLAVE INDICATOR TAPE MARKET ANALYSIS BY END USE     
      276. Figure 126. REST OF MEA AUTOCLAVE INDICATOR TAPE MARKET ANALYSIS BY REGIONAL     
      277. Figure 127. KEY BUYING CRITERIA OF AUTOCLAVE INDICATOR TAPE MARKET     
      278. Figure 128. RESEARCH PROCESS OF MRFR     
      279. Figure 129. DRO ANALYSIS OF AUTOCLAVE INDICATOR TAPE MARKET     
      280. Figure 130. DRIVERS IMPACT ANALYSIS: AUTOCLAVE INDICATOR TAPE MARKET     
      281. Figure 131. RESTRAINTS IMPACT ANALYSIS: AUTOCLAVE INDICATOR TAPE MARKET     
      282. Figure 132. SUPPLY / VALUE CHAIN: AUTOCLAVE INDICATOR TAPE MARKET     
      283. Figure 133. AUTOCLAVE INDICATOR TAPE MARKET, BY APPLICATION, 2024 (% SHARE)     
      284. Figure 134. AUTOCLAVE INDICATOR TAPE MARKET, BY APPLICATION, 2019 TO 2032 (USD Billions)     
      285. Figure 135. AUTOCLAVE INDICATOR TAPE MARKET, BY MATERIAL TYPE, 2024 (% SHARE)     
      286. Figure 136. AUTOCLAVE INDICATOR TAPE MARKET, BY MATERIAL TYPE, 2019 TO 2032 (USD Billions)     
      287. Figure 137. AUTOCLAVE INDICATOR TAPE MARKET, BY INDICATOR TYPE, 2024 (% SHARE)     
      288. Figure 138. AUTOCLAVE INDICATOR TAPE MARKET, BY INDICATOR TYPE, 2019 TO 2032 (USD Billions)     
      289. Figure 139. AUTOCLAVE INDICATOR TAPE MARKET, BY END USE, 2024 (% SHARE)     
      290. Figure 140. AUTOCLAVE INDICATOR TAPE MARKET, BY END USE, 2019 TO 2032 (USD Billions)     
      291. Figure 141. AUTOCLAVE INDICATOR TAPE MARKET, BY REGIONAL, 2024 (% SHARE)     
      292. Figure 142. AUTOCLAVE INDICATOR TAPE MARKET, BY REGIONAL, 2019 TO 2032 (USD Billions)     
      293. Figure 143. BENCHMARKING OF MAJOR COMPETITORS   

    Autoclave Indicator Tape Market Segmentation


    Autoclave Indicator Tape Market By Application (USD Billion, 2019-2032)

    • Medical
    • Pharmaceutical
    • Laboratory


    Autoclave Indicator Tape Market By Material Type (USD Billion, 2019-2032)


    • Paper
    • Plastic
    • Polyimide


    Autoclave Indicator Tape Market By Indicator Type (USD Billion, 2019-2032)


    • Temperature Indicator
    • Chemical Indicator
    • Biological Indicator


    Autoclave Indicator Tape Market By End Use (USD Billion, 2019-2032)


    • Hospitals
    • Clinics
    • Research Institutions


    Autoclave Indicator Tape Market By Regional (USD Billion, 2019-2032)


    • North America
    • Europe
    • South America
    • Asia Pacific
    • Middle East and Africa


    Autoclave Indicator Tape Market Regional Outlook (USD Billion, 2019-2032)


    • North America Outlook (USD Billion, 2019-2032)

      • North America Autoclave Indicator Tape Market by Application Type

        • Medical
        • Pharmaceutical
        • Laboratory
      • North America Autoclave Indicator Tape Market by Material Type

        • Paper
        • Plastic
        • Polyimide
      • North America Autoclave Indicator Tape Market by Indicator Type

        • Temperature Indicator
        • Chemical Indicator
        • Biological Indicator
      • North America Autoclave Indicator Tape Market by End Use Type

        • Hospitals
        • Clinics
        • Research Institutions
      • North America Autoclave Indicator Tape Market by Regional Type

        • US
        • Canada
      • US Outlook (USD Billion, 2019-2032)
      • US Autoclave Indicator Tape Market by Application Type

        • Medical
        • Pharmaceutical
        • Laboratory
      • US Autoclave Indicator Tape Market by Material Type

        • Paper
        • Plastic
        • Polyimide
      • US Autoclave Indicator Tape Market by Indicator Type

        • Temperature Indicator
        • Chemical Indicator
        • Biological Indicator
      • US Autoclave Indicator Tape Market by End Use Type

        • Hospitals
        • Clinics
        • Research Institutions
      • CANADA Outlook (USD Billion, 2019-2032)
      • CANADA Autoclave Indicator Tape Market by Application Type

        • Medical
        • Pharmaceutical
        • Laboratory
      • CANADA Autoclave Indicator Tape Market by Material Type

        • Paper
        • Plastic
        • Polyimide
      • CANADA Autoclave Indicator Tape Market by Indicator Type

        • Temperature Indicator
        • Chemical Indicator
        • Biological Indicator
      • CANADA Autoclave Indicator Tape Market by End Use Type

        • Hospitals
        • Clinics
        • Research Institutions
    • Europe Outlook (USD Billion, 2019-2032)

      • Europe Autoclave Indicator Tape Market by Application Type

        • Medical
        • Pharmaceutical
        • Laboratory
      • Europe Autoclave Indicator Tape Market by Material Type

        • Paper
        • Plastic
        • Polyimide
      • Europe Autoclave Indicator Tape Market by Indicator Type

        • Temperature Indicator
        • Chemical Indicator
        • Biological Indicator
      • Europe Autoclave Indicator Tape Market by End Use Type

        • Hospitals
        • Clinics
        • Research Institutions
      • Europe Autoclave Indicator Tape Market by Regional Type

        • Germany
        • UK
        • France
        • Russia
        • Italy
        • Spain
        • Rest of Europe
      • GERMANY Outlook (USD Billion, 2019-2032)
      • GERMANY Autoclave Indicator Tape Market by Application Type

        • Medical
        • Pharmaceutical
        • Laboratory
      • GERMANY Autoclave Indicator Tape Market by Material Type

        • Paper
        • Plastic
        • Polyimide
      • GERMANY Autoclave Indicator Tape Market by Indicator Type

        • Temperature Indicator
        • Chemical Indicator
        • Biological Indicator
      • GERMANY Autoclave Indicator Tape Market by End Use Type

        • Hospitals
        • Clinics
        • Research Institutions
      • UK Outlook (USD Billion, 2019-2032)
      • UK Autoclave Indicator Tape Market by Application Type

        • Medical
        • Pharmaceutical
        • Laboratory
      • UK Autoclave Indicator Tape Market by Material Type

        • Paper
        • Plastic
        • Polyimide
      • UK Autoclave Indicator Tape Market by Indicator Type

        • Temperature Indicator
        • Chemical Indicator
        • Biological Indicator
      • UK Autoclave Indicator Tape Market by End Use Type

        • Hospitals
        • Clinics
        • Research Institutions
      • FRANCE Outlook (USD Billion, 2019-2032)
      • FRANCE Autoclave Indicator Tape Market by Application Type

        • Medical
        • Pharmaceutical
        • Laboratory
      • FRANCE Autoclave Indicator Tape Market by Material Type

        • Paper
        • Plastic
        • Polyimide
      • FRANCE Autoclave Indicator Tape Market by Indicator Type

        • Temperature Indicator
        • Chemical Indicator
        • Biological Indicator
      • FRANCE Autoclave Indicator Tape Market by End Use Type

        • Hospitals
        • Clinics
        • Research Institutions
      • RUSSIA Outlook (USD Billion, 2019-2032)
      • RUSSIA Autoclave Indicator Tape Market by Application Type

        • Medical
        • Pharmaceutical
        • Laboratory
      • RUSSIA Autoclave Indicator Tape Market by Material Type

        • Paper
        • Plastic
        • Polyimide
      • RUSSIA Autoclave Indicator Tape Market by Indicator Type

        • Temperature Indicator
        • Chemical Indicator
        • Biological Indicator
      • RUSSIA Autoclave Indicator Tape Market by End Use Type

        • Hospitals
        • Clinics
        • Research Institutions
      • ITALY Outlook (USD Billion, 2019-2032)
      • ITALY Autoclave Indicator Tape Market by Application Type

        • Medical
        • Pharmaceutical
        • Laboratory
      • ITALY Autoclave Indicator Tape Market by Material Type

        • Paper
        • Plastic
        • Polyimide
      • ITALY Autoclave Indicator Tape Market by Indicator Type

        • Temperature Indicator
        • Chemical Indicator
        • Biological Indicator
      • ITALY Autoclave Indicator Tape Market by End Use Type

        • Hospitals
        • Clinics
        • Research Institutions
      • SPAIN Outlook (USD Billion, 2019-2032)
      • SPAIN Autoclave Indicator Tape Market by Application Type

        • Medical
        • Pharmaceutical
        • Laboratory
      • SPAIN Autoclave Indicator Tape Market by Material Type

        • Paper
        • Plastic
        • Polyimide
      • SPAIN Autoclave Indicator Tape Market by Indicator Type

        • Temperature Indicator
        • Chemical Indicator
        • Biological Indicator
      • SPAIN Autoclave Indicator Tape Market by End Use Type

        • Hospitals
        • Clinics
        • Research Institutions
      • REST OF EUROPE Outlook (USD Billion, 2019-2032)
      • REST OF EUROPE Autoclave Indicator Tape Market by Application Type

        • Medical
        • Pharmaceutical
        • Laboratory
      • REST OF EUROPE Autoclave Indicator Tape Market by Material Type

        • Paper
        • Plastic
        • Polyimide
      • REST OF EUROPE Autoclave Indicator Tape Market by Indicator Type

        • Temperature Indicator
        • Chemical Indicator
        • Biological Indicator
      • REST OF EUROPE Autoclave Indicator Tape Market by End Use Type

        • Hospitals
        • Clinics
        • Research Institutions
    • APAC Outlook (USD Billion, 2019-2032)

      • APAC Autoclave Indicator Tape Market by Application Type

        • Medical
        • Pharmaceutical
        • Laboratory
      • APAC Autoclave Indicator Tape Market by Material Type

        • Paper
        • Plastic
        • Polyimide
      • APAC Autoclave Indicator Tape Market by Indicator Type

        • Temperature Indicator
        • Chemical Indicator
        • Biological Indicator
      • APAC Autoclave Indicator Tape Market by End Use Type

        • Hospitals
        • Clinics
        • Research Institutions
      • APAC Autoclave Indicator Tape Market by Regional Type

        • China
        • India
        • Japan
        • South Korea
        • Malaysia
        • Thailand
        • Indonesia
        • Rest of APAC
      • CHINA Outlook (USD Billion, 2019-2032)
      • CHINA Autoclave Indicator Tape Market by Application Type

        • Medical
        • Pharmaceutical
        • Laboratory
      • CHINA Autoclave Indicator Tape Market by Material Type

        • Paper
        • Plastic
        • Polyimide
      • CHINA Autoclave Indicator Tape Market by Indicator Type

        • Temperature Indicator
        • Chemical Indicator
        • Biological Indicator
      • CHINA Autoclave Indicator Tape Market by End Use Type

        • Hospitals
        • Clinics
        • Research Institutions
      • INDIA Outlook (USD Billion, 2019-2032)
      • INDIA Autoclave Indicator Tape Market by Application Type

        • Medical
        • Pharmaceutical
        • Laboratory
      • INDIA Autoclave Indicator Tape Market by Material Type

        • Paper
        • Plastic
        • Polyimide
      • INDIA Autoclave Indicator Tape Market by Indicator Type

        • Temperature Indicator
        • Chemical Indicator
        • Biological Indicator
      • INDIA Autoclave Indicator Tape Market by End Use Type

        • Hospitals
        • Clinics
        • Research Institutions
      • JAPAN Outlook (USD Billion, 2019-2032)
      • JAPAN Autoclave Indicator Tape Market by Application Type

        • Medical
        • Pharmaceutical
        • Laboratory
      • JAPAN Autoclave Indicator Tape Market by Material Type

        • Paper
        • Plastic
        • Polyimide
      • JAPAN Autoclave Indicator Tape Market by Indicator Type

        • Temperature Indicator
        • Chemical Indicator
        • Biological Indicator
      • JAPAN Autoclave Indicator Tape Market by End Use Type

        • Hospitals
        • Clinics
        • Research Institutions
      • SOUTH KOREA Outlook (USD Billion, 2019-2032)
      • SOUTH KOREA Autoclave Indicator Tape Market by Application Type

        • Medical
        • Pharmaceutical
        • Laboratory
      • SOUTH KOREA Autoclave Indicator Tape Market by Material Type

        • Paper
        • Plastic
        • Polyimide
      • SOUTH KOREA Autoclave Indicator Tape Market by Indicator Type

        • Temperature Indicator
        • Chemical Indicator
        • Biological Indicator
      • SOUTH KOREA Autoclave Indicator Tape Market by End Use Type

        • Hospitals
        • Clinics
        • Research Institutions
      • MALAYSIA Outlook (USD Billion, 2019-2032)
      • MALAYSIA Autoclave Indicator Tape Market by Application Type

        • Medical
        • Pharmaceutical
        • Laboratory
      • MALAYSIA Autoclave Indicator Tape Market by Material Type

        • Paper
        • Plastic
        • Polyimide
      • MALAYSIA Autoclave Indicator Tape Market by Indicator Type

        • Temperature Indicator
        • Chemical Indicator
        • Biological Indicator
      • MALAYSIA Autoclave Indicator Tape Market by End Use Type

        • Hospitals
        • Clinics
        • Research Institutions
      • THAILAND Outlook (USD Billion, 2019-2032)
      • THAILAND Autoclave Indicator Tape Market by Application Type

        • Medical
        • Pharmaceutical
        • Laboratory
      • THAILAND Autoclave Indicator Tape Market by Material Type

        • Paper
        • Plastic
        • Polyimide
      • THAILAND Autoclave Indicator Tape Market by Indicator Type

        • Temperature Indicator
        • Chemical Indicator
        • Biological Indicator
      • THAILAND Autoclave Indicator Tape Market by End Use Type

        • Hospitals
        • Clinics
        • Research Institutions
      • INDONESIA Outlook (USD Billion, 2019-2032)
      • INDONESIA Autoclave Indicator Tape Market by Application Type

        • Medical
        • Pharmaceutical
        • Laboratory
      • INDONESIA Autoclave Indicator Tape Market by Material Type

        • Paper
        • Plastic
        • Polyimide
      • INDONESIA Autoclave Indicator Tape Market by Indicator Type

        • Temperature Indicator
        • Chemical Indicator
        • Biological Indicator
      • INDONESIA Autoclave Indicator Tape Market by End Use Type

        • Hospitals
        • Clinics
        • Research Institutions
      • REST OF APAC Outlook (USD Billion, 2019-2032)
      • REST OF APAC Autoclave Indicator Tape Market by Application Type

        • Medical
        • Pharmaceutical
        • Laboratory
      • REST OF APAC Autoclave Indicator Tape Market by Material Type

        • Paper
        • Plastic
        • Polyimide
      • REST OF APAC Autoclave Indicator Tape Market by Indicator Type

        • Temperature Indicator
        • Chemical Indicator
        • Biological Indicator
      • REST OF APAC Autoclave Indicator Tape Market by End Use Type

        • Hospitals
        • Clinics
        • Research Institutions
    • South America Outlook (USD Billion, 2019-2032)

      • South America Autoclave Indicator Tape Market by Application Type

        • Medical
        • Pharmaceutical
        • Laboratory
      • South America Autoclave Indicator Tape Market by Material Type

        • Paper
        • Plastic
        • Polyimide
      • South America Autoclave Indicator Tape Market by Indicator Type

        • Temperature Indicator
        • Chemical Indicator
        • Biological Indicator
      • South America Autoclave Indicator Tape Market by End Use Type

        • Hospitals
        • Clinics
        • Research Institutions
      • South America Autoclave Indicator Tape Market by Regional Type

        • Brazil
        • Mexico
        • Argentina
        • Rest of South America
      • BRAZIL Outlook (USD Billion, 2019-2032)
      • BRAZIL Autoclave Indicator Tape Market by Application Type

        • Medical
        • Pharmaceutical
        • Laboratory
      • BRAZIL Autoclave Indicator Tape Market by Material Type

        • Paper
        • Plastic
        • Polyimide
      • BRAZIL Autoclave Indicator Tape Market by Indicator Type

        • Temperature Indicator
        • Chemical Indicator
        • Biological Indicator
      • BRAZIL Autoclave Indicator Tape Market by End Use Type

        • Hospitals
        • Clinics
        • Research Institutions
      • MEXICO Outlook (USD Billion, 2019-2032)
      • MEXICO Autoclave Indicator Tape Market by Application Type

        • Medical
        • Pharmaceutical
        • Laboratory
      • MEXICO Autoclave Indicator Tape Market by Material Type

        • Paper
        • Plastic
        • Polyimide
      • MEXICO Autoclave Indicator Tape Market by Indicator Type

        • Temperature Indicator
        • Chemical Indicator
        • Biological Indicator
      • MEXICO Autoclave Indicator Tape Market by End Use Type

        • Hospitals
        • Clinics
        • Research Institutions
      • ARGENTINA Outlook (USD Billion, 2019-2032)
      • ARGENTINA Autoclave Indicator Tape Market by Application Type

        • Medical
        • Pharmaceutical
        • Laboratory
      • ARGENTINA Autoclave Indicator Tape Market by Material Type

        • Paper
        • Plastic
        • Polyimide
      • ARGENTINA Autoclave Indicator Tape Market by Indicator Type

        • Temperature Indicator
        • Chemical Indicator
        • Biological Indicator
      • ARGENTINA Autoclave Indicator Tape Market by End Use Type

        • Hospitals
        • Clinics
        • Research Institutions
      • REST OF SOUTH AMERICA Outlook (USD Billion, 2019-2032)
      • REST OF SOUTH AMERICA Autoclave Indicator Tape Market by Application Type

        • Medical
        • Pharmaceutical
        • Laboratory
      • REST OF SOUTH AMERICA Autoclave Indicator Tape Market by Material Type

        • Paper
        • Plastic
        • Polyimide
      • REST OF SOUTH AMERICA Autoclave Indicator Tape Market by Indicator Type

        • Temperature Indicator
        • Chemical Indicator
        • Biological Indicator
      • REST OF SOUTH AMERICA Autoclave Indicator Tape Market by End Use Type

        • Hospitals
        • Clinics
        • Research Institutions
    • MEA Outlook (USD Billion, 2019-2032)

      • MEA Autoclave Indicator Tape Market by Application Type

        • Medical
        • Pharmaceutical
        • Laboratory
      • MEA Autoclave Indicator Tape Market by Material Type

        • Paper
        • Plastic
        • Polyimide
      • MEA Autoclave Indicator Tape Market by Indicator Type

        • Temperature Indicator
        • Chemical Indicator
        • Biological Indicator
      • MEA Autoclave Indicator Tape Market by End Use Type

        • Hospitals
        • Clinics
        • Research Institutions
      • MEA Autoclave Indicator Tape Market by Regional Type

        • GCC Countries
        • South Africa
        • Rest of MEA
      • GCC COUNTRIES Outlook (USD Billion, 2019-2032)
      • GCC COUNTRIES Autoclave Indicator Tape Market by Application Type

        • Medical
        • Pharmaceutical
        • Laboratory
      • GCC COUNTRIES Autoclave Indicator Tape Market by Material Type

        • Paper
        • Plastic
        • Polyimide
      • GCC COUNTRIES Autoclave Indicator Tape Market by Indicator Type

        • Temperature Indicator
        • Chemical Indicator
        • Biological Indicator
      • GCC COUNTRIES Autoclave Indicator Tape Market by End Use Type

        • Hospitals
        • Clinics
        • Research Institutions
      • SOUTH AFRICA Outlook (USD Billion, 2019-2032)
      • SOUTH AFRICA Autoclave Indicator Tape Market by Application Type

        • Medical
        • Pharmaceutical
        • Laboratory
      • SOUTH AFRICA Autoclave Indicator Tape Market by Material Type

        • Paper
        • Plastic
        • Polyimide
      • SOUTH AFRICA Autoclave Indicator Tape Market by Indicator Type

        • Temperature Indicator
        • Chemical Indicator
        • Biological Indicator
      • SOUTH AFRICA Autoclave Indicator Tape Market by End Use Type

        • Hospitals
        • Clinics
        • Research Institutions
      • REST OF MEA Outlook (USD Billion, 2019-2032)
      • REST OF MEA Autoclave Indicator Tape Market by Application Type

        • Medical
        • Pharmaceutical
        • Laboratory
      • REST OF MEA Autoclave Indicator Tape Market by Material Type

        • Paper
        • Plastic
        • Polyimide
      • REST OF MEA Autoclave Indicator Tape Market by Indicator Type

        • Temperature Indicator
        • Chemical Indicator
        • Biological Indicator
      • REST OF MEA Autoclave Indicator Tape Market by End Use Type

        • Hospitals
        • Clinics
        • Research Institutions


    Infographic

    Free Sample Request

    Kindly complete the form below to receive a free sample of this Report

    Get Free Sample

    Customer Strories

    “I am very pleased with how market segments have been defined in a relevant way for my purposes (such as "Portable Freezers & refrigerators" and "last-mile"). In general the report is well structured. Thanks very much for your efforts.”

    Victoria Milne

    Founder
    Case Study
    Chemicals and Materials