×
Hero Background
English
Chinese
French
Japanese
Korean
German
Spanish

Automated Suturing Devices Market Share

ID: MRFR/MED/0700-HCR
80 Pages
Rahul Gotadki
October 2025

Automated Suturing Devices Market Research Report Information by Type (Disposable and Reusable), Application (Cardiac, Orthopedic, Ophthalmic, Dental and Gynecological), End-Use (Hospitals & Clinics, Ambulatory Surgical Centers and others) and Region (Americas, Europe, Asia-Pacific and Middle East & Africa) - Forecast till 2035

Share:
Download PDF ×

We do not share your information with anyone. However, we may send you emails based on your report interest from time to time. You may contact us at any time to opt-out.

Automated Suturing Devices Market Infographic
Purchase Options

Market Share

Automated Suturing Devices Market Share Analysis

The Automated Suturing Devices market is undergoing significant growth, driven by advancements in surgical technology and the increasing demand for efficient and precise suturing methods. Market players are strategically implementing various positioning strategies to capitalize on this trend and establish a competitive advantage in the evolving landscape of surgical devices. Within the Automated Suturing Devices market the firms aim at diversifying their product lines by developing different types of automated suturing devices. This involves robotic-assisted suturing systems as well as handheld automated suturing devices and laparoscopic suturing devices. Both the various devices in use facilitate the product development stage to provide companies with the opportunity to serve unmet surgical procedure and environment needs hence positioning themselves as all inclusive solution providers. With regard to primary market positioning strategy, constant investment in research and development to move the process of automated suturing forward is the one adopted. Therefore, corporates continuously try to increase the accuracy, lower the operational times, and make the gadgets friendlier. Technological development guarantees their competitive edge and strengthens their image as the latest surgical devices. Comprehending the worldwide need of innovative surgical technologies, firms develop measures to make their international market penetration. Such types of activities must includes the marketing design which involves the creation of partnerships, collaborations and distribution networks to ensure appropriate market penetration and accessibility to automated suturing devices for various regions. Such agreements are crucial for the market’s success because production requires surgeons and surgical team and healthcare facilities. This is achieved by working with leading members in the medical field to glean from their knowledge on clinical needs, product development, and credibility within the surgical community to tackle a market share. In market positioning, the user-friendly interfaces and training programs are key elements to be given priority. It also tries to build suturing devices that will work automatically they are simple to operate, and demand little training as well as have user friendly controls. This has a positive impact adoption is increased and brand loyalty is built among surgical professionals. Following strict regulatory policies and safe automated suturing devices form the basic methods for market positioning. Companies spend on the certification, the deep and regular solving of safety issues, the constant upgrading of the device to the level that would keep the trust of healthcare providers and users. There would be a big positioning of products from automated suturing devices in real-time monitoring of the devices. The companies create devices that serve the surgeon s feedback on several factors in suturing, including suture tension, tissue response, and other key parameters; therefore, the suturing process as a whole may be made as precise and time-saving as possible. Leveraging data analytics is integral for informed decision-making. Companies analyze user data, market trends, and competitive landscapes to refine marketing strategies and adapt product development. Data-driven insights enable companies to stay responsive to the evolving needs of the Automated Suturing Devices market.

Author
Rahul Gotadki
Assistant Manager

He holds an experience of about 7+ years in Market Research and Business Consulting, working under the spectrum of Life Sciences and Healthcare domains. Rahul conceptualizes and implements a scalable business strategy and provides strategic leadership to the clients. His expertise lies in market estimation, competitive intelligence, pipeline analysis, customer assessment, etc. In addition to the above, his other responsibility includes strategic tracking of high growth markets & advising clients on the potential areas of focus they could direct their business initiatives

Leave a Comment

FAQs

What is the projected market valuation for the Automated Suturing Devices Market in 2035?

The projected market valuation for the Automated Suturing Devices Market in 2035 is 7.34 USD Billion.

What was the market valuation for Automated Suturing Devices in 2024?

The market valuation for Automated Suturing Devices in 2024 was 3.459 USD Billion.

What is the expected CAGR for the Automated Suturing Devices Market from 2025 to 2035?

The expected CAGR for the Automated Suturing Devices Market during the forecast period 2025 - 2035 is 7.08%.

Which companies are considered key players in the Automated Suturing Devices Market?

Key players in the Automated Suturing Devices Market include Medtronic, Johnson & Johnson, Surgical Innovations, Boston Scientific, Ethicon, Conmed, Apollo Endosurgery, Stryker, and B. Braun.

What are the projected revenues for disposable and reusable automated suturing devices by 2035?

By 2035, disposable automated suturing devices are projected to generate revenues of 3.2 USD Billion, while reusable devices may reach 4.14 USD Billion.

Market Summary

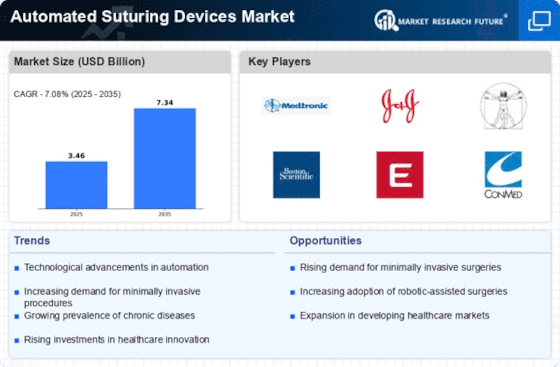
As per MRFR analysis, the Automated Suturing Devices Market Size was estimated at 3.459 USD Billion in 2024. The Automated Suturing Devices industry is projected to grow from 3.704 in 2025 to 7.34 by 2035, exhibiting a compound annual growth rate (CAGR) of 7.08 during the forecast period 2025 - 2035.

Key Market Trends & Highlights

The Automated Suturing Devices Market is poised for substantial growth driven by technological advancements and increasing demand for minimally invasive procedures.

  • North America remains the largest market for automated suturing devices, driven by advanced healthcare infrastructure and high surgical volumes.
  • The Asia-Pacific region is emerging as the fastest-growing market, fueled by rising healthcare investments and a growing population.
  • Ethicon leads the market as the largest player, while Medtronic plc is recognized for its rapid growth in the automated suturing segment.
  • Technological advancements and the rising demand for minimally invasive surgeries are key drivers propelling market expansion.

Market Size & Forecast

2024 Market Size 3.459 (USD Billion)
2035 Market Size 7.34 (USD Billion)
CAGR (2025 - 2035) 7.08%
Largest Regional Market Share in 2024 North America

Major Players

<p>Medtronic (US), Johnson & Johnson (US), Surgical Innovations (GB), Boston Scientific (US), Ethicon (US), Conmed (US), Apollo Endosurgery (US), Stryker (US), B. Braun (DE)</p>

Market Trends

The Automated Suturing Devices Market is currently experiencing a transformative phase, driven by advancements in technology and increasing demand for minimally invasive surgical procedures. Surgeons and healthcare providers are increasingly adopting automated suturing devices due to their ability to enhance precision, reduce operation time, and improve patient outcomes. This shift towards automation is not merely a trend but appears to be a fundamental change in surgical practices, as these devices offer consistent performance and reliability. Furthermore, the integration of smart technologies, such as artificial intelligence and robotics, is likely to further propel the market forward, as these innovations promise to optimize surgical workflows and enhance the overall efficiency of procedures. In addition to technological advancements, the growing emphasis on patient safety and recovery is influencing the Automated Suturing Devices Market. Healthcare institutions are prioritizing tools that minimize complications and promote faster healing. This focus on patient-centric care is encouraging manufacturers to develop devices that are not only effective but also user-friendly. As the market evolves, it seems that collaboration between device manufacturers and healthcare professionals will be crucial in addressing the specific needs of surgical teams. Overall, the Automated Suturing Devices Market is poised for substantial growth, driven by a combination of technological innovation and a commitment to improving surgical outcomes.

Technological Advancements

The Automated Suturing Devices Market is witnessing rapid technological advancements, particularly in the integration of robotics and artificial intelligence. These innovations enhance the precision and efficiency of surgical procedures, allowing for more complex surgeries to be performed with greater ease. As technology continues to evolve, it is likely that automated suturing devices will become increasingly sophisticated, offering features that further streamline surgical workflows.

Minimally Invasive Procedures

There is a growing trend towards minimally invasive surgical techniques, which are favored for their benefits in reducing recovery time and minimizing patient discomfort. Automated suturing devices are becoming essential tools in this context, as they facilitate these procedures by providing reliable and efficient suturing solutions. This trend indicates a shift in surgical practices, with a focus on enhancing patient outcomes.

Patient Safety and Recovery

The emphasis on patient safety and rapid recovery is shaping the Automated Suturing Devices Market. Healthcare providers are increasingly seeking solutions that not only improve surgical efficiency but also reduce the risk of complications. This focus on patient-centric care is driving manufacturers to innovate and develop devices that prioritize safety and effectiveness, ultimately leading to better patient experiences.

Automated Suturing Devices Market Market Drivers

Surge in Surgical Procedures

The Automated Suturing Devices Market is witnessing a surge in the number of surgical procedures performed annually. This increase is attributed to various factors, including an aging population and the rising prevalence of chronic diseases that require surgical intervention. As the volume of surgeries rises, the demand for efficient and reliable suturing solutions grows correspondingly. Market statistics indicate that the number of surgical procedures is expected to increase by approximately 5% annually, further propelling the need for automated suturing devices. This trend underscores the importance of these devices in meeting the demands of modern surgical practices.

Increased Focus on Patient Safety

The Automated Suturing Devices Market is also shaped by an increased focus on patient safety and outcomes. Healthcare providers are prioritizing technologies that enhance surgical precision and reduce the likelihood of complications. Automated suturing devices are designed to minimize human error, thereby improving the overall safety of surgical procedures. Market analysis reveals that hospitals and surgical centers are investing in these devices to ensure better patient outcomes and satisfaction. This trend is likely to drive the adoption of automated suturing devices, as they align with the broader goals of enhancing patient care and safety in surgical environments.

Rising Demand for Minimally Invasive Surgeries

The Automated Suturing Devices Market is significantly influenced by the rising demand for minimally invasive surgeries. These procedures are preferred due to their associated benefits, such as reduced recovery times and lower risk of complications. As healthcare providers increasingly adopt minimally invasive techniques, the need for efficient suturing solutions becomes paramount. The market data indicates that minimally invasive surgeries account for a substantial share of surgical procedures, with projections suggesting that this trend will continue to grow. Consequently, automated suturing devices are becoming essential tools in surgical settings, facilitating quicker and more effective suturing processes.

Growing Investment in Healthcare Infrastructure

The Automated Suturing Devices Market is benefiting from growing investments in healthcare infrastructure across various regions. Governments and private entities are allocating substantial resources to enhance surgical facilities and adopt advanced medical technologies. This investment trend is likely to facilitate the integration of automated suturing devices into surgical practices, as healthcare providers seek to improve operational efficiency and patient care. Market data suggests that healthcare expenditure is projected to rise significantly, creating a favorable environment for the growth of automated suturing devices. This influx of capital is expected to drive innovation and expand the market for these essential surgical tools.

Technological Advancements in Automated Suturing Devices

The Automated Suturing Devices Market is experiencing rapid technological advancements that enhance the efficiency and precision of surgical procedures. Innovations such as robotic-assisted suturing systems and smart suturing devices are becoming increasingly prevalent. These technologies not only improve the accuracy of suturing but also reduce the time required for surgical interventions. According to recent data, the market for automated suturing devices is projected to grow at a compound annual growth rate of approximately 8% over the next five years. This growth is driven by the increasing adoption of advanced surgical techniques and the rising demand for minimally invasive surgeries, which require sophisticated suturing solutions.

Market Segment Insights

By Source: Ethicon (Largest) vs. Medtronic plc (Fastest-Growing)

<p>In the Automated Suturing Devices Market, Ethicon holds a commanding position, accounting for a significant share among the sources of suturing devices. This dominance is attributed to its robust portfolio and brand recognition within the surgical community, making it the preferred choice for many healthcare facilities. In contrast, Medtronic plc has emerged as a strong player, leveraging innovations and strategic partnerships to capture an increasing share of the market, appealing especially to institutions focused on the latest technological advancements.</p>

<p>Ethicon (Dominant) vs. Medtronic plc (Emerging)</p>

<p>Ethicon remains the dominant force in the Automated Suturing Devices Market, known for its extensive range of products that cater to various surgical applications. The company's reputation for quality and reliability is deeply ingrained among practitioners, and it continually evolves its offerings through research and development. In comparison, Medtronic plc is emerging with a rapidly growing portfolio that emphasizes minimally invasive surgical techniques and automation. Their commitment to innovative solutions is driving market interest and adoption, making them a notable competitor as they capitalize on trends towards efficiency and precision in surgical procedures.</p>

By Product Type: Disposable (Largest) vs. Reusable (Fastest-Growing)

<p>The Automated Suturing Devices Market is currently dominated by disposable devices, which are preferred for their convenience and ease of use. These devices account for a significant portion of the market share, favored by healthcare professionals for single-use scenarios that enhance sterility and reduce the risk of infection. On the other hand, reusable devices are gaining traction, appealing to cost-conscious institutions looking for sustainable options that can be sterilized and used multiple times, thereby reducing waste and operating costs in the long term.</p>

<p>Product Type: Disposable (Dominant) vs. Reusable (Emerging)</p>

<p>Disposable automated suturing devices are characterized by their single-use design, which eliminates the need for reprocessing after surgery, thereby enhancing patient safety and operational efficiency. They are extensively utilized in various surgical procedures due to their ability to offer consistent performance and high reliability. In contrast, reusable automated suturing devices are emerging as a cost-effective alternative, especially in environments prioritizing sustainability. These devices are designed for multiple uses after proper sterilization, thus appealing to healthcare providers aiming to reduce waste and comply with environmental regulations. Each segment caters to specific market needs, shaping the overall landscape of the Automated Suturing Devices Market.</p>

By Application: Gynecological (Largest) vs. Orthopedic (Fastest-Growing)

<p>In the Automated Suturing Devices Market, the application segments showcase diverse contributions, with gynecological procedures commanding the largest share. This dominance stems from the increasing number of minimally invasive surgical procedures and rising awareness about advanced surgical technologies. Furthermore, while gynecological applications lead in terms of market share, orthopedic applications are emerging rapidly, attracting significant investments and innovation due to the rising incidence of orthopedic diseases and surgeries. The growth trends in the Automated Suturing Devices Market reflect an increasing preference for automated solutions across various surgical specialties. The orthopedic segment is particularly notable, characterized by its rapid expansion driven by the demand for efficient suturing techniques in knee and hip surgeries. Simultaneously, the orthopedic segment benefits from ongoing technological advancements, reinforcing its position as the fastest-growing area within the market compared to other applications like dental and ophthalmic procedures.</p>

<p>Gynecological (Dominant) vs. Orthopedic (Emerging)</p>

<p>The gynecological application of automated suturing devices stands out as the dominant force in the market, owing to its strong alignment with the increasing trend toward minimally invasive surgeries. These devices facilitate precision and reduce recovery times, making them indispensable for procedures such as hysterectomies and laparoscopic surgeries. In contrast, the orthopedic segment is emerging as a vital area due to the rising prevalence of musculoskeletal disorders and the corresponding need for advanced suturing techniques in surgical interventions. The development of specialized sutures and devices tailored for orthopedic surgeries enhances surgical efficiency and improves patient outcomes, positioning orthopedic procedures as a significant growth driver in the automated suturing market.</p>

By End Users: Clinics and hospitals (Largest) vs. Ambulatory/Outpatient Surgical Center (Fastest-Growing)

<p>In the Automated Suturing Devices Market, Clinics and Hospitals represent the largest segment, holding a significant share of the market. This dominance is attributed to the extensive utilization of these devices in varied surgical procedures, facilitating efficient suturing and enhancing patient outcomes. Meanwhile, Ambulatory/Outpatient Surgical Centers are emerging rapidly, capturing attention as they present increased opportunities for outpatient procedures and quick recovery times, thereby driving demand for automated suturing solutions.</p>

<p>Clinics and hospitals (Dominant) vs. Ambulatory/Outpatient Surgical Center (Emerging)</p>

<p>Clinics and hospitals dominate the Automated Suturing Devices Market due to their established infrastructure and high patient volume, resulting in a continued reliance on advanced surgical technology. These facilities utilize automated suturing devices for various surgical applications, improving efficiency and precision. Conversely, Ambulatory/Outpatient Surgical Centers are rapidly gaining momentum as a cost-effective alternative for patients seeking minimally invasive procedures. Their growth is driven by the shift towards outpatient care, declining hospital stays, and an increasing preference for quicker recovery, making them a significant emerging segment in the market.</p>

Get more detailed insights about Automated Suturing Devices Market Research Report - Global Forecast till 2035

Regional Insights

North America : Market Leader in Innovation

North America is the largest market for automated suturing devices, holding approximately 45% of the global market share. The region's growth is driven by advanced healthcare infrastructure, increasing surgical procedures, and a rising demand for minimally invasive surgeries. Regulatory support from agencies like the FDA further catalyzes innovation and adoption of new technologies in surgical devices. The United States is the primary contributor, with key players such as Medtronic, Johnson & Johnson, and Ethicon leading the market. The competitive landscape is characterized by continuous innovation and strategic partnerships among these companies. The presence of established healthcare systems and a focus on improving surgical outcomes are pivotal in maintaining North America's market dominance.

Europe : Emerging Market with Potential

Europe is the second-largest market for automated suturing devices, accounting for around 30% of the global market share. The region's growth is fueled by increasing investments in healthcare technology, a growing elderly population, and a shift towards minimally invasive surgical techniques. Regulatory frameworks, such as the EU Medical Device Regulation, ensure safety and efficacy, promoting market growth. Leading countries include Germany, the UK, and France, where companies like B. Braun and Surgical Innovations are making significant strides. The competitive landscape is marked by a mix of established firms and innovative startups, fostering a dynamic environment for technological advancements. The focus on improving patient outcomes and reducing recovery times is driving demand for automated suturing devices.

Asia-Pacific : Rapidly Growing Market

Asia-Pacific is witnessing rapid growth in the automated suturing devices market, holding approximately 20% of the global market share. The region's expansion is driven by increasing healthcare expenditure, a rising number of surgical procedures, and a growing awareness of advanced surgical technologies. Countries like China and India are at the forefront, supported by government initiatives to improve healthcare infrastructure and access to medical devices. China is the largest market in the region, with significant contributions from local manufacturers and international players. The competitive landscape is evolving, with a mix of established companies and emerging startups focusing on innovation. The demand for minimally invasive surgeries is propelling the adoption of automated suturing devices, making Asia-Pacific a key player in the global market.

Middle East and Africa : Untapped Market Potential

The Middle East and Africa region is gradually emerging in the automated suturing devices market, holding about 5% of the global market share. The growth is driven by increasing healthcare investments, a rising prevalence of chronic diseases, and a growing focus on improving surgical outcomes. Regulatory bodies are beginning to establish frameworks that support the introduction of advanced medical technologies, which is crucial for market development. Countries like South Africa and the UAE are leading the market, with a growing number of healthcare facilities adopting advanced surgical technologies. The competitive landscape is still developing, with opportunities for both local and international players to enter the market. The increasing demand for minimally invasive surgeries is expected to drive the growth of automated suturing devices in this region.

Key Companies in the Automated Suturing Devices Market market include

Industry Developments

Future Outlook

Automated Suturing Devices Market Future Outlook

<p>The Automated Suturing Devices Market is projected to grow at a 7.08% CAGR from 2024 to 2035, driven by technological advancements, increasing surgical procedures, and rising demand for minimally invasive surgeries.</p>

New opportunities lie in:

  • <p>Expansion into emerging markets with tailored product offerings.</p>
  • <p>Development of AI-integrated suturing devices for enhanced precision.</p>
  • <p>Partnerships with hospitals for exclusive supply agreements.</p>

<p>By 2035, the market is expected to achieve substantial growth, solidifying its position as a key player in surgical innovation.</p>

Market Segmentation

Automated Suturing Devices Market Source Outlook

  • Ethicon
  • Smith and Nephew plc
  • Medtronic plc
  • EndoEvolution
  • Apollo Endosurgery
  • Others

Automated Suturing Devices Market End Users Outlook

  • Ambulatory/Outpatient Surgical Center
  • Clinics and hospitals
  • Others

Automated Suturing Devices Market Application Outlook

  • Gynecological
  • Orthopedic
  • Cardiovascular
  • Ophthalmic
  • Dental
  • Others

Automated Suturing Devices Market Product Type Outlook

  • Disposable
  • Reusable

Report Scope

MARKET SIZE 20243.459(USD Billion)
MARKET SIZE 20253.704(USD Billion)
MARKET SIZE 20357.34(USD Billion)
COMPOUND ANNUAL GROWTH RATE (CAGR)7.08% (2024 - 2035)
REPORT COVERAGERevenue Forecast, Competitive Landscape, Growth Factors, and Trends
BASE YEAR2024
Market Forecast Period2025 - 2035
Historical Data2019 - 2024
Market Forecast UnitsUSD Billion
Key Companies ProfiledMarket analysis in progress
Segments CoveredMarket segmentation analysis in progress
Key Market OpportunitiesIntegration of advanced robotics and artificial intelligence enhances precision in the Automated Suturing Devices Market.
Key Market DynamicsTechnological advancements and regulatory changes drive innovation and competition in the Automated Suturing Devices Market.
Countries CoveredNorth America, Europe, APAC, South America, MEA

FAQs

What is the projected market valuation for the Automated Suturing Devices Market in 2035?

The projected market valuation for the Automated Suturing Devices Market in 2035 is 7.34 USD Billion.

What was the market valuation for Automated Suturing Devices in 2024?

The market valuation for Automated Suturing Devices in 2024 was 3.459 USD Billion.

What is the expected CAGR for the Automated Suturing Devices Market from 2025 to 2035?

The expected CAGR for the Automated Suturing Devices Market during the forecast period 2025 - 2035 is 7.08%.

Which companies are considered key players in the Automated Suturing Devices Market?

Key players in the Automated Suturing Devices Market include Medtronic, Johnson & Johnson, Surgical Innovations, Boston Scientific, Ethicon, Conmed, Apollo Endosurgery, Stryker, and B. Braun.

What are the projected revenues for disposable and reusable automated suturing devices by 2035?

By 2035, disposable automated suturing devices are projected to generate revenues of 3.2 USD Billion, while reusable devices may reach 4.14 USD Billion.

  1. SECTION I: EXECUTIVE SUMMARY AND KEY HIGHLIGHTS
    1. EXECUTIVE SUMMARY
      1. Market Overview
      2. Key Findings
      3. Market Segmentation
      4. Competitive Landscape
      5. Challenges and Opportunities
      6. Future Outlook
  2. SECTION II: SCOPING, METHODOLOGY AND MARKET STRUCTURE
    1. MARKET INTRODUCTION
      1. Definition
      2. Scope of the study
    2. RESEARCH METHODOLOGY
      1. Overview
      2. Data Mining
      3. Secondary Research
      4. Primary Research
      5. Forecasting Model
      6. Market Size Estimation
      7. Data Triangulation
      8. Validation
  3. SECTION III: QUALITATIVE ANALYSIS
    1. MARKET DYNAMICS
      1. Overview
      2. Drivers
      3. Restraints
      4. Opportunities
    2. MARKET FACTOR ANALYSIS
      1. Value chain Analysis
      2. Porter's Five Forces Analysis
      3. COVID-19 Impact Analysis
  4. SECTION IV: QUANTITATIVE ANALYSIS
    1. Healthcare, BY Source (USD Billion)
      1. Ethicon
      2. Smith and Nephew plc
      3. Medtronic plc
      4. EndoEvolution
      5. Apollo Endosurgery
      6. Others
    2. Healthcare, BY Product Type (USD Billion)
      1. Disposable
      2. Reusable
    3. Healthcare, BY Application (USD Billion)
      1. Gynecological
      2. Orthopedic
      3. Cardiovascular
      4. Ophthalmic
      5. Dental
      6. Others
    4. Healthcare, BY End Users (USD Billion)
      1. Ambulatory/Outpatient Surgical Center
      2. Clinics and hospitals
      3. Others
    5. Healthcare, BY Region (USD Billion)
      1. North America
      2. Europe
      3. APAC
      4. South America
      5. MEA
  5. SECTION V: COMPETITIVE ANALYSIS
    1. Competitive Landscape
      1. Overview
      2. Competitive Analysis
      3. Market share Analysis
      4. Major Growth Strategy in the Healthcare
      5. Competitive Benchmarking
      6. Leading Players in Terms of Number of Developments in the Healthcare
      7. Key developments and growth strategies
      8. Major Players Financial Matrix
    2. Company Profiles
      1. Medtronic (US)
      2. Johnson & Johnson (US)
      3. Surgical Innovations (GB)
      4. Boston Scientific (US)
      5. Ethicon (US)
      6. Conmed (US)
      7. Apollo Endosurgery (US)
      8. Stryker (US)
      9. B. Braun (DE)
    3. Appendix
      1. References
      2. Related Reports
  6. LIST OF FIGURES
    1. MARKET SYNOPSIS
    2. NORTH AMERICA MARKET ANALYSIS
    3. US MARKET ANALYSIS BY SOURCE
    4. US MARKET ANALYSIS BY PRODUCT TYPE
    5. US MARKET ANALYSIS BY APPLICATION
    6. US MARKET ANALYSIS BY END USERS
    7. CANADA MARKET ANALYSIS BY SOURCE
    8. CANADA MARKET ANALYSIS BY PRODUCT TYPE
    9. CANADA MARKET ANALYSIS BY APPLICATION
    10. CANADA MARKET ANALYSIS BY END USERS
    11. EUROPE MARKET ANALYSIS
    12. GERMANY MARKET ANALYSIS BY SOURCE
    13. GERMANY MARKET ANALYSIS BY PRODUCT TYPE
    14. GERMANY MARKET ANALYSIS BY APPLICATION
    15. GERMANY MARKET ANALYSIS BY END USERS
    16. UK MARKET ANALYSIS BY SOURCE
    17. UK MARKET ANALYSIS BY PRODUCT TYPE
    18. UK MARKET ANALYSIS BY APPLICATION
    19. UK MARKET ANALYSIS BY END USERS
    20. FRANCE MARKET ANALYSIS BY SOURCE
    21. FRANCE MARKET ANALYSIS BY PRODUCT TYPE
    22. FRANCE MARKET ANALYSIS BY APPLICATION
    23. FRANCE MARKET ANALYSIS BY END USERS
    24. RUSSIA MARKET ANALYSIS BY SOURCE
    25. RUSSIA MARKET ANALYSIS BY PRODUCT TYPE
    26. RUSSIA MARKET ANALYSIS BY APPLICATION
    27. RUSSIA MARKET ANALYSIS BY END USERS
    28. ITALY MARKET ANALYSIS BY SOURCE
    29. ITALY MARKET ANALYSIS BY PRODUCT TYPE
    30. ITALY MARKET ANALYSIS BY APPLICATION
    31. ITALY MARKET ANALYSIS BY END USERS
    32. SPAIN MARKET ANALYSIS BY SOURCE
    33. SPAIN MARKET ANALYSIS BY PRODUCT TYPE
    34. SPAIN MARKET ANALYSIS BY APPLICATION
    35. SPAIN MARKET ANALYSIS BY END USERS
    36. REST OF EUROPE MARKET ANALYSIS BY SOURCE
    37. REST OF EUROPE MARKET ANALYSIS BY PRODUCT TYPE
    38. REST OF EUROPE MARKET ANALYSIS BY APPLICATION
    39. REST OF EUROPE MARKET ANALYSIS BY END USERS
    40. APAC MARKET ANALYSIS
    41. CHINA MARKET ANALYSIS BY SOURCE
    42. CHINA MARKET ANALYSIS BY PRODUCT TYPE
    43. CHINA MARKET ANALYSIS BY APPLICATION
    44. CHINA MARKET ANALYSIS BY END USERS
    45. INDIA MARKET ANALYSIS BY SOURCE
    46. INDIA MARKET ANALYSIS BY PRODUCT TYPE
    47. INDIA MARKET ANALYSIS BY APPLICATION
    48. INDIA MARKET ANALYSIS BY END USERS
    49. JAPAN MARKET ANALYSIS BY SOURCE
    50. JAPAN MARKET ANALYSIS BY PRODUCT TYPE
    51. JAPAN MARKET ANALYSIS BY APPLICATION
    52. JAPAN MARKET ANALYSIS BY END USERS
    53. SOUTH KOREA MARKET ANALYSIS BY SOURCE
    54. SOUTH KOREA MARKET ANALYSIS BY PRODUCT TYPE
    55. SOUTH KOREA MARKET ANALYSIS BY APPLICATION
    56. SOUTH KOREA MARKET ANALYSIS BY END USERS
    57. MALAYSIA MARKET ANALYSIS BY SOURCE
    58. MALAYSIA MARKET ANALYSIS BY PRODUCT TYPE
    59. MALAYSIA MARKET ANALYSIS BY APPLICATION
    60. MALAYSIA MARKET ANALYSIS BY END USERS
    61. THAILAND MARKET ANALYSIS BY SOURCE
    62. THAILAND MARKET ANALYSIS BY PRODUCT TYPE
    63. THAILAND MARKET ANALYSIS BY APPLICATION
    64. THAILAND MARKET ANALYSIS BY END USERS
    65. INDONESIA MARKET ANALYSIS BY SOURCE
    66. INDONESIA MARKET ANALYSIS BY PRODUCT TYPE
    67. INDONESIA MARKET ANALYSIS BY APPLICATION
    68. INDONESIA MARKET ANALYSIS BY END USERS
    69. REST OF APAC MARKET ANALYSIS BY SOURCE
    70. REST OF APAC MARKET ANALYSIS BY PRODUCT TYPE
    71. REST OF APAC MARKET ANALYSIS BY APPLICATION
    72. REST OF APAC MARKET ANALYSIS BY END USERS
    73. SOUTH AMERICA MARKET ANALYSIS
    74. BRAZIL MARKET ANALYSIS BY SOURCE
    75. BRAZIL MARKET ANALYSIS BY PRODUCT TYPE
    76. BRAZIL MARKET ANALYSIS BY APPLICATION
    77. BRAZIL MARKET ANALYSIS BY END USERS
    78. MEXICO MARKET ANALYSIS BY SOURCE
    79. MEXICO MARKET ANALYSIS BY PRODUCT TYPE
    80. MEXICO MARKET ANALYSIS BY APPLICATION
    81. MEXICO MARKET ANALYSIS BY END USERS
    82. ARGENTINA MARKET ANALYSIS BY SOURCE
    83. ARGENTINA MARKET ANALYSIS BY PRODUCT TYPE
    84. ARGENTINA MARKET ANALYSIS BY APPLICATION
    85. ARGENTINA MARKET ANALYSIS BY END USERS
    86. REST OF SOUTH AMERICA MARKET ANALYSIS BY SOURCE
    87. REST OF SOUTH AMERICA MARKET ANALYSIS BY PRODUCT TYPE
    88. REST OF SOUTH AMERICA MARKET ANALYSIS BY APPLICATION
    89. REST OF SOUTH AMERICA MARKET ANALYSIS BY END USERS
    90. MEA MARKET ANALYSIS
    91. GCC COUNTRIES MARKET ANALYSIS BY SOURCE
    92. GCC COUNTRIES MARKET ANALYSIS BY PRODUCT TYPE
    93. GCC COUNTRIES MARKET ANALYSIS BY APPLICATION
    94. GCC COUNTRIES MARKET ANALYSIS BY END USERS
    95. SOUTH AFRICA MARKET ANALYSIS BY SOURCE
    96. SOUTH AFRICA MARKET ANALYSIS BY PRODUCT TYPE
    97. SOUTH AFRICA MARKET ANALYSIS BY APPLICATION
    98. SOUTH AFRICA MARKET ANALYSIS BY END USERS
    99. REST OF MEA MARKET ANALYSIS BY SOURCE
    100. REST OF MEA MARKET ANALYSIS BY PRODUCT TYPE
    101. REST OF MEA MARKET ANALYSIS BY APPLICATION
    102. REST OF MEA MARKET ANALYSIS BY END USERS
    103. KEY BUYING CRITERIA OF HEALTHCARE
    104. RESEARCH PROCESS OF MRFR
    105. DRO ANALYSIS OF HEALTHCARE
    106. DRIVERS IMPACT ANALYSIS: HEALTHCARE
    107. RESTRAINTS IMPACT ANALYSIS: HEALTHCARE
    108. SUPPLY / VALUE CHAIN: HEALTHCARE
    109. HEALTHCARE, BY SOURCE, 2024 (% SHARE)
    110. HEALTHCARE, BY SOURCE, 2024 TO 2035 (USD Billion)
    111. HEALTHCARE, BY PRODUCT TYPE, 2024 (% SHARE)
    112. HEALTHCARE, BY PRODUCT TYPE, 2024 TO 2035 (USD Billion)
    113. HEALTHCARE, BY APPLICATION, 2024 (% SHARE)
    114. HEALTHCARE, BY APPLICATION, 2024 TO 2035 (USD Billion)
    115. HEALTHCARE, BY END USERS, 2024 (% SHARE)
    116. HEALTHCARE, BY END USERS, 2024 TO 2035 (USD Billion)
    117. BENCHMARKING OF MAJOR COMPETITORS
  7. LIST OF TABLES
    1. LIST OF ASSUMPTIONS
    2. North America MARKET SIZE ESTIMATES; FORECAST
      1. BY SOURCE, 2025-2035 (USD Billion)
      2. BY PRODUCT TYPE, 2025-2035 (USD Billion)
      3. BY APPLICATION, 2025-2035 (USD Billion)
      4. BY END USERS, 2025-2035 (USD Billion)
    3. US MARKET SIZE ESTIMATES; FORECAST
      1. BY SOURCE, 2025-2035 (USD Billion)
      2. BY PRODUCT TYPE, 2025-2035 (USD Billion)
      3. BY APPLICATION, 2025-2035 (USD Billion)
      4. BY END USERS, 2025-2035 (USD Billion)
    4. Canada MARKET SIZE ESTIMATES; FORECAST
      1. BY SOURCE, 2025-2035 (USD Billion)
      2. BY PRODUCT TYPE, 2025-2035 (USD Billion)
      3. BY APPLICATION, 2025-2035 (USD Billion)
      4. BY END USERS, 2025-2035 (USD Billion)
    5. Europe MARKET SIZE ESTIMATES; FORECAST
      1. BY SOURCE, 2025-2035 (USD Billion)
      2. BY PRODUCT TYPE, 2025-2035 (USD Billion)
      3. BY APPLICATION, 2025-2035 (USD Billion)
      4. BY END USERS, 2025-2035 (USD Billion)
    6. Germany MARKET SIZE ESTIMATES; FORECAST
      1. BY SOURCE, 2025-2035 (USD Billion)
      2. BY PRODUCT TYPE, 2025-2035 (USD Billion)
      3. BY APPLICATION, 2025-2035 (USD Billion)
      4. BY END USERS, 2025-2035 (USD Billion)
    7. UK MARKET SIZE ESTIMATES; FORECAST
      1. BY SOURCE, 2025-2035 (USD Billion)
      2. BY PRODUCT TYPE, 2025-2035 (USD Billion)
      3. BY APPLICATION, 2025-2035 (USD Billion)
      4. BY END USERS, 2025-2035 (USD Billion)
    8. France MARKET SIZE ESTIMATES; FORECAST
      1. BY SOURCE, 2025-2035 (USD Billion)
      2. BY PRODUCT TYPE, 2025-2035 (USD Billion)
      3. BY APPLICATION, 2025-2035 (USD Billion)
      4. BY END USERS, 2025-2035 (USD Billion)
    9. Russia MARKET SIZE ESTIMATES; FORECAST
      1. BY SOURCE, 2025-2035 (USD Billion)
      2. BY PRODUCT TYPE, 2025-2035 (USD Billion)
      3. BY APPLICATION, 2025-2035 (USD Billion)
      4. BY END USERS, 2025-2035 (USD Billion)
    10. Italy MARKET SIZE ESTIMATES; FORECAST
      1. BY SOURCE, 2025-2035 (USD Billion)
      2. BY PRODUCT TYPE, 2025-2035 (USD Billion)
      3. BY APPLICATION, 2025-2035 (USD Billion)
      4. BY END USERS, 2025-2035 (USD Billion)
    11. Spain MARKET SIZE ESTIMATES; FORECAST
      1. BY SOURCE, 2025-2035 (USD Billion)
      2. BY PRODUCT TYPE, 2025-2035 (USD Billion)
      3. BY APPLICATION, 2025-2035 (USD Billion)
      4. BY END USERS, 2025-2035 (USD Billion)
    12. Rest of Europe MARKET SIZE ESTIMATES; FORECAST
      1. BY SOURCE, 2025-2035 (USD Billion)
      2. BY PRODUCT TYPE, 2025-2035 (USD Billion)
      3. BY APPLICATION, 2025-2035 (USD Billion)
      4. BY END USERS, 2025-2035 (USD Billion)
    13. APAC MARKET SIZE ESTIMATES; FORECAST
      1. BY SOURCE, 2025-2035 (USD Billion)
      2. BY PRODUCT TYPE, 2025-2035 (USD Billion)
      3. BY APPLICATION, 2025-2035 (USD Billion)
      4. BY END USERS, 2025-2035 (USD Billion)
    14. China MARKET SIZE ESTIMATES; FORECAST
      1. BY SOURCE, 2025-2035 (USD Billion)
      2. BY PRODUCT TYPE, 2025-2035 (USD Billion)
      3. BY APPLICATION, 2025-2035 (USD Billion)
      4. BY END USERS, 2025-2035 (USD Billion)
    15. India MARKET SIZE ESTIMATES; FORECAST
      1. BY SOURCE, 2025-2035 (USD Billion)
      2. BY PRODUCT TYPE, 2025-2035 (USD Billion)
      3. BY APPLICATION, 2025-2035 (USD Billion)
      4. BY END USERS, 2025-2035 (USD Billion)
    16. Japan MARKET SIZE ESTIMATES; FORECAST
      1. BY SOURCE, 2025-2035 (USD Billion)
      2. BY PRODUCT TYPE, 2025-2035 (USD Billion)
      3. BY APPLICATION, 2025-2035 (USD Billion)
      4. BY END USERS, 2025-2035 (USD Billion)
    17. South Korea MARKET SIZE ESTIMATES; FORECAST
      1. BY SOURCE, 2025-2035 (USD Billion)
      2. BY PRODUCT TYPE, 2025-2035 (USD Billion)
      3. BY APPLICATION, 2025-2035 (USD Billion)
      4. BY END USERS, 2025-2035 (USD Billion)
    18. Malaysia MARKET SIZE ESTIMATES; FORECAST
      1. BY SOURCE, 2025-2035 (USD Billion)
      2. BY PRODUCT TYPE, 2025-2035 (USD Billion)
      3. BY APPLICATION, 2025-2035 (USD Billion)
      4. BY END USERS, 2025-2035 (USD Billion)
    19. Thailand MARKET SIZE ESTIMATES; FORECAST
      1. BY SOURCE, 2025-2035 (USD Billion)
      2. BY PRODUCT TYPE, 2025-2035 (USD Billion)
      3. BY APPLICATION, 2025-2035 (USD Billion)
      4. BY END USERS, 2025-2035 (USD Billion)
    20. Indonesia MARKET SIZE ESTIMATES; FORECAST
      1. BY SOURCE, 2025-2035 (USD Billion)
      2. BY PRODUCT TYPE, 2025-2035 (USD Billion)
      3. BY APPLICATION, 2025-2035 (USD Billion)
      4. BY END USERS, 2025-2035 (USD Billion)
    21. Rest of APAC MARKET SIZE ESTIMATES; FORECAST
      1. BY SOURCE, 2025-2035 (USD Billion)
      2. BY PRODUCT TYPE, 2025-2035 (USD Billion)
      3. BY APPLICATION, 2025-2035 (USD Billion)
      4. BY END USERS, 2025-2035 (USD Billion)
    22. South America MARKET SIZE ESTIMATES; FORECAST
      1. BY SOURCE, 2025-2035 (USD Billion)
      2. BY PRODUCT TYPE, 2025-2035 (USD Billion)
      3. BY APPLICATION, 2025-2035 (USD Billion)
      4. BY END USERS, 2025-2035 (USD Billion)
    23. Brazil MARKET SIZE ESTIMATES; FORECAST
      1. BY SOURCE, 2025-2035 (USD Billion)
      2. BY PRODUCT TYPE, 2025-2035 (USD Billion)
      3. BY APPLICATION, 2025-2035 (USD Billion)
      4. BY END USERS, 2025-2035 (USD Billion)
    24. Mexico MARKET SIZE ESTIMATES; FORECAST
      1. BY SOURCE, 2025-2035 (USD Billion)
      2. BY PRODUCT TYPE, 2025-2035 (USD Billion)
      3. BY APPLICATION, 2025-2035 (USD Billion)
      4. BY END USERS, 2025-2035 (USD Billion)
    25. Argentina MARKET SIZE ESTIMATES; FORECAST
      1. BY SOURCE, 2025-2035 (USD Billion)
      2. BY PRODUCT TYPE, 2025-2035 (USD Billion)
      3. BY APPLICATION, 2025-2035 (USD Billion)
      4. BY END USERS, 2025-2035 (USD Billion)
    26. Rest of South America MARKET SIZE ESTIMATES; FORECAST
      1. BY SOURCE, 2025-2035 (USD Billion)
      2. BY PRODUCT TYPE, 2025-2035 (USD Billion)
      3. BY APPLICATION, 2025-2035 (USD Billion)
      4. BY END USERS, 2025-2035 (USD Billion)
    27. MEA MARKET SIZE ESTIMATES; FORECAST
      1. BY SOURCE, 2025-2035 (USD Billion)
      2. BY PRODUCT TYPE, 2025-2035 (USD Billion)
      3. BY APPLICATION, 2025-2035 (USD Billion)
      4. BY END USERS, 2025-2035 (USD Billion)
    28. GCC Countries MARKET SIZE ESTIMATES; FORECAST
      1. BY SOURCE, 2025-2035 (USD Billion)
      2. BY PRODUCT TYPE, 2025-2035 (USD Billion)
      3. BY APPLICATION, 2025-2035 (USD Billion)
      4. BY END USERS, 2025-2035 (USD Billion)
    29. South Africa MARKET SIZE ESTIMATES; FORECAST
      1. BY SOURCE, 2025-2035 (USD Billion)
      2. BY PRODUCT TYPE, 2025-2035 (USD Billion)
      3. BY APPLICATION, 2025-2035 (USD Billion)
      4. BY END USERS, 2025-2035 (USD Billion)
    30. Rest of MEA MARKET SIZE ESTIMATES; FORECAST
      1. BY SOURCE, 2025-2035 (USD Billion)
      2. BY PRODUCT TYPE, 2025-2035 (USD Billion)
      3. BY APPLICATION, 2025-2035 (USD Billion)
      4. BY END USERS, 2025-2035 (USD Billion)
    31. PRODUCT LAUNCH/PRODUCT DEVELOPMENT/APPROVAL
    32. ACQUISITION/PARTNERSHIP

Automated Suturing Devices Market Segmentation

Market Segmentation Overview

  • Detailed segmentation data will be available in the full report
  • Comprehensive analysis by multiple parameters
  • Regional and country-level breakdowns
  • Market size forecasts by segment
Infographic

Free Sample Request

Kindly complete the form below to receive a free sample of this Report

Get Free Sample

Customer Strories

“I am very pleased with how market segments have been defined in a relevant way for my purposes (such as "Portable Freezers & refrigerators" and "last-mile"). In general the report is well structured. Thanks very much for your efforts.”

Victoria Milne

Founder

Compare Licence

×
Features License Type
Single User Multiuser License Enterprise User
Price $4,950 $5,950 $7,250
Maximum User Access Limit 1 User Upto 10 Users Unrestricted Access Throughout the Organization
Free Customization
Direct Access to Analyst
Deliverable Format
Platform Access
Discount on Next Purchase 10% 15% 15%
Printable Versions