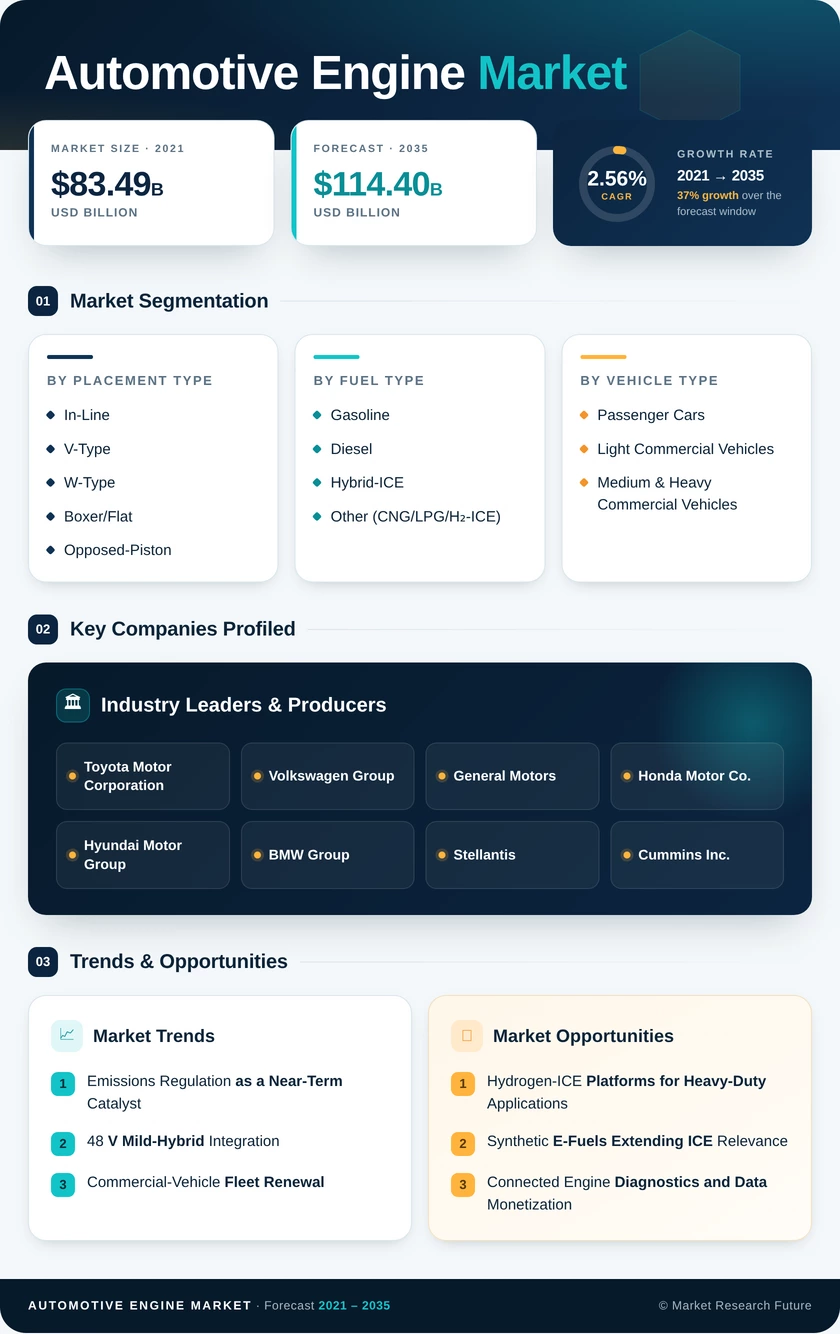
Automotive Engine Market (2026 - 2035)

ID: MRFR/AT/1612-HCR
100 Pages
Shubham Munde
Last Updated: August 06, 2026
Automotive Engine Market Research Report By Placement Type (In-Line, V-Type, W-Type, Boxer/Flat, Opposed-Piston), By Fuel Type (Gasoline, Diesel, Hybrid-ICE, Other (CNG/LPG/H₂-ICE)), By Vehicle Type (Passenger Cars, Light Commercial Vehicles, Medium & Heavy Commercial Vehicles), By Engine Capacity (Below 1.5 L, 1.5–3 L, Over 3 L) and By Regional (North America, Europe, South America, Asia Pacific, Middle East and Africa) - Forecast to 2035
Automotive Engine Market
Market Size
Forecast Period2026-2035
CAGR (2026-2035)2.56%
2021 Market Size89.22 USD Billion
2023 Market Size91.13 USD Billion
Key Players
Toyota Motor Corporation
Volkswagen Group
General Motors
Honda Motor Co.
Hyundai Motor Group
BMW Group
Opportunities
  • Hydrogen-ICE Platforms for Heavy-Duty Applications
  • Synthetic E-Fuels Extending ICE Relevance
  • Connected Engine Diagnostics and Data Monetization
  1. 1 Market Overview |
    1. 1.1 Study Assumptions & Market Definition |
    2. 1.2 Scope of the Study |
    3. 1.3 Research Methodology
  2. 2 Market Summary & Key Takeaways
  3. 3 Market Dynamics |
    1. 3.1 Market Drivers Analysis | |
      1. 3.1.1 Emissions Regulation Tightening (Euro 7, China VII, BS-VII) | |
      2. 3.1.2 48 V Mild-Hybrid Integration Mandates | |
      3. 3.1.3 Commercial-Vehicle Fleet Replacement Cycles | |
      4. 3.1.4 ASEAN and South Asian Vehicle Penetration | |
      5. 3.1.5 Synthetic E-Fuel and Hydrogen-ICE R&D | |
      6. 3.1.6 Advanced Thermal Management and After-Treatment | |
      7. 3.1.7 Light-Truck and SUV Engine Upsizing in North America |
    2. 3.2 Market Restraints Analysis | |
      1. 3.2.1 BEV Adoption Displacing ICE Volumes | |
      2. 3.2.2 Escalating Raw-Material and Manufacturing Costs | |
      3. 3.2.3 Urban Zero-Emission Zones Restricting ICE Access | |
      4. 3.2.4 Tightening Recycling and End-of-Life Regulations | |
      5. 3.2.5 Consumer Sentiment Shifting Toward Electric Mobility |
    3. 3.3 Market Opportunity Analysis | |
      1. 3.3.1 Hydrogen-ICE Platforms for Heavy-Duty Applications | |
      2. 3.3.2 Synthetic E-Fuels Extending ICE Relevance | |
      3. 3.3.3 Connected Engine Diagnostics and Data Monetization | |
      4. 3.3.4 Emerging-Market Capacity Expansion in South Asia and Africa | |
      5. 3.3.5 Advanced After-Treatment as a Value-Add Platform |
    4. 3.4 Industry Value Chain Analysis |
    5. 3.5 Porter's Five Forces Analysis
  4. 4 Global Automotive Engine Market Size & Forecast (2021–2035) |
    1. 4.1 Historical Market Size (2021–2025) |
    2. 4.2 Current & Forecast Market Size (2026–2035) |
    3. 4.3 Market Size by Revenue (USD Billion) |
    4. 4.4 Year-over-Year Growth Analysis
  5. 5 Segmentation Analysis |
    1. 5.1 By Placement Type | |
      1. 5.1.1 In-Line | |
      2. 5.1.2 V-Type | |
      3. 5.1.3 W-Type | |
      4. 5.1.4 Boxer/Flat | |
      5. 5.1.5 Opposed-Piston |
    2. 5.2 By Fuel Type | |
      1. 5.2.1 Gasoline | |
      2. 5.2.2 Diesel | |
      3. 5.2.3 Hybrid-ICE | |
      4. 5.2.4 Other (CNG/LPG/H₂-ICE) |
    3. 5.3 By Vehicle Type | |
      1. 5.3.1 Passenger Cars | |
      2. 5.3.2 Light Commercial Vehicles | |
      3. 5.3.3 Medium & Heavy Commercial Vehicles |
    4. 5.4 By Engine Capacity | |
      1. 5.4.1 Below
    5. 1.5 L | |
      1. 5.4.3 Over 3 L
    6. 1.5–3 L | |
  6. 6 Regional Analysis |
    1. 6.1 North America | |
      1. 6.1.1 United States | |
      2. 6.1.2 Canada | |
      3. 6.1.3 Mexico |
    2. 6.2 Europe | |
      1. 6.2.1 Germany | |
      2. 6.2.2 United Kingdom | |
      3. 6.2.3 France | |
      4. 6.2.4 Italy | |
      5. 6.2.5 Spain | |
      6. 6.2.6 Nordic Countries | |
      7. 6.2.7 Russia | |
      8. 6.2.8 Rest of Europe |
    3. 6.3 Asia-Pacific | |
      1. 6.3.1 China | |
      2. 6.3.2 India | |
      3. 6.3.3 Japan | |
      4. 6.3.4 South Korea | |
      5. 6.3.5 ASEAN | |
      6. 6.3.6 Rest of Asia-Pacific |
    4. 6.4 South America | |
      1. 6.4.1 Brazil | |
      2. 6.4.2 Argentina | |
      3. 6.4.3 Rest of South America |
    5. 6.5 Middle East & Africa | |
      1. 6.5.1 Saudi Arabia | |
      2. 6.5.2 UAE | |
      3. 6.5.3 South Africa | |
      4. 6.5.4 Egypt | |
      5. 6.5.5 Rest of MEA
  7. 7 Competitive Landscape |
    1. 7.1 Market Share Analysis (2025) |
    2. 7.2 Competitive Benchmarking Matrix |
    3. 7.3 Company Profiles | |
      1. 7.3.1 Toyota Motor Corporation | |
      2. 7.3.2 Volkswagen Group | |
      3. 7.3.3 General Motors | |
      4. 7.3.4 Ford Motor Company | |
      5. 7.3.5 Honda Motor Co. | |
      6. 7.3.6 Hyundai Motor Group | |
      7. 7.3.7 BMW Group | |
      8. 7.3.8 Stellantis | |
      9. 7.3.9 Cummins Inc. | |
      10. 7.3.10 Mercedes-Benz Group
  8. 8 Future Outlook & Strategic Recommendations (2026–2035) |
    1. 8.1 Hybrid-Centric Powertrain Architectures |
    2. 8.2 Digitalization and AI-Driven Combustion Control |
    3. 8.3 Sustainable Fuels and Carbon-Neutral Combustion |
    4. 8.4 Circular Manufacturing and ESG Compliance
  9. 9 Recent Developments & News
  10. 10 Frequently Asked Questions (FAQs)
  11. 11 Report Scope & Methodology |
    1. 11.1 Study Period & Base Year |
    2. 11.2 Data Sources & Citations |
    3. 11.3 Abbreviations
  12. 12 LIST OF TABLES |
  13. TABLE 1 Global Automotive Engine Market Size & Forecast, by Revenue (USD Billion), 2021–2035 |
  14. TABLE 2 Global Automotive Engine Market — Year-over-Year Growth Analysis, 2021–2035 |
  15. TABLE 3 Global Automotive Engine Market — Driver Impact Analysis |
  16. TABLE 4 Global Automotive Engine Market — Restraint Impact Analysis |
  17. TABLE 5 Global Automotive Engine Market — Regional Summary, 2025 |
  18. TABLE 6 North America Automotive Engine Market, by Country, 2021–2035 |
  19. TABLE 7 Europe Automotive Engine Market, by Country, 2021–2035 |
  20. TABLE 8 Asia-Pacific Automotive Engine Market, by Country, 2021–2035 |
  21. TABLE 9 South America Automotive Engine Market, by Country, 2021–2035 |
  22. TABLE 10 Middle East & Africa Automotive Engine Market, by Country, 2021–2035 |
  23. TABLE 11 Global Automotive Engine Market Size, by Placement Type, 2021–2035 |
  24. TABLE 12 Global Automotive Engine Market Size, by Fuel Type, 2021–2035 |
  25. TABLE 13 Global Automotive Engine Market Size, by Vehicle Type, 2021–2035 |
  26. TABLE 14 Global Automotive Engine Market Size, by Engine Capacity, 2021–2035 |
  27. TABLE 15 Competitive Benchmarking Matrix — Global Automotive Engine Market, 2025 |
  28. TABLE 16 Report Scope & Methodology Summary |
  29. TABLE 17 Detailed Sources and Citations |
  30. TABLE 18 North America Automotive Engine Market Size, by Placement Type, 2021–2035 (USD Billion) |
  31. TABLE 19 North America Automotive Engine Market Size, by Fuel Type, 2021–2035 (USD Billion) |
  32. TABLE 20 North America Automotive Engine Market Size, by Vehicle Type, 2021–2035 (USD Billion) |
  33. TABLE 21 North America Automotive Engine Market Size, by Engine Capacity, 2021–2035 (USD Billion) |
  34. TABLE 22 Europe Automotive Engine Market Size, by Placement Type, 2021–2035 (USD Billion) |
  35. TABLE 23 Europe Automotive Engine Market Size, by Fuel Type, 2021–2035 (USD Billion) |
  36. TABLE 24 Europe Automotive Engine Market Size, by Vehicle Type, 2021–2035 (USD Billion) |
  37. TABLE 25 Europe Automotive Engine Market Size, by Engine Capacity, 2021–2035 (USD Billion) |
  38. TABLE 26 Asia-Pacific Automotive Engine Market Size, by Placement Type, 2021–2035 (USD Billion) |
  39. TABLE 27 Asia-Pacific Automotive Engine Market Size, by Fuel Type, 2021–2035 (USD Billion) |
  40. TABLE 28 Asia-Pacific Automotive Engine Market Size, by Vehicle Type, 2021–2035 (USD Billion) |
  41. TABLE 29 Asia-Pacific Automotive Engine Market Size, by Engine Capacity, 2021–2035 (USD Billion) |
  42. TABLE 30 South America Automotive Engine Market Size, by Placement Type, 2021–2035 (USD Billion) |
  43. TABLE 31 South America Automotive Engine Market Size, by Fuel Type, 2021–2035 (USD Billion) |
  44. TABLE 32 South America Automotive Engine Market Size, by Vehicle Type, 2021–2035 (USD Billion) |
  45. TABLE 33 South America Automotive Engine Market Size, by Engine Capacity, 2021–2035 (USD Billion) |
  46. TABLE 34 Middle East & Africa Automotive Engine Market Size, by Placement Type, 2021–2035 (USD Billion) |
  47. TABLE 35 Middle East & Africa Automotive Engine Market Size, by Fuel Type, 2021–2035 (USD Billion) |
  48. TABLE 36 Middle East & Africa Automotive Engine Market Size, by Vehicle Type, 2021–2035 (USD Billion) |
  49. TABLE 37 Middle East & Africa Automotive Engine Market Size, by Engine Capacity, 2021–2035 (USD Billion) |
  50. TABLE 38 United States Automotive Engine Market Size, by Placement Type, 2021–2035 (USD Billion) |
  51. TABLE 39 United States Automotive Engine Market Size, by Fuel Type, 2021–2035 (USD Billion) |
  52. TABLE 40 United States Automotive Engine Market Size, by Vehicle Type, 2021–2035 (USD Billion) |
  53. TABLE 41 United States Automotive Engine Market Size, by Engine Capacity, 2021–2035 (USD Billion) |
  54. TABLE 42 Canada Automotive Engine Market Size, by Placement Type, 2021–2035 (USD Billion) |
  55. TABLE 43 Canada Automotive Engine Market Size, by Fuel Type, 2021–2035 (USD Billion) |
  56. TABLE 44 Canada Automotive Engine Market Size, by Vehicle Type, 2021–2035 (USD Billion) |
  57. TABLE 45 Canada Automotive Engine Market Size, by Engine Capacity, 2021–2035 (USD Billion) |
  58. TABLE 46 Mexico Automotive Engine Market Size, by Placement Type, 2021–2035 (USD Billion) |
  59. TABLE 47 Mexico Automotive Engine Market Size, by Fuel Type, 2021–2035 (USD Billion) |
  60. TABLE 48 Mexico Automotive Engine Market Size, by Vehicle Type, 2021–2035 (USD Billion) |
  61. TABLE 49 Mexico Automotive Engine Market Size, by Engine Capacity, 2021–2035 (USD Billion) |
  62. TABLE 50 Germany Automotive Engine Market Size, by Placement Type, 2021–2035 (USD Billion) |
  63. TABLE 51 Germany Automotive Engine Market Size, by Fuel Type, 2021–2035 (USD Billion) |
  64. TABLE 52 Germany Automotive Engine Market Size, by Vehicle Type, 2021–2035 (USD Billion) |
  65. TABLE 53 Germany Automotive Engine Market Size, by Engine Capacity, 2021–2035 (USD Billion) |
  66. TABLE 54 UK Automotive Engine Market Size, by Placement Type, 2021–2035 (USD Billion) |
  67. TABLE 55 UK Automotive Engine Market Size, by Fuel Type, 2021–2035 (USD Billion) |
  68. TABLE 56 UK Automotive Engine Market Size, by Vehicle Type, 2021–2035 (USD Billion) |
  69. TABLE 57 UK Automotive Engine Market Size, by Engine Capacity, 2021–2035 (USD Billion) |
  70. TABLE 58 France Automotive Engine Market Size, by Placement Type, 2021–2035 (USD Billion) |
  71. TABLE 59 France Automotive Engine Market Size, by Fuel Type, 2021–2035 (USD Billion) |
  72. TABLE 60 France Automotive Engine Market Size, by Vehicle Type, 2021–2035 (USD Billion) |
  73. TABLE 61 France Automotive Engine Market Size, by Engine Capacity, 2021–2035 (USD Billion) |
  74. TABLE 62 China Automotive Engine Market Size, by Placement Type, 2021–2035 (USD Billion) |
  75. TABLE 63 China Automotive Engine Market Size, by Fuel Type, 2021–2035 (USD Billion) |
  76. TABLE 64 China Automotive Engine Market Size, by Vehicle Type, 2021–2035 (USD Billion) |
  77. TABLE 65 China Automotive Engine Market Size, by Engine Capacity, 2021–2035 (USD Billion) |
  78. TABLE 66 India Automotive Engine Market Size, by Placement Type, 2021–2035 (USD Billion) |
  79. TABLE 67 India Automotive Engine Market Size, by Fuel Type, 2021–2035 (USD Billion) |
  80. TABLE 68 India Automotive Engine Market Size, by Vehicle Type, 2021–2035 (USD Billion) |
  81. TABLE 69 India Automotive Engine Market Size, by Engine Capacity, 2021–2035 (USD Billion) |
  82. TABLE 70 Japan Automotive Engine Market Size, by Placement Type, 2021–2035 (USD Billion) |
  83. TABLE 71 Japan Automotive Engine Market Size, by Fuel Type, 2021–2035 (USD Billion) |
  84. TABLE 72 Japan Automotive Engine Market Size, by Vehicle Type, 2021–2035 (USD Billion) |
  85. TABLE 73 Japan Automotive Engine Market Size, by Engine Capacity, 2021–2035 (USD Billion) |
  86. TABLE 74 South Korea Automotive Engine Market Size, by Placement Type, 2021–2035 (USD Billion) |
  87. TABLE 75 South Korea Automotive Engine Market Size, by Fuel Type, 2021–2035 (USD Billion) |
  88. TABLE 76 South Korea Automotive Engine Market Size, by Vehicle Type, 2021–2035 (USD Billion) |
  89. TABLE 77 South Korea Automotive Engine Market Size, by Engine Capacity, 2021–2035 (USD Billion) |
  90. TABLE 78 Brazil Automotive Engine Market Size, by Placement Type, 2021–2035 (USD Billion) |
  91. TABLE 79 Brazil Automotive Engine Market Size, by Fuel Type, 2021–2035 (USD Billion) |
  92. TABLE 80 Brazil Automotive Engine Market Size, by Vehicle Type, 2021–2035 (USD Billion) |
  93. TABLE 81 Brazil Automotive Engine Market Size, by Engine Capacity, 2021–2035 (USD Billion) |
  94. TABLE 82 Saudi Arabia Automotive Engine Market Size, by Placement Type, 2021–2035 (USD Billion) |
  95. TABLE 83 Saudi Arabia Automotive Engine Market Size, by Fuel Type, 2021–2035 (USD Billion) |
  96. TABLE 84 Saudi Arabia Automotive Engine Market Size, by Vehicle Type, 2021–2035 (USD Billion) |
  97. TABLE 85 Saudi Arabia Automotive Engine Market Size, by Engine Capacity, 2021–2035 (USD Billion)
  98. 13 LIST OF FIGURES |
  99. FIGURE 1 Automotive Engine Market Dynamics — Drivers, Restraints, and Opportunities |
  100. FIGURE 2 Automotive Engine Market — Value Chain Analysis |
  101. FIGURE 3 Automotive Engine Market — Porter's Five Forces Analysis |
  102. FIGURE 4 Global Automotive Engine Market Size Trend & Forecast (USD Billion), 2021–2035 |
  103. FIGURE 5 Global Automotive Engine Market Share, by Placement Type, 2025 |
  104. FIGURE 6 Global Automotive Engine Market Share, by Fuel Type, 2025 |
  105. FIGURE 7 Global Automotive Engine Market Share, by Vehicle Type, 2025 |
  106. FIGURE 8 Global Automotive Engine Market Share, by Engine Capacity, 2025 |
  107. FIGURE 9 Global Automotive Engine Market Share, by Region, 2025 |
  108. FIGURE 10 North America Automotive Engine Market Size Trend (USD Billion), 2021–2035 |
  109. FIGURE 11 Europe Automotive Engine Market Size Trend (USD Billion), 2021–2035 |
  110. FIGURE 12 Asia-Pacific Automotive Engine Market Size Trend (USD Billion), 2021–2035 |
  111. FIGURE 13 South America Automotive Engine Market Size Trend (USD Billion), 2021–2035 |
  112. FIGURE 14 Middle East & Africa Automotive Engine Market Size Trend (USD Billion), 2021–2035 |
  113. FIGURE 15 Competitive Landscape — Market Share of Key Players, 2025

Segmentation Quick Reference

DimensionSub-SegmentsDominant SegmentFastest Growing Segment
By Placement TypeIn-Line, V-Type, W-Type, Boxer/Flat, Opposed-PistonIn-LineOpposed-Piston
By Fuel TypeGasoline, Diesel, Hybrid-ICE, Other (CNG/LPG/H₂-ICE)GasolineHybrid-ICE
By Vehicle TypePassenger Cars, Light Commercial Vehicles, Medium & Heavy Commercial VehiclesPassenger CarsMedium & Heavy Commercial Vehicles
By Engine CapacityBelow 1.5 L, 1.5–3 L, Over 3 L1.5–3 LBelow 1.5 L


Market Segmentation Overview

By Placement Type

Sub-SegmentKey Trend
In-LineDominates FWD passenger-car architectures; four-cylinder variants account for the bulk of global volume
V-TypeRetained in performance and full-size truck segments; gradual displacement by turbocharged in-line units
W-TypeNiche application in ultra-luxury vehicles (e.g., Bentley, Bugatti); limited production volumes
Boxer/FlatSubaru and Porsche maintain legacy platforms; low center-of-gravity advantage valued in sports cars.
Opposed-PistonCommercial-vehicle pilot programs targeting 15–20% fuel-efficiency improvement over conventional diesels


In-line engine layouts serve as the industry's workhorse configuration, offering packaging simplicity and manufacturing scale across the highest-volume vehicle classes. Opposed-piston designs, though still niche, are attracting defense and heavy-duty interest due to superior thermal efficiency and multi-fuel capability.

By Fuel Type

Sub-SegmentKey Trend
GasolineLargest segment globally; turbocharging and direct injection continue to improve power density.
DieselDeclining in European passenger cars but resilient in commercial vehicles and emerging markets
Hybrid-ICEFastest-growing sub-segment; 48 V and full-hybrid configurations proliferating across OEM line-ups
Other (CNG/LPG/H₂-ICE)Policy-driven adoption in South Asia (CNG) and pilot-stage hydrogen combustion in Japan and Europe


Gasoline engines maintain their dominant position owing to lower hardware cost and broad consumer preference. Hybrid-ICE configurations are reshaping the fuel-type landscape as automakers pursue compliance with CO₂ fleet targets without fully committing to battery-electric architectures.

By Vehicle Type

Sub-SegmentKey Trend
Passenger CarsLargest demand pool; facing strongest BEV substitution pressure in premium and urban segments
Light Commercial VehiclesStable demand driven by last-mile delivery and small-business fleets
Medium & Heavy Commercial VehiclesFastest-growing segment; diesel and hydrogen-ICE engines expected to dominate long-haul duty cycles


Passenger cars drive the majority of engine unit volumes, but the growth story over the coming decade centers on medium and heavy commercial vehicles where battery-electric alternatives face range, payload, and refueling-time constraints.

By Engine Capacity

Sub-SegmentKey Trend
Below 1.5 LFastest-growing capacity band; turbocharged downsized engines delivering competitive output levels
1.5–3 LMarket mainstream; serves the global SUV, sedan, and crossover segments.
Over 3 LPremium performance and full-size truck applications; stable but facing regulatory pressure


The 1.5-to-3-liter range remains the center of gravity for global engine production. Sub-1.5-liter engines are gaining share as forced-induction technology narrows the performance gap with larger-displacement units, particularly in price-sensitive Asian and South American markets.




Download PDF ×

We do not share your information with anyone. However, we may send you emails based on your report interest from time to time. You may contact us at any time to opt-out.