Autonomous Ships Market (2025 - 2035)

Autonomous Ships Market Size, Share, Industry Trend & Analysis Research Report By Autonomy Level (Partially Autonomous, Remotely Controlled, Fully Autonomous), By Component (Hardware, Software), By Ship Type (Cargo, Passenger, Defense), By End User (Commercial, Government & Military), By Propulsion (Conventional, Hybrid, Fully Electric), By Geography (North America, Europe, Asia-Pacific, South America, Middle East & Africa) - Forecast to 2035
ID: MRFR/AD/6631-HCR
200 Pages
Abbas Raut, Sejal Akre
Last Updated: July 12, 2026
Autonomous Ships Market
Market Size
Forecast Period2025-2035
CAGR (2025-2035)10.30%
2025 Market SizeUSD 7.35 Billion
2035 Market SizeUSD 19.62 Billion
Key Players
Kongsberg Maritime
Rolls-Royce
Wärtsilä
ABB Marine & Ports
HD Hyundai
Mitsui O.S.K. Lines
Opportunities
  • Short-Sea Autonomous Freight Corridors
  • Data Monetization through Digital-Twin Platforms
  • Emerging-Market Port Modernization

Autonomous Ships Market Summary

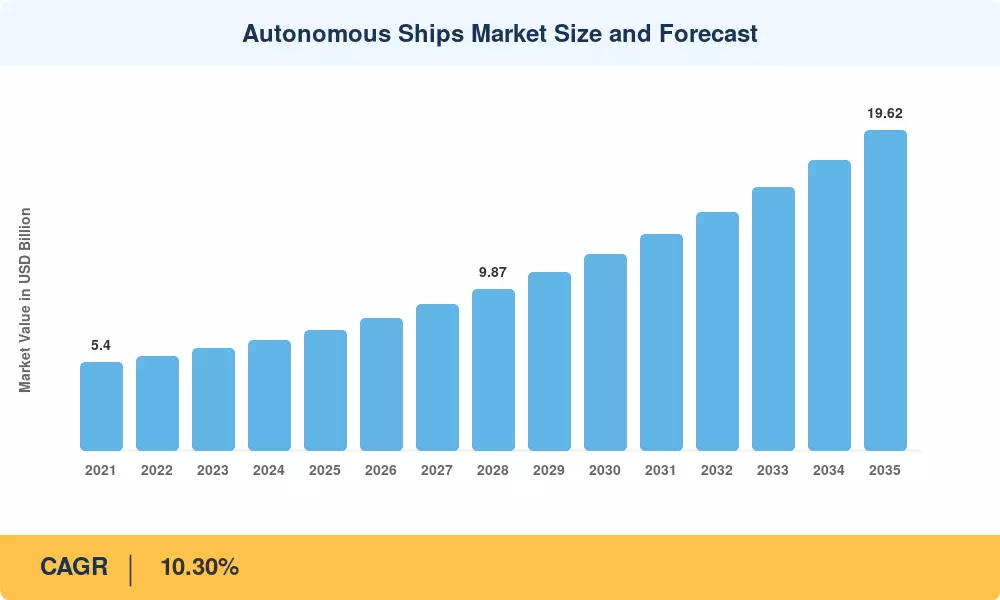
The Autonomous Ships Market was valued at USD 7.35 billion in 2025 and is projected to reach USD 8.11 billion in 2026 before climbing to USD 19.62 billion by 2035, registering a CAGR of 10.30% during the 2026–2035 forecast period. Two forces anchor this trajectory: the International Maritime Organization's (IMO) mandate to halve greenhouse-gas emissions by 2050, which is pushing fleet operators toward AI-assisted voyage optimization, and a sustained uptick in defense procurement budgets allocated to unmanned naval platforms across the Indo-Pacific theater [2]. Both catalysts translate directly into capital expenditure on autonomous navigation stacks, collision-avoidance sensors, and shore-based remote-control centers.

Integrated digital-twin platforms that combine LiDAR, high-definition cameras, and satellite-AIS inputs into a single situational-awareness layer are replacing legacy bridge equipment, such as radar consoles that depend on manual plotting, paper-based trip plans, and analog engine-room telegraphs [3]. Together, shipyards in China and South Korea have committed more than USD 2.1 billion to smart-ship construction initiatives through 2028, speeding up the pipeline for newbuilds and retrofits of autonomy-ready vessels [4].

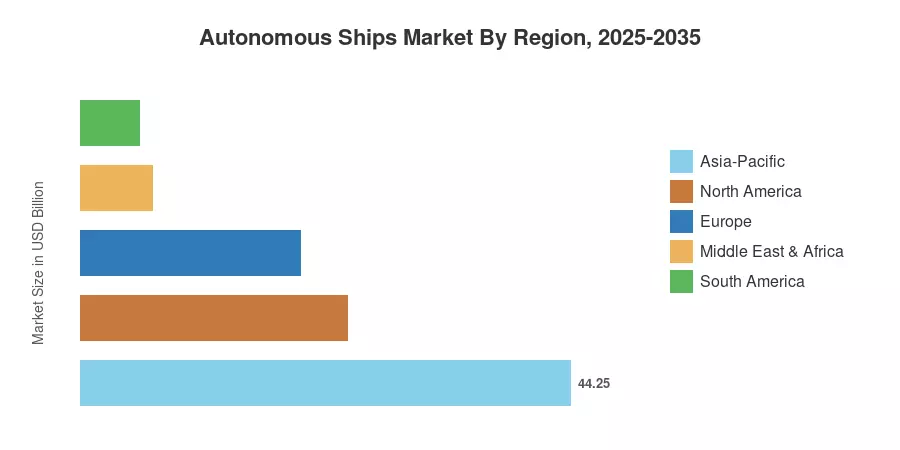
Due to concentrated shipbuilding capacity in China, Japan, and South Korea, the Asia-Pacific holds the largest share of the autonomous ships market, accounting for 44.25% of global revenue in 2025. The fastest-growing region is the Middle East and Africa, driven by maritime technology funds backed by sovereign wealth and massive port renovation projects. Europe has the second-largest stake, at about 20%, thanks to the EU's Horizon Europe maritime-autonomy research funding and Norway's regulatory leadership [5]. The rate at which classification societies complete type-approval procedures for completely autonomous ocean-going tonnage will determine the course of the next ten years.


Key Report Takeaways

• By Autonomy Level

  • Partially autonomous vessels captured 76.10% of the Autonomous Ships Market in 2025, reflecting fleet operators' preference for human-supervised systems during the regulatory transition.
  • Fully autonomous platforms are projected to advance at an 18.80% CAGR through 2035 as classification-society approvals expand.


• By Component

  • Hardware represented the dominant component segment of the Autonomous Ships Market, while software revenues are expanding at a 14.75% CAGR through 2035.

• By Ship Type & End User

  • Cargo vessels led with a 40.45% revenue share in 2025, underscoring the economic case for autonomous deep-sea freight operations.
  • The government and military end-user segment is projected to register a 15.40% CAGR through 2035.

• By Region

  • Asia-Pacific secured the largest regional slice of the Autonomous Ships Market in 2025.
  • The Middle East & Africa region is the fastest-growing geography through 2035, expanding at a 14.10% CAGR.


Autonomous Ships Market Size and Forecast (2021–2035)

Market sizing relies on a triangulated methodology combining top-down revenue analysis of marine-equipment OEMs with bottom-up vessel-delivery and retrofit data from leading classification societies. Historical estimates (2021–2024) draw on audited annual reports, port-authority procurement records, and verified contract values, while forecasts (2026–2035) apply regression modeling calibrated against shipyard order-book pipelines and regulatory milestone timelines [6].
Autonomous Ships Market Size and Forecast
Our Impact
Enabled $4.3B Revenue Impact for Fortune 500 and Leading Multinationals
Partnering with 2000+ Global Organizations Each Year
30K+ Citations by Top-Tier Firms in the Industry

Driver Impact Analysis

Driver ~% Impact on CAGR Geographic Relevance Impact Timeline
IMO MASS Code & flag-state certification +2.1% Global Medium-term (2–4 yr)
Defense USV procurement expansion +1.8% North America, Asia-Pacific Short-term (≤2 yr)
Decarbonization mandates (IMO 2050) +1.5% Global Long-term (≥4 yr)
LEO satellite connectivity deployment +1.3% Global Short-term (≤2 yr)
Edge-AI processor cost reductions +1.0% Asia-Pacific, Europe Medium-term (2–4 yr)
Crew-shortage economics +0.9% Europe, Asia-Pacific Long-term (≥4 yr)
Port-to-port digital corridor programs +0.7% Europe, the Middle East Medium-term (2–4 yr)


IMO MASS Code and Flag-State Certification

The International Maritime Organization adopted a non-mandatory International Code of Safety for Maritime Autonomous Surface Ships in May 2026. Setting a structured roadmap toward mandatory SOLAS amendments by January 2032, this unified goal-based framework establishes standardized criteria for surveys, certifications, and operational safety boundaries across all four defined degrees of vessel autonomy.


Defense USV Procurement Expansion

Military investments heavily accelerate autonomous capabilities, providing a robust dual-use technology baseline. The U.S. Navy Department's budget layout channels critical capital into testing and engineering unmanned surface vessels. This large-scale validation of long-range navigation, situational awareness, and redundant control architectures directly de-risks and accelerates subsequent technical deployment within the commercial merchant shipping fleet.


Decarbonization Mandates

The International Maritime Organization's 2023 Greenhouse Gas Strategy mandates a strict target to reduce total annual shipping emissions by at least 20%, striving for 30%, by 2030 compared to 2008. Additionally, carbon intensity per transport work must decline by 40%, forcing operators to utilize autonomous voyage-optimization algorithms to meet these critical international sustainability metrics


LEO Satellite Connectivity

Low Earth Orbit satellite networks have transformed maritime communication infrastructure by slashing data latency to under 40 milliseconds. This reliable, high-bandwidth throughput allows continuous shore-to-ship telemetry transmission. Consequently, remote operators can seamlessly execute real-time oversight and complex coastal pilotage maneuvers, eliminating the primary connectivity block restricting the growth of autonomous deep-sea vessel operations.


Restraints Impact Analysis

Restraint impacts are directional estimates of demand-dampening effects and should not be subtracted from the composite CAGR.

Restraint ~% Impact on CAGR Geographic Relevance Impact Timeline
Fragmented maritime cybersecurity standards –1.2% Global Medium-term (2–4 yr)
Crew-union and labor-regulation resistance –0.9% Europe, North America Long-term (≥4 yr)
High retrofit capital costs for legacy fleets –0.8% South America, MEA Short-term (≤2 yr)
Insurance and liability ambiguity –0.7% Global Medium-term (2–4 yr)
Satellite-bandwidth limitations in polar routes –0.4% Arctic, Antarctic corridors Long-term (≥4 yr)


Fragmented Maritime Cybersecurity Standards

The International Association of Classification Societies made Unified Requirements E26 and E27 mandatory for newbuilds contracted after July 2024. However, the United Nations Conference on Trade and Development highlights that fragmented national enforcement creates steep compliance loops, as less than 10% of global fleet tonnage currently satisfies uniform digital and cyber-resilience frameworks.


Crew-Union and Labor-Regulation Resistance

While modern systems support highly autonomous operations, labor regulations present a strict barrier. International Maritime Organization and International Labour Organization conventions dictate strict minimum manning frameworks for vessels exceeding 500 gross tonnage. These legal crew mandates completely negate structural personnel cost reductions, capping the immediate financial return on investment for remote-control operations.

High Retrofit Capital Costs

According to the United Nations Conference on Trade and Development, over 90% of the active global merchant fleet continues to run on conventional architectures. Upgrading these aging assets with advanced sensory arrays and automated controls requires immense capital expenditure without global financing mechanisms, setting an immediate adoption ceiling across developing regions and capital-constrained fleets.


Autonomous Ships Market Opportunities

Short-Sea Autonomous Freight Corridors

The United Nations Conference on Trade and Development emphasizes that intra-regional routes provide immediate pathways for automation. Driven by state-supported frameworks, projects like Japan's MEGURI 2040 initiative completed Phase 2 testing of its multi-vessel fleet operations center. These structured regional test zones accelerate commercialization timelines, proving remote-pilotage models safe for standard coastal merchant logistics.


Data Monetization through Digital-Twin Platforms

Modern international sensor standards yield highly standardized, continuous ship-to-shore telemetry. Regulatory frameworks under the International Maritime Organization increasingly value this transparent operational data. By feeding unified digital-twin platforms, operators create secondary value streams via verifiable data sharing with international safety bodies, environmental compliance auditors, and port infrastructure managers looking to maximize efficiency.


Emerging-Market Port Modernization

International transport assessments indicate that infrastructure readiness dictates modern vessel deployment rates. Official maritime expansion initiatives across the Middle East and East Asia are building next-generation terminal architectures. By directly integrating automated vessel-handling capabilities and standardized shore-to-ship connection networks into greenfield designs, these ports drastically lower regional adoption barriers for incoming autonomous fleets.


Autonomous Mine-Countermeasure and Survey Vessels

Official defense layout programs emphasize small autonomous surface craft as primary technical incubators. Government hydrographic and naval procurement plans allocate large-scale funding for unmanned survey vessels. These programs validate specialized sensor-fusion and real-time obstacle-avoidance algorithms within controlled, high-risk environments, creating a robust, government-funded technical baseline that seamlessly transfers into commercial merchant operations.


Autonomous Ships Market Future Outlook

AI-Driven Situational Awareness and Decision-Making

Edge-AI processors enable real-time obstacle classification at sea without shore-link dependency. By 2030, advanced automation systems will seamlessly assist standard collision avoidance to lower key operational risks. According to the International Maritime Organization, incorporating intelligent automation platforms optimizes structural navigation safety, effectively reducing human-error variables, which currently cause over 75% of recorded maritime accidents globally.


Platform Economics and Data-as-a-Service

Digital-twin platforms are evolving into fleet-wide operating systems that aggregate real-time performance data across hundreds of vessels. According to the United Nations Conference on Trade and Development, standardizing digital documentation and ship-to-shore telemetry maximizes global terminal efficiencies. This rapid digital evolution shifts long-term maritime value chains heavily toward continuous software support, predictive maintenance, and recurring operational data.


Electrification and Hybrid Propulsion Crossover

The International Energy Agency projects that transport electrification must expand rapidly alongside operational efficiency gains to reach net-zero goals. Autonomous navigation directly amplifies the financial case for alternative propulsion systems by utilizing predictive speed profiling. By optimizing energy consumption, these automated systems can reduce vessel fuel requirements and ownership costs by up to 10% annually.


ESG Reporting and Green-Finance Incentives

The International Maritime Organization's 2023 Greenhouse Gas Strategy sets mandatory benchmarks, targeting a 20% absolute emissions drop by 2030. Fleet operators integrating autonomous voyage-optimization modules report immediate progress toward compliance. Because financial frameworks increasingly link lending conditions to environmental metrics, verified emissions monitoring modules help early adopters secure favorable capital terms across international maritime networks.


Autonomous Ships Market Segmentation

By Autonomy Level

Segment Key Metric Primary Demand Driver
Partially Autonomous 76.10% share (2025) Regulatory familiarity; lower certification barrier
Remotely Controlled USD 0.88 Billion (2025) Shore-control-center expansion
Fully Autonomous CAGR of 18.80% (2026–2035) MASS Code degree-four approvals


Partially autonomous vessels dominate the Autonomous Ships Market because most flag states currently certify only degree-one and degree-two operations, keeping human operators in the primary decision loop. The business case rests on fuel savings of 8–12% per voyage through AI-assisted trim and speed optimization, without requiring the full regulatory clearance that degree-four autonomy demands [7].

Fully autonomous platforms — operating without any crew aboard — represent the fastest-growing frontier. Japan's MEGURI 2040 demonstrations and Kongsberg's Yara Birkeland have validated the technical feasibility, and classification societies are expected to finalize type-approval rules by 2028, triggering a wave of newbuild orders that will reshape the competitive landscape of the Autonomous Ships Market [9].

By Component

Segment Key Metric Primary Demand Driver
Hardware 68.90% share (2025) Sensor suites, navigation processors, actuators
Software CAGR of 14.75% (2026–2035) Digital twins, cybersecurity analytics, voyage optimization


Hardware — including LiDAR arrays, high-definition maritime cameras, radar modules, and redundant navigation processors — currently generates the majority of revenue in the Autonomous Ships Market. Each autonomy-ready newbuild requires sensor packages valued between USD 1.2 million and USD 3.8 million, depending on vessel class and autonomy degree [3].

Software revenues are accelerating as fleet operators monetize the data layer atop installed sensor hardware. Voyage-optimization suites, cybersecurity-monitoring platforms, and predictive-maintenance algorithms command annual licensing fees that compound over vessel lifetimes, creating a high-margin recurring revenue stream.

By Ship Type

Segment Key Metric Primary Demand Driver
Cargo 40.45% share (2025) Deep-sea freight optimization; fuel-cost savings
Passenger USD 0.51 Billion (2025) Autonomous ferries on fixed short-sea routes
Defense CAGR of 16.15% (2026–2035) USV procurement by major navies


Cargo vessels anchor the Autonomous Ships Market because long-haul ocean freight offers the highest return on autonomy investment — predictable routes, limited traffic density, and significant crew-rotation cost savings. Defense applications are growing fastest, fueled by multi-billion-dollar USV acquisition programs in the United States, Australia, and South Korea [10].

By End User

Segment Key Metric Primary Demand Driver
Commercial 72.00% share (2025) Fleet-wide efficiency mandates; decarbonization compliance
Government & Military CAGR of 15.40% (2026–2035) Naval force-structure modernization


Commercial operators — spanning container lines, tanker companies, and bulk-carrier owners — drive the volume story in the Autonomous Ships Market. Government and military end users, while smaller in absolute terms, command premium unit values and longer procurement cycles.

By Propulsion

Segment Key Metric Primary Demand Driver
Conventional 73.60% share (2025) Incumbent fleet dominance; retrofit focus
Hybrid USD 1.15 Billion (2025) Transition pathway; port-emission zones
Fully Electric CAGR of 17.60% (2026–2035) Short-sea zero-emission mandates


Conventional diesel and LNG propulsion still powers the vast majority of autonomy-ready vessels. However, hybrid and fully electric drivetrains are gaining share as port-emission regulations tighten across Europe and Asia-Pacific [11].


Regional Market Share Analysis

Region Key Metric Primary Investment Themes
Asia-Pacific 44.25% share (2025) Smart-shipyard programs; naval modernization
North America 24.10% share (2025) Defense USV procurement; Great Lakes autonomy pilots
Europe 19.85% share (2025) Green Shipping Corridors; MASS Code early adoption
Middle East & Africa 6.50% share (2025) Port megaprojects; sovereign-fund maritime tech
South America 5.30% share (2025) Coastal surveillance; offshore-energy support
Total 100%

The Autonomous Ships Market exhibits distinct regional dynamics shaped by shipbuilding concentration, defense budgets, and regulatory maturity. Asia-Pacific leads on volume, Europe on regulatory innovation, and the Middle East & Africa on growth velocity.


North America

Country Key Metric Key Driver
US 78.50% of regional share Navy USV budget; USCG regulatory sandbox [10]
Canada 13.25% of regional share Arctic surveillance; ice-capable autonomous vessels
Mexico CAGR of 11.80% (2026–2035) Offshore oil-field support vessel demand


The U.S. Department of Defense remains the single largest demand driver in North America, with the Unmanned Task Force's medium USV program moving into low-rate initial production by 2027 [10]. Canada's Ocean Supercluster has funded CAD 320 million in autonomous maritime projects since 2021, including ice-navigation algorithms tailored to Arctic shipping lanes.

Europe

Country Key Metric Key Driver
Germany 21.40% of regional share Autonomous inland-waterway freight [5]
UK CAGR of 11.50% (2026–2035) Maritime Autonomy Regulation Lab; Royal Navy programs
France 14.60% of regional share Naval Group autonomous combatant programs
Italy USD 0.28 Billion (2025) Short-sea Mediterranean corridors
Spain CAGR of 10.90% (2026–2035) Offshore wind support vessel automation
Nordic Countries 26.30% of regional share Norway and Finland as regulatory pioneers
Russia CAGR of 8.70% (2026–2035) Northern Sea Route autonomous ice-class vessels
Rest of Europe USD 0.11 Billion (2025) Emerging port-technology investments


Norway's Maritime Authority has approved more autonomous-vessel test zones than any other flag state globally, and the European Commission's Horizon Europe program allocated EUR 145 million to maritime-autonomy R&D across its 2024–2027 work program [5]. These investments position Europe as the regulatory laboratory for the Autonomous Ships Market.

Asia-Pacific

Country Key Metric Key Driver
China 38.70% of regional share State-backed smart-ship construction plan [4]
Japan CAGR of 11.20% (2026–2035) MEGURI 2040 program; Nippon Foundation funding [9]
South Korea 25.10% of regional share HD Hyundai / Samsung Heavy smart-ship yards
India CAGR of 13.40% (2026–2035) Sagarmala port modernization; Indian Navy autonomous patrol
ASEAN USD 0.22 Billion (2025) Maritime domain awareness investments
Rest of Asia-Pacific CAGR of 10.60% (2026–2035) Australia's SEA 1905 program


China's Ministry of Industry and Information Technology designated autonomous shipping a "strategic emerging industry" in its 14th Five-Year Plan, channeling over CNY 12 billion into smart-ship R&D grants and test-bed infrastructure [4]. Japan's Nippon Foundation completed a series of fully autonomous coastal-vessel demonstrations in 2025 under the MEGURI 2040 program, setting a template that other Asia-Pacific governments are replicating across the Autonomous Ships Market.

South America

Country Key Metric Key Driver
Brazil 62.30% of regional share Pre-salt offshore support vessel automation
Argentina CAGR of 9.80% (2026–2035) Inland waterway freight modernization
Rest of South America USD 0.07 Billion (2025) Coastal patrol and fisheries monitoring


Brazil's Petrobras has trialed autonomous crew-transfer and supply vessels for pre-salt offshore platforms, reducing personnel rotation costs and transit risk in deepwater operations off the Santos Basin. Limited regulatory frameworks in the broader region constrain wider adoption.

Middle East & Africa

Country Key Metric Key Driver
Saudi Arabia 28.90% of regional share NEOM autonomous port infrastructure
UAE CAGR of 15.50% (2026–2035) AD Ports Group; autonomous tug operations
South Africa 18.60% of regional share Port of Durban automation program
Egypt CAGR of 13.90% (2026–2035) Suez Canal digital monitoring upgrades
Rest of MEA USD 0.05 Billion (2025) Maritime security and surveillance


The UAE's AD Ports Group inaugurated autonomous tug trials at Khalifa Port in 2024, targeting full commercial deployment by 2027. Saudi Arabia's NEOM project integrates autonomous vessel handling into its Oxagon industrial port design, creating purpose-built demand for ship-side autonomy within the Autonomous Ships Market.


Autonomous Ships Market By Region, 2025-2035

Competitive Benchmarking

The Autonomous Ships Market exhibits moderate concentration, with an estimated top-five share of 38–44% and a Herfindahl-Hirschman Index below 1,000. Incumbents in naval architecture and marine electronics hold structural advantages through installed-base relationships, classification-society partnerships, and decades of sensor-integration expertise. Start-ups compete by offering modular retrofit kits and subscription-based software platforms that lower adoption barriers for mid-tier fleet operators.

Company Est. Revenue Share Range Key Offerings for the Autonomous Ships Market Strategic Positioning
Kongsberg Maritime ~8–11% Autonomous-ship controller; K-Sim navigation Full-stack autonomy integrator; Yara Birkeland partner
Rolls-Royce (Marine) ~6–9% Intelligent Awareness System; remote-bridge solutions Pioneer in ship-intelligence R&D; European focus
Wärtsilä ~5–8% SmartMarine ecosystem; voyage optimization Engine-to-bridge integration; hybrid propulsion
ABB Marine & Ports ~5–7% ABB Ability Marine Pilot; shore-control centers Electrification + autonomy convergence
HD Hyundai (Avikus) ~4–7% HiNAS 2.0 autonomous navigation AI First trans-oceanic autonomous crossing (2022)
Mitsui O.S.K. Lines ~3–5% Fleet-wide AI voyage-optimization deployment Commercial operator driving demand-side adoption
L3Harris Technologies ~3–5% ASView autonomous-control system Defense-focused USV integration
Honeywell Marine ~2–4% Connected-ship platform; cybersecurity suite Cross-sector sensor and avionics expertise
NYK Line ~2–4% MTI (Monohakobi Technology Institute) R&D Japanese operator advancing crewless vessel trials
Sea Machines Robotics ~1–3% SM300 autonomous-command system; retrofit kits Start-up pioneer in modular autonomy retrofits


Recent News & Developments

  • MARTAC & Intrepid Powerboats- (June 17, 2026 ) -Formed a manufacturing partnership to scale production of Devil Ray autonomous unmanned surface vessels globally.
  • Saronic & Lloyd's Register- (May 18, 2026 ) -Established a strategic partnership to develop regulatory frameworks, safety rules, and classification pathways for autonomous surface vessels.
  • Blue Water Autonomy- (June 2026 ) -Partnered with Tulip and Caterpillar Defense to scale software-defined manufacturing of its Liberty Class autonomous military vessels.


Autonomous Ships Market Report Scope

Parameter Details
Market Scope Global Autonomous Ships Market spanning autonomy systems, components, ship types, end users, and propulsion
Study Period 2021–2035
CAGR (2026–2035) 10.30%
Base Year Market Size USD 7.35 Billion (2025)
Forecast Endpoint USD 19.62 Billion (2035)
Fastest Growing Segments Fully Autonomous (by autonomy level); Fully Electric (by propulsion); Defense (by ship type)
Companies Profiled 10 (Kongsberg Maritime, Rolls-Royce Marine, Wärtsilä, ABB, HD Hyundai Avikus, MOL, L3Harris, Honeywell, NYK Line, Sea Machines)
Valuation Currency USD Billion


FAQs

How do classification-society type-approval timelines affect procurement planning for autonomous vessel systems?
Classification societies currently require 18–30 months for type-approval of autonomy-degree-three systems, depending on flag-state alignment with the IMO MASS Code [7]. Procurement teams should sequence sensor-hardware orders 12 months ahead of anticipated approval dates to avoid delivery-slot bottlenecks at key marine-electronics OEMs. Engaging the chosen class society during preliminary design — rather than post-construction — can shorten the cycle by four to six months.
What cybersecurity architecture do insurers expect before underwriting autonomous vessel risk?
Leading P&I clubs now require compliance with IACS Unified Requirements E26 and E27, covering network segmentation, intrusion-detection systems, and periodic penetration testing [15]. Vessels that demonstrate a defense-in-depth architecture across OT and IT networks typically secure 10–15% premium reductions. Integrating a Security Operations Center (SOC) feed into the shore-control link further strengthens underwriting outcomes.
Which retrofit autonomy kits offer the fastest payback for mid-size bulk carriers?
Modular retrofit kits from Sea Machines and Kongsberg targeting degree-two autonomy typically achieve payback within 24–30 months on Handymax and Supramax bulkers [22]. The primary savings come from optimized fuel consumption (8–12% per voyage) and reduced pilot-boarding fees on repetitive coastal routes. Kit costs range from USD 1.8 million to USD 3.2 million, depending on sensor-suite complexity.
How does the Autonomous Ships Market intersect with shore-power and cold-ironing regulations?
Autonomous voyage-planning systems increasingly integrate port-arrival optimization that aligns berthing schedules with shore-power availability windows, reducing auxiliary-engine emissions during port stays [11]. Ports mandating cold-ironing — including those under the EU's FuelEU Maritime regulation — create a complementary demand signal for predictive arrival-management software. This intersection opens a recurring software-licensing revenue stream tied to port-compliance requirements.
What are the key differences between autonomy-degree-two and degree-three operations from a crewing-cost perspective?
Degree-two operations retain a full bridge crew but delegate routine navigation to the autonomous system, yielding 10–15% crew-cost savings through watch-hour reductions [14]. Degree-three operations shift primary control to a shore-based operator with a minimal onboard safety crew, potentially reducing crewing costs by 35–45%. The gap between the two levels hinges on flag-state manning regulations, which vary considerably across jurisdictions.
Can autonomous navigation systems operate reliably in congested port-approach zones and traffic separation schemes?
Current autonomy systems handle open-ocean navigation with high reliability but face challenges in dense traffic environments where COLREG interpretation requires nuanced judgment [7]. Sensor-fusion architectures combining AIS, radar, LiDAR, and thermal imaging improve detection accuracy in port approaches, yet most classification societies still require human override authority within 12 nautical miles of port. Ongoing demonstration projects in Singapore and Rotterdam are building the performance data needed to relax these restrictions.
What role do digital twins play in reducing autonomous vessel maintenance costs?
Digital-twin platforms continuously compare real-time sensor data against design-baseline models to flag anomalies in hull stress, propulsion efficiency, and machinery vibration before failures occur [3]. Fleet operators using digital-twin-driven predictive maintenance report 20–25% reductions in unplanned dry-docking events. The data also feeds classification-society condition-based surveys, extending survey intervals and lowering through-life compliance costs for operators in the Autonomous Ships Market.    
Author
Author
Author Profile
Abbas Raut LinkedIn
Research Analyst
Abbas Raut is a Senior Research Analyst with 5+ years of experience delivering data-driven insights and strategic recommendations across the Automotive and Aerospace & Defense sectors. He specializes in emerging technologies, industry value chains, and global market dynamics shaping the future of mobility and defense. In automotive, Abbas has led studies on EVs, charging stations, BMS, superchargers, and more, guiding stakeholders through electrification and regulatory shifts. In Aerospace & Defense, he has analyzed markets for military electronics, drones, radars, and electronic warfare solutions, supporting procurement and investment strategies. With expertise in market sizing, forecasting, benchmarking, and technology adoption, Abbas is known for transforming complex datasets into actionable insights that drive strategy, innovation, and growth.
Co-Author
Co-Author Profile
Sejal Akre LinkedIn
Senior Research Analyst
She has over 5 years of rich experience, in market research and consulting providing valuable market insights to client. Hands on expertise in management consulting, and extensive knowledge in domain including ICT, Automotive & Transportation and Aerospace & Defense. She is skilled in Go-to market strategy, industry analysis, market sizing, in depth company profiling, competitive intelligence & benchmarking and value chain amongst others.

Research Approach


Secondary Research

The secondary research process involved comprehensive analysis of maritime regulatory databases, classification society standards, peer-reviewed naval engineering journals, and authoritative maritime industry publications. Key sources included the International Maritime Organization (IMO) Maritime Safety Committee regulations, United States Coast Guard (USCG) Maritime Administration (MARAD) autonomous vessel guidelines, European Maritime Safety Agency (EMSA) digitalization and autonomy directives, Lloyd's Register (LR) ShipRight Autonomous Ship guidance, DNV Classification Society rules for autonomous shipping, American Bureau of Shipping (ABS) Guide for Autonomous and Remote-Control Functions, Bureau Veritas (BV) NR467 rules for automated ships, International Association of Marine Insurers (IUMI) autonomous vessel reports, Baltic and International Maritime Council (BIMCO) autonomous ships insight, International Chamber of Shipping (ICS) position papers, European Commission Maritime Transport policy database, International Transport Forum (ITF) shipping outlook reports, Organisation for Economic Co-operation and Development (OECD) International Transport Forum maritime data, United Nations Conference on Trade and Development (UNCTAD) Review of Maritime Transport, national maritime administration reports from key markets (Norwegian Maritime Authority, Maritime and Coastguard Agency UK, Japan Maritime Bureau), and proprietary shipping fleet databases (Clarksons World Fleet Register, VesselsValue). These sources were used to collect fleet automation statistics, regulatory approval frameworks, technology readiness levels, port infrastructure development, safety incident data, and competitive landscape analysis for fully autonomous navigation, semi-autonomous systems, remote-control operations, and sensor fusion technologies.


Primary Research

During the primary research, both supply-side and demand-side stakeholders in the maritime autonomy ecosystem were interviewed to gather qualitative and quantitative data. People on the supply side included CEOs, CTOs of Maritime Innovation, VPs of Autonomous Systems, heads of Marine Digitalization, fleet directors from companies that make autonomous ships (Kongsberg Gruppen, Wärtsilä, ABB Marine, Rolls-Royce Marine), marine automation technology providers (Sea Machines Robotics, Orca AI, Bedrock Ocean Exploration), sensor and LiDAR manufacturers (Teledyne Technologies, Velodyne Lidar), and technical directors from classification societies. Demand-side sources included fleet operators and technical superintendents from commercial shipping companies (container lines, tanker operators, dry bulk carriers), port authority automation directors, defence procurement officers from naval maritime commands, offshore vessel operators, and marine research institution fleet managers. Primary research confirmed market segmentation across vessel types, confirmed autonomy development roadmaps and MASS (Maritime Autonomous Surface Ships) regulatory milestones, and gathered information on fleet retrofit adoption rates, how prices change for autonomous navigation systems, and marine insurance liability frameworks for unmanned vessels.

Primary Respondent Breakdown:

By Designation: C-level Primaries (32%), Director Level (31%), Others (37%)

By Region: North America (32%), Europe (30%), Asia-Pacific (28%), Rest of World (10%)


Market Size Estimation

Global market valuation was derived through revenue mapping and fleet automation investment analysis. The methodology included:

Identification of 50+ key manufacturers and technology providers across autonomous navigation systems, remote-control platforms, and sensor integration technologies spanning North America, Europe, Asia-Pacific, and Scandinavia

Product mapping across fully autonomous (MASS degrees three and four), semi-autonomous (decision support and remote monitoring), and remote-controlled vessel categories

Analysis of reported and modeled annual revenues specific to autonomous ship portfolios, marine automation software, and sensor hardware suites

Coverage of original equipment manufacturers (OEMs) and autonomy-enabling technology providers representing 75-80% of global market share in 2024

Extrapolation using bottom-up (fleet size × autonomy retrofit/upgrade spend by country and vessel segment) and top-down (manufacturer revenue validation and marine automation investment tracking) approaches to derive segment-specific valuations across cargo vessels, tankers, passenger ships, and specialised autonomous craft

Download Free Sample

Kindly complete the form below to receive a free sample of this Report

Download PDF ×

We do not share your information with anyone. However, we may send you emails based on your report interest from time to time. You may contact us at any time to opt-out.
















