• Cat-intel
  • MedIntelliX
  • Resources
  • About Us
  • Hero Background
    English
    Chinese
    French
    Japanese
    Korean
    German
    Spanish

    Bilirubin Blood Test Market Share

    ID: MRFR/LS/0249-CR
    148 Pages
    Kinjoll Dey
    August 2019

    Bilirubin Blood Test Market Research Report Information by Test Type (Total Serum Bilirubin), Product Type (Consumables and Instruments), Applications (Pediatric/Infants and Adults), End User (Hospitals, Pediatric Clinics) and Region (North America, Europe, Asia Pacific and Rest of the World (RoW)) - Forecast till 2035

    Share:
    Download PDF ×

    We do not share your information with anyone. However, we may send you emails based on your report interest from time to time. You may contact us at any time to opt-out.

    Bilirubin Blood Test Market Infographic
    $ 4,950.0
    $ 5,950.0
    $ 7,250.0

    Market Share

    Bilirubin Blood Test Market Share Analysis

    The healthcare industry is experiencing substantial growth in the realm of device development, marked by significant technological advancements focusing on portability and energy efficiency. The emergence of portable or handheld diagnostic devices is revolutionizing patient care, empowering specialists to conduct diagnoses anywhere and at any time. These portable devices offer a myriad of features, providing technicians with unprecedented flexibility and efficiency. One of the key advantages of portable diagnostics devices is their ability to eliminate the traditional constraints associated with time-consuming sample draws, laboratory scheduling, and processing costs. These devices are designed to be rechargeable, offering the convenience of mobility and ensuring that measurements can be taken and displayed digitally. The integration of digital technology in these devices is expected to enhance the accuracy of measurements, providing more reliable results for healthcare professionals. Manufacturers in the healthcare sector are directing their efforts toward the development of products that predominantly employ non-invasive methods. This strategic focus aims to alleviate the stress and discomfort experienced by patients during diagnostic procedures. A noteworthy example is Koninklijke Philips N.V., a leading player in the healthcare device industry. The company has introduced its innovative bilichek system, a handheld, non-invasive bilirubin measurement device. Renowned for its ease of use and accurate digital measurements, this device exemplifies the industry's commitment to enhancing patient experience through cutting-edge technology. The demand for portable and handheld diagnostic devices is on the rise, driven by the exceptional features and benefits they offer. These devices not only empower healthcare professionals with the flexibility to conduct on-the-spot diagnostics but also contribute to overall cost reduction by streamlining traditional diagnostic processes. The portability of these devices plays a pivotal role in facilitating healthcare services in diverse settings, from traditional medical facilities to remote or underserved areas. The ability to perform diagnostics outside of a standard clinical environment enhances accessibility to healthcare, particularly in regions with limited infrastructure. The digital screens integrated into these devices not only provide real-time measurement results but also contribute to the ease of interpretation and documentation. The transition from traditional analog methods to digital technology represents a significant leap forward in healthcare diagnostics, promising more accurate and efficient patient care. As the healthcare industry continues to embrace the era of portable and handheld diagnostic devices, it is expected that manufacturers will focus on refining and expanding the capabilities of these technologies. The ongoing advancements in device miniaturization, energy efficiency, and data connectivity are poised to further transform the landscape of healthcare diagnostics. The increasing demand for portable and handheld diagnostic devices underscores a paradigm shift in healthcare delivery. These devices are not merely instruments of diagnosis; they represent a commitment to patient-centric care, leveraging technology to enhance accessibility, accuracy, and overall efficiency in the healthcare ecosystem. As manufacturers continue to innovate in this space, the future holds the promise of even more advanced and accessible healthcare solutions for diverse populations worldwide.

    Market Summary

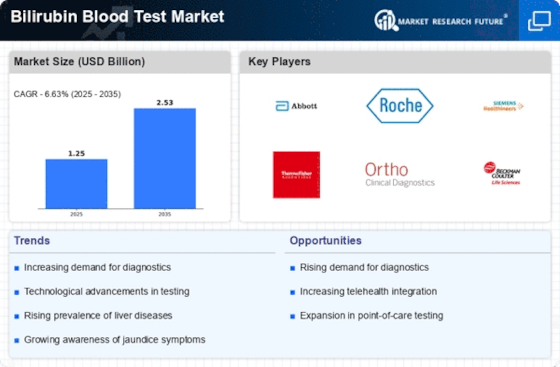
    As per Market Research Future Analysis, the Bilirubin Blood Test Market was valued at USD 1.17 Billion in 2023 and is projected to grow to USD 2.25 Billion by 2032, with a CAGR of 6.63% from 2024 to 2032. The market is driven by increasing cases of jaundice and gallbladder issues, particularly in infants. The demand for portable testing kits is rising due to technological advancements and growing awareness of health. However, competition from alternative testing methods poses a challenge. Key players are focusing on developing less invasive testing techniques to cater to the pediatric population.

    Key Market Trends & Highlights

    The Bilirubin Blood Test Market is witnessing significant growth driven by technological advancements and increasing health awareness.

    • Market Size in 2023: USD 1.17 Billion
    • Projected Market Size by 2032: USD 2.25 Billion
    • CAGR from 2024 to 2032: 6.63%
    • Largest Regional Market Share in 2014: North America at 39.10%

    Market Size & Forecast

    2023 Market Size USD 1.17 Billion
    2024 Projected Market Size USD 1.26 Billion
    2032 Projected Market Size USD 2.25 Billion
    CAGR (2024-2032) 6.63%

    Major Players

    Key players include Koninklijke Philips N.V., Beckman Coulter, Inc., Thermo Fisher Scientific Inc., Randox Laboratories Ltd., Hoffmann-La Roche AG, and Drägerwerk AG & Co. KGaA.

    Market Trends

    The increasing prevalence of liver diseases and the rising awareness regarding early diagnosis are driving the demand for bilirubin blood tests, which are essential for assessing liver function and overall health.

    Centers for Disease Control and Prevention (CDC)

    Bilirubin Blood Test Market Market Drivers

    Market Growth Projections

    The Global Bilirubin Blood Test Market Industry is projected to experience substantial growth over the next decade. With a market value of 1.26 USD Billion in 2024, it is expected to reach 2.73 USD Billion by 2035. This growth trajectory reflects a compound annual growth rate (CAGR) of 7.27% from 2025 to 2035. Factors contributing to this expansion include rising incidences of liver disorders, technological advancements in diagnostic tools, and increasing awareness of preventive healthcare. The market's evolution is likely to be influenced by demographic shifts, regulatory support, and ongoing innovations in testing methodologies.

    Rising Geriatric Population

    The global increase in the geriatric population significantly impacts the Global Bilirubin Blood Test Market Industry. Older adults are more susceptible to liver diseases and related complications, necessitating regular monitoring of bilirubin levels. As the population aged 65 and above continues to grow, healthcare systems are adapting to meet the needs of this demographic. This trend is particularly pronounced in developed countries, where the aging population is projected to double by 2050. The demand for bilirubin testing is likely to rise in tandem, contributing to the overall growth of the market as healthcare providers prioritize the management of liver health in older patients.

    Rising Incidence of Liver Disorders

    The increasing prevalence of liver disorders, such as hepatitis and cirrhosis, drives the demand for the Global Bilirubin Blood Test Market Industry. According to health statistics, liver diseases affect millions globally, necessitating regular monitoring of bilirubin levels. This trend is particularly evident in regions with high rates of viral hepatitis, where early detection through bilirubin tests can significantly improve patient outcomes. As awareness of liver health grows, healthcare providers are likely to recommend bilirubin testing more frequently, contributing to the market's expansion. The market is projected to reach 1.26 USD Billion in 2024, reflecting this rising demand.

    Regulatory Support for Diagnostic Testing

    Regulatory bodies worldwide are increasingly supporting the development and implementation of diagnostic testing, including bilirubin blood tests, which positively influences the Global Bilirubin Blood Test Market Industry. Initiatives aimed at improving healthcare quality and access to diagnostic services encourage the adoption of bilirubin testing in clinical settings. Governments are investing in healthcare infrastructure and promoting guidelines that recommend routine testing for liver function. This regulatory support not only enhances the credibility of bilirubin tests but also fosters innovation in testing methodologies. As a result, the market is poised for growth, driven by favorable policies and increased funding for diagnostic services.

    Growing Awareness of Preventive Healthcare

    The increasing emphasis on preventive healthcare is a key driver for the Global Bilirubin Blood Test Market Industry. As individuals become more health-conscious, there is a rising demand for routine health screenings, including bilirubin tests. Public health campaigns and educational initiatives promote the importance of early detection of liver-related issues, encouraging individuals to undergo regular testing. This shift towards preventive measures is likely to result in a higher volume of bilirubin tests conducted annually. Consequently, the market is anticipated to expand, with projections indicating a growth to 2.73 USD Billion by 2035, reflecting the changing attitudes towards health management.

    Technological Advancements in Diagnostic Tools

    Technological innovations in diagnostic tools enhance the accuracy and efficiency of bilirubin blood tests, thereby propelling the Global Bilirubin Blood Test Market Industry. Advances in laboratory equipment, such as automated analyzers and point-of-care testing devices, facilitate quicker and more reliable results. These innovations not only improve patient care but also streamline laboratory workflows, making bilirubin testing more accessible. As healthcare facilities adopt these advanced technologies, the market is expected to grow significantly. The projected compound annual growth rate (CAGR) of 7.27% from 2025 to 2035 underscores the potential for continued growth driven by these advancements.

    Market Segment Insights

    Regional Insights

    Key Companies in the Bilirubin Blood Test Market market include

    Industry Developments

    Future Outlook

    Bilirubin Blood Test Market Future Outlook

    The Bilirubin Blood Test Market is projected to grow at a 7.27% CAGR from 2024 to 2035, driven by rising liver disease prevalence, technological advancements, and increasing healthcare expenditure.

    New opportunities lie in:

    • Develop portable bilirubin testing devices for home use to enhance patient convenience.
    • Invest in AI-driven analytics for improved diagnostic accuracy and personalized treatment plans.
    • Expand market presence in emerging economies through strategic partnerships with local healthcare providers.

    By 2035, the Bilirubin Blood Test Market is expected to achieve substantial growth, reflecting evolving healthcare needs and technological innovations.

    Market Segmentation

    Competitive Landscape

    • Koninklijke Philips N.V. (Noord-Holland)
    • Beckman Coulter, Inc. (US)
    • Thermo Fisher Scientific Inc. (US)
    • Randox Laboratories Ltd. (UK)
    • Hoffmann-La Roche AG (Switzerland)
    • Drägerwerk AG & Co. KGaA (Germany)
    • Ginevri (Italy)
    • Advanced Instruments (US)
    • Reichert, Inc. (US)
    • Instrumentation Laboratory (US).
    • AVI Healthcare Pvt. Ltd.

    Report Scope

    eport Attribute/Metric Details
    Market Size 2023 1.17 (USD Billion)
    Market Size 2024 1.26 (USD Billion)
    Market Size 2032 2.25 (USD Billion)
    Compound Annual Growth Rate (CAGR) 6.63 % (2024 - 2032)
    Report Coverage Revenue Forecast, Competitive Landscape, Growth Factors, and Trends
    Base Year 2023
    Market Forecast Period 2024 - 2032
    Historical Data 2019 - 2023
      Geographies Covered   North America, Europe, Asia-Pacific, and Rest of the World (RoW)
      Key Vendors   Koninklijke Philips N.V. (Noord-Holland), Beckman Coulter, Inc. (US), Thermo Fisher Scientific Inc. (US), Randox Laboratories Ltd. (UK), Hoffmann-La Roche AG (Switzerland), Drägerwerk AG & Co. KGaA (Germany), Ginevri (Italy), Advanced Instruments (US), Reichert, Inc. (US), Instrumentation Laboratory (US)., AVI Healthcare Pvt. Ltd.
      Key Market Opportunities   Developing Countries Can Become Potential Market For Advanced Bilirubin Blood Test Devices
      Key Market Drivers ·  High Prevalence Of Neonatal Jaundice In Infants ·  Increasing Demand For Portable/Hand-Held Diagnostic Devices

    Market Highlights

    Author

    Kinjoll Dey
    Research Analyst Level I

    She holds an experience of about 6+ years in market research and business consulting, working under the spectrum of information communication technology, telecommunications and semiconductor domains. aarti conceptualizes and implements a scalable business strategy and provides strategic leadership to the clients. her expertise lies in market estimation, competitive intelligence, pipeline analysis, customer assessment, etc.

    Leave a Comment

    Latest Comments

    John Doe
    john@example.com

    This is a great article! Really helped me understand the topic better.

    Posted on July 23, 2025, 10:15 AM
    Jane Smith
    jane@domain.com

    Thanks for sharing this. I’ve bookmarked it for later reference.

    Posted on July 22, 2025, 7:45 PM

    FAQs

    What would be the projected CAGR for the bilirubin blood test market for the forecast period of 2024-2032?

    The projected CAGR for the forecast period would be 6.63%.

    What is the projected market valuation until 2032?

    The bilirubin blood test market valuation would touch USD 2.25 Billion.

    What was the total serum bilirubin market share in 2032?

    The total serum bilirubin market share was 47.37%.

    Discuss the applications involved in the bilirubin blood test market report.

    The applications involve pediatric/infants and adults.

    Mention the end users discussed in the bilirubin blood test market report.

    The report includes hospitals, home healthcare, and pediatric clinics for discussion.

    1. Report Prologue
    2. Market Introduction
      1. Definition 17
      2. Scope Of Study 18
      3. Research Objective 18
      4. Assumptions & Limitations 18
        1. Assumptions 18
        2. Limitations 18
      5. Market Structure 19
      6. Market Segmentation 20
        1. By Test Type 20
        2. By Product Type 21
        3. By Application 22
        4. By End User 23
    3. Research Methodolgy
      1. Primary Research 26
      2. Secondary Research 26
    4. Market Dynamics
      1. Introduction 27
      2. Drivers 28
        1. High Prevalence Of Neonatal Jaundice In Infants 28
        2. Increasing Demand For Portable/Hand-Held Diagnostic Devices 28
      3. Restrains 29
        1. Testing Performed By Non-Laboratory Personnel 29
      4. Opportunity 30
        1. Developing Countries Can Become Potential Market For Advanced Bilirubin Blood Test Devices 30
      5. Challenges 30
        1. Risk Of Errors 30
    5. Bilirubin Blood Test Market, By Test Type
      1. Bilirubin Blood Test Market, By Test Type 31
      2. Total Serum Bilirubin (TSB) 32
      3. Direct/Conjugated Bilirubin Test 34
      4. Indirect/Unconjugated Bilirubin Test 36
    6. Bilirubin Blood Test Market, By Product Type
      1. Bilirubin Blood Test Market, By Product Type 38
      2. Consumables 39
      3. Instruments 41
        1. Analyzers 43
        2. Bilirubinometer 49
    7. Bilirubin Blood Test Market, By Application
      1. Bilirubin Blood Test Market, By Application 55
      2. Pediatric/Infants 56
      3. Adults 58
    8. Bilirubin Blood Test Market, By End User
      1. Bilirubin Blood Test Market, By End User 60
      2. Hospital 61
      3. Pediatric Clinics 63
      4. Home Healthcare 65
    9. Bilirubin Blood Test Market, By Region
      1. Bilirubin Market By Region 67
    10. Bilirubin Blood Test Market, By Test Type
    11. Bilirubin Blood Test Market, By Product Type
    12. Bilirubin Blood Test Market, By Application
    13. Bilirubin Blood Test Market, By End User
      1. North America 67
    14. Bilirubin Blood Test Market, By Test Type
      1. US 71
    15. Bilirubin Blood Test Market, By Test Type
    16. Bilirubin Blood Test Market, By Application
    17. Bilirubin Blood Test Market, By End User
      1. Canada 75
      2. Europe 78
    18. Bilirubin Blood Test Market, By Application
      1. Germany 81
    19. Bilirubin Blood Test Market, By Product Type
    20. Bilirubin Blood Test Market, By Application
      1. UK 84
    21. Bilirubin Blood Test Market, By Product Type
      1. France 87
    22. Bilirubin Blood Test Market, By Test Type
    23. Bilirubin Blood Test Market, By Product Type
    24. Bilirubin Blood Test Market, By End User
      1. Italy 90
    25. Bilirubin Blood Test Market, By Test Type
    26. Bilirubin Blood Test Market, By End User
      1. Spain 93
        1. Rest Of Europe 96
      2. Asia-Pacific 99
    27. Bilirubin Blood Test Market, By Test Type
      1. China 103
        1. India 106
        2. Japan 110
        3. South Korea 113
        4. Rest Of ASIA-PACIFIC 117
      2. Rest Of The World 120
    28. Company Landscape
      1. Introduction 124
    29. Company Profiles
      1. Koninklijke Philips N.V. 128
        1. Company Overview 128
        2. Product/Business Segment Overview 128
        3. Financials 128
        4. Key Developments 129
      2. Beckman Coulter, Inc. (Danaher) 131
        1. Company Overview 131
        2. Product/Business Segment Overview 131
        3. Financials 132
        4. Key Developments 133
      3. Thermo Fisher Scientific Inc. 134
        1. Company Overview 134
        2. Product/Business Segment Overview 134
        3. Financials 135
        4. Key Developments 136
      4. Randox Laboratories Ltd. 137
        1. Company Overview 137
        2. Product/Business Segment Overview 137
        3. Financials 137
        4. Key Developments 137
      5. F. Hoffmann-La Roche AG 138
        1. Company Overview 138
        2. Product/Business Segment Overview 138
        3. Financials 138
        4. Key Developments 140
      6. Drägerwerk AG & Co. KGaA 141
        1. Overview 141
        2. Product Portfolio 141
        3. Financials 141
        4. Key Developments 142
      7. Ginevri 143
        1. Overview 143
        2. Product Portfolio 143
        3. Financials 143
      8. Advanced Instruments 144
        1. Overview 144
        2. Product Portfolio 144
        3. Financials 144
        4. Key Developments 144
      9. Reichert, Inc. 145
        1. Overview 145
        2. Product Portfolio 145
        3. Financials 145
      10. Instrumentation Laboratory 146
        1. Overview 146
        2. Product Portfolio 146
        3. Financials 146
        4. Key Developments 147
    30. List of Tables and Figures
      1. 12 List Of Tables
      2. TABLE 1 GLOBAL BILIRUBIN BLOOD TEST MARKET, BY TEST TYPE, 2022–2030 (USD MILLION) 31
      3. TABLE 2 GLOBAL BILIRUBIN BLOOD TEST MARKET FOR TOTAL SERUM BILIRUBIN (TSB)S, BY REGION, 2022–2030 (USD MILLION) 32
      4. TABLE 3 NORTH AMERICA: BILIRUBIN BLOOD TEST MARKET FOR REAGENTS, BY COUNTRY, 2022–2030 (USD MILLION) 32
      5. TABLE 4 EUROPE: BILIRUBIN BLOOD TEST MARKET FOR TOTAL SERUM BILIRUBIN (TSB)S, BY COUNTRY, 2022–2030 (USD MILLION) 33
      6. TABLE 5 ASIA-PACIFIC : BILIRUBIN BLOOD TEST MARKET FOR TOTAL SERUM BILIRUBIN (TSB)S, BY COUNTRY, 2022–2030 (USD MILLION) 33
      7. TABLE 6 GLOBAL BILIRUBIN BLOOD TEST MARKET FOR DIRECT/CONJUGATED BILIRUBIN TEST, BY REGION, 2022–2030 (USD MILLION) 34
      8. TABLE 7 NORTH AMERICA: BILIRUBIN BLOOD TEST MARKET FOR REAGENTS, BY COUNTRY, 2022–2030 (USD MILLION) 34
      9. TABLE 8 EUROPE: BILIRUBIN BLOOD TEST MARKET FOR DIRECT/CONJUGATED BILIRUBIN TEST, BY COUNTRY, 2022–2030 (USD MILLION) 35
      10. TABLE 9 ASIA-PACIFIC : BILIRUBIN BLOOD TEST MARKET FOR DIRECT/CONJUGATED BILIRUBIN TEST, BY COUNTRY, 2022–2030 (USD MILLION) 35
      11. TABLE 10 GLOBAL BILIRUBIN BLOOD TEST MARKET FOR INDIRECT/UNCONJUGATED BILIRUBIN TEST, BY REGION, 2022–2030 (USD MILLION) 36
      12. TABLE 11 NORTH AMERICA: BILIRUBIN BLOOD TEST MARKET FOR REAGENTS, BY COUNTRY, 2022–2030 (USD MILLION) 36
      13. TABLE 12 EUROPE: BILIRUBIN BLOOD TEST MARKET FOR INDIRECT/UNCONJUGATED BILIRUBIN TEST, BY COUNTRY, 2022–2030 (USD MILLION) 37
      14. TABLE 13 ASIA-PACIFIC : BILIRUBIN BLOOD TEST MARKET FOR INDIRECT/UNCONJUGATED BILIRUBIN TEST, BY COUNTRY, 2022–2030 (USD MILLION) 37
      15. TABLE 14 GLOBAL BILIRUBIN BLOOD TEST MARKET, BY PRODUCT TYPE, 2022–2030 (USD MILLION) 38
      16. TABLE 15 GLOBAL BILIRUBIN BLOOD TEST MARKET FOR CONSUMABLES, BY REGION, 2022–2030 (USD MILLION) 39
      17. TABLE 16 NORTH AMERICA: BILIRUBIN BLOOD TEST MARKET FOR CONSUMABLES, BY COUNTRY, 2022–2030 (USD MILLION) 39
      18. TABLE 17 EUROPE: BILIRUBIN BLOOD TEST MARKET FOR CONSUMABLES, BY COUNTRY, 2022–2030 (USD MILLION) 40
      19. TABLE 18 ASIA-PACIFIC : BILIRUBIN BLOOD TEST MARKET FOR CONSUMABLES, BY COUNTRY, 2022–2030 (USD MILLION) 40
      20. TABLE 19 GLOBAL BILIRUBIN BLOOD TEST MARKET FOR INSTRUMENTS, BY REGION, 2022–2030 (USD MILLION) 41
      21. TABLE 20 NORTH AMERICA: BILIRUBIN BLOOD TEST MARKET FOR REAGENTS, BY COUNTRY, 2022–2030 (USD MILLION) 41
      22. TABLE 21 EUROPE: BILIRUBIN BLOOD TEST MARKET FOR INSTRUMENTS, BY COUNTRY, 2022–2030 (USD MILLION) 42
      23. TABLE 22 ASIA-PACIFIC : BILIRUBIN BLOOD TEST MARKET FOR INSTRUMENTS, BY COUNTRY, 2022–2030 (USD MILLION) 42
      24. TABLE 23 GLOBAL BILIRUBIN BLOOD TEST MARKET FOR ANALYZERS, BY REGION, 2022–2030 (USD MILLION) 43
      25. TABLE 24 NORTH AMERICA: BILIRUBIN BLOOD TEST MARKET FOR REAGENTS, BY COUNTRY, 2022–2030 (USD MILLION) 43
      26. TABLE 25 EUROPE: BILIRUBIN BLOOD TEST MARKET FOR ANALYZERS, BY COUNTRY, 2022–2030 (USD MILLION) 44
      27. TABLE 26 ASIA-PACIFIC : BILIRUBIN BLOOD TEST MARKET FOR ANALYZERS, BY COUNTRY, 2022–2030 (USD MILLION) 44
      28. TABLE 27 GLOBAL BILIRUBIN BLOOD TEST MARKET FOR PHOTOMETRIC ANALYZER, BY REGION, 2022–2030 (USD MILLION) 45
      29. TABLE 28 NORTH AMERICA: BILIRUBIN BLOOD TEST MARKET FOR REAGENTS, BY COUNTRY, 2022–2030 (USD MILLION) 45
      30. TABLE 29 EUROPE: BILIRUBIN BLOOD TEST MARKET FOR PHOTOMETRIC ANALYZER, BY COUNTRY, 2022–2030 (USD MILLION) 46
      31. TABLE 30 ASIA-PACIFIC : BILIRUBIN BLOOD TEST MARKET FOR PHOTOMETRIC ANALYZER, BY COUNTRY, 2022–2030 (USD MILLION) 46
      32. TABLE 31 GLOBAL BILIRUBIN BLOOD TEST MARKET FOR BLOOD GAS ANALYZERS, BY REGION, 2022–2030 (USD MILLION) 47
      33. TABLE 32 NORTH AMERICA: BILIRUBIN BLOOD TEST MARKET FOR REAGENTS, BY COUNTRY, 2022–2030 (USD MILLION) 47
      34. TABLE 33 EUROPE: BILIRUBIN BLOOD TEST MARKET FOR BLOOD GAS ANALYZERS, BY COUNTRY, 2022–2030 (USD MILLION) 48
      35. TABLE 34 ASIA-PACIFIC : BILIRUBIN BLOOD TEST MARKET FOR BLOOD GAS ANALYZERS, BY COUNTRY, 2022–2030 (USD MILLION) 48
      36. TABLE 35 GLOBAL BILIRUBIN BLOOD TEST MARKET FOR BILIRUBINOMETERS, BY REGION, 2022–2030 (USD MILLION) 49
      37. TABLE 36 NORTH AMERICA: BILIRUBIN BLOOD TEST MARKET FOR REAGENTS, BY COUNTRY, 2022–2030 (USD MILLION) 49
      38. TABLE 37 EUROPE: BILIRUBIN BLOOD TEST MARKET FOR BILIRUBINOMETERS, BY COUNTRY, 2022–2030 (USD MILLION) 50
      39. TABLE 38 ASIA-PACIFIC : BILIRUBIN BLOOD TEST MARKET FOR BILIRUBINOMETERS, BY COUNTRY, 2022–2030 (USD MILLION) 50
      40. TABLE 39 GLOBAL BILIRUBIN BLOOD TEST MARKET FOR BENCH-TOP, BY REGION, 2022–2030 (USD MILLION) 51
      41. TABLE 40 NORTH AMERICA: BILIRUBIN BLOOD TEST MARKET FOR REAGENTS, BY COUNTRY, 2022–2030 (USD MILLION) 51
      42. TABLE 41 EUROPE: BILIRUBIN BLOOD TEST MARKET FOR BENCH-TOP, BY COUNTRY, 2022–2030 (USD MILLION) 52
      43. TABLE 42 ASIA-PACIFIC : BILIRUBIN BLOOD TEST MARKET FOR BENCH-TOP, BY COUNTRY, 2022–2030 (USD MILLION) 52
      44. TABLE 43 GLOBAL BILIRUBIN BLOOD TEST MARKET FOR HAND-HELD, BY REGION, 2022–2030 (USD MILLION) 53
      45. TABLE 44 NORTH AMERICA: BILIRUBIN BLOOD TEST MARKET FOR REAGENTS, BY COUNTRY, 2022–2030 (USD MILLION) 53
      46. TABLE 45 EUROPE: BILIRUBIN BLOOD TEST MARKET FOR HAND-HELD, BY COUNTRY, 2022–2030 (USD MILLION) 54
      47. TABLE 46 ASIA-PACIFIC : BILIRUBIN BLOOD TEST MARKET FOR HAND-HELD, BY COUNTRY, 2022–2030 (USD MILLION) 54
      48. TABLE 47 GLOBAL BILIRUBIN BLOOD TEST MARKET, BY APPLICATION, 2022–2030 (USD MILLION) 55
      49. TABLE 48 GLOBAL BILIRUBIN BLOOD TEST MARKET FOR PEDIATRIC/ INFANTS, BY REGION, 2022–2030 (USD MILLION) 56
      50. TABLE 49 NORTH AMERICA: BILIRUBIN BLOOD TEST MARKET FOR REAGENTS, BY COUNTRY, 2022–2030 (USD MILLION) 56
      51. TABLE 50 EUROPE: BILIRUBIN BLOOD TEST MARKET FOR PEDIATRIC/ INFANTS, BY COUNTRY, 2022–2030 (USD MILLION) 57
      52. TABLE 51 ASIA-PACIFIC : BILIRUBIN BLOOD TEST MARKET FOR PEDIATRIC/ INFANTS, BY COUNTRY, 2022–2030 (USD MILLION) 57
      53. TABLE 52 GLOBAL BILIRUBIN BLOOD TEST MARKET FOR ADULTS, BY REGION, 2022–2030 (USD MILLION) 58
      54. TABLE 53 NORTH AMERICA: BILIRUBIN BLOOD TEST MARKET FOR REAGENTS, BY COUNTRY, 2022–2030 (USD MILLION) 58
      55. TABLE 54 EUROPE: BILIRUBIN BLOOD TEST MARKET FOR ADULTS, BY COUNTRY, 2022–2030 (USD MILLION) 59
      56. TABLE 55 ASIA-PACIFIC : BILIRUBIN BLOOD TEST MARKET FOR ADULTS, BY COUNTRY, 2022–2030 (USD MILLION) 59
      57. TABLE 56 GLOBAL BILIRUBIN BLOOD TEST MARKET, BY END USER, 2022–2030 (USD MILLION) 60
      58. TABLE 57 GLOBAL BILIRUBIN BLOOD TEST MARKET FOR HOSPITALS, BY REGION, 2022–2030 (USD MILLION) 61
      59. TABLE 58 NORTH AMERICA: BILIRUBIN BLOOD TEST MARKET FOR REAGENTS, BY COUNTRY, 2022–2030 (USD MILLION) 61
      60. TABLE 59 EUROPE: BILIRUBIN BLOOD TEST MARKET FOR HOSPITALS, BY COUNTRY, 2022–2030 (USD MILLION) 62
      61. TABLE 60 ASIA-PACIFIC : BILIRUBIN BLOOD TEST MARKET FOR HOSPITALS, BY COUNTRY, 2022–2030 (USD MILLION) 62
      62. TABLE 61 GLOBAL BILIRUBIN BLOOD TEST MARKET FOR PEDIATRIC CLINICS, BY REGION, 2022–2030 (USD MILLION) 63
      63. TABLE 62 NORTH AMERICA: BILIRUBIN BLOOD TEST MARKET FOR REAGENTS, BY COUNTRY, 2022–2030 (USD MILLION) 63
      64. TABLE 63 EUROPE: BILIRUBIN BLOOD TEST MARKET FOR PEDIATRIC CLINICS, BY COUNTRY, 2022–2030 (USD MILLION) 64
      65. TABLE 64 ASIA-PACIFIC : BILIRUBIN BLOOD TEST MARKET FOR PEDIATRIC CLINICS, BY COUNTRY, 2022–2030 (USD MILLION) 64
      66. TABLE 65 GLOBAL BILIRUBIN BLOOD TEST MARKET FOR HOME HEALTHCARE, BY REGION, 2022–2030 (USD MILLION) 65
      67. TABLE 66 NORTH AMERICA: BILIRUBIN BLOOD TEST MARKET FOR REAGENTS, BY COUNTRY, 2022–2030 (USD MILLION) 65
      68. TABLE 67 EUROPE: BILIRUBIN BLOOD TEST MARKET FOR HOME HEALTHCARE, BY COUNTRY, 2022–2030 (USD MILLION) 66
      69. TABLE 68 ASIA-PACIFIC : BILIRUBIN BLOOD TEST MARKET FOR HOME HEALTHCARE, BY COUNTRY, 2022–2030 (USD MILLION) 66
      70. TABLE 69 GLOBAL BILIRUBIN BLOOD TEST MARKET, BY REGION, 2022–2030 (USD MILLION) 67
      71. TABLE 70 NORTH AMERICA: BILIRUBIN BLOOD TEST MARKET, BY COUNTRY, 2022–2030 (USD MILLION) 67
      72. TABLE 71 NORTH AMERICA: BILIRUBIN BLOOD TEST MARKET, BY PRODUCT TYPE, 2022–2030 (USD MILLION) 68
      73. TABLE 72 NORTH AMERICA: BILIRUBIN BLOOD TEST MARKET, BY INSTRUMENTS, 2022–2030 (USD MILLION) 68
      74. TABLE 73 NORTH AMERICA: BILIRUBIN BLOOD TEST MARKET, BY ANALYZERS, 2022–2030 (USD MILLION) 69
      75. TABLE 74 NORTH AMERICA: BILIRUBIN BLOOD TEST MARKET, BY BILIRUBINOMETER, 2022–2030 (USD MILLION) 69
      76. TABLE 75 NORTH AMERICA: BILIRUBIN BLOOD TEST MARKET, BY APPLICATION, 2022–2030 (USD MILLION) 70
      77. TABLE 76 NORTH AMERICA: BILIRUBIN BLOOD TEST MARKET, BY END USER, 2022–2030 (USD MILLION) 70
      78. TABLE 77 NORTH AMERICA: BILIRUBIN BLOOD TEST MARKET, BY TEST, 2022–2030 (USD MILLION) 71
      79. TABLE 78 US: BILIRUBIN BLOOD TEST MARKET, BY PRODUCT TYPE, 2022–2030 (USD MILLION) 71
      80. TABLE 79 US: BILIRUBIN BLOOD TEST MARKET, BY INSTRUMENTS, 2022–2030 (USD MILLION) 72
      81. TABLE 80 US: BILIRUBIN BLOOD TEST MARKET, BY ANALYZERS, 2022–2030 (USD MILLION) 72
      82. TABLE 81 US: BILIRUBIN BLOOD TEST MARKET, BY BILIRUBINOMETER, 2022–2030 (USD MILLION) 73
      83. TABLE 82 US: BILIRUBIN BLOOD TEST MARKET, BY APPLICATION, 2022–2030 (USD MILLION) 73
      84. TABLE 83 US: BILIRUBIN BLOOD TEST MARKET, BY END USER, 2022–2030 (USD MILLION) 74
      85. TABLE 84 US: BILIRUBIN BLOOD TEST MARKET, BY TEST, 2022–2030 (USD MILLION) 74
      86. TABLE 85 CANADA: BILIRUBIN BLOOD TEST MARKET, BY PRODUCT TYPE, 2022–2030 (USD MILLION) 75
      87. TABLE 86 CANADA: BILIRUBIN BLOOD TEST MARKET, BY INSTRUMENTS, 2022–2030 (USD MILLION) 75
      88. TABLE 87 CANADA: BILIRUBIN BLOOD TEST MARKET, BY ANALYZERS, 2022–2030 (USD MILLION) 76
      89. TABLE 88 CANADA: BILIRUBIN BLOOD TEST MARKET, BY BILIRUBINOMETER, 2022–2030 (USD MILLION) 76
      90. TABLE 89 CANADA: BILIRUBIN BLOOD TEST MARKET, BY APPLICATION, 2022–2030 (USD MILLION) 76
      91. TABLE 90 CANADA: BILIRUBIN BLOOD TEST MARKET, BY END USER, 2022–2030 (USD MILLION) 77
      92. TABLE 91 CANADA: BILIRUBIN BLOOD TEST MARKET, BY TEST, 2022–2030 (USD MILLION) 77
      93. TABLE 92 EUROPE: BILIRUBIN BLOOD TEST MARKET, BY COUNTRY, 2022–2030 (USD MILLION) 78
      94. TABLE 93 EUROPE: BILIRUBIN BLOOD TEST MARKET, BY PRODUCT TYPE, 2022–2030 (USD MILLION) 78
      95. TABLE 94 EUROPE: BILIRUBIN BLOOD TEST MARKET, BY INSTRUMENTS, 2022–2030 (USD MILLION) 79
      96. TABLE 95 EUROPE: BILIRUBIN BLOOD TEST MARKET, BY ANALYZERS, 2022–2030 (USD MILLION) 79
      97. TABLE 96 EUROPE: BILIRUBIN BLOOD TEST MARKET, BY BILIRUBINOMETER, 2022–2030 (USD MILLION) 79
      98. TABLE 97 EUROPE: BILIRUBIN BLOOD TEST MARKET, BY APPLICATION, 2022–2030 (USD MILLION) 80
      99. TABLE 98 EUROPE: BILIRUBIN BLOOD TEST MARKET, BY END EUROPEER, 2022–2030 (USD MILLION) 80
      100. TABLE 99 EUROPE: BILIRUBIN BLOOD TEST MARKET, BY TEST, 2022–2030 (USD MILLION) 81
      101. TABLE 100 GERMANY: BILIRUBIN BLOOD TEST MARKET, BY PRODUCT TYPE, 2022–2030 (USD MILLION) 81
      102. TABLE 101 GERMANY: BILIRUBIN BLOOD TEST MARKET, BY INSTRUMENTS, 2022–2030 (USD MILLION) 82
      103. TABLE 102 GERMANY: BILIRUBIN BLOOD TEST MARKET, BY ANALYZERS, 2022–2030 (USD MILLION) 82
      104. TABLE 103 GERMANY: BILIRUBIN BLOOD TEST MARKET, BY BILIRUBINOMETER, 2022–2030 (USD MILLION) 82
      105. TABLE 104 GERMANY: BILIRUBIN BLOOD TEST MARKET, BY APPLICATION, 2022–2030 (USD MILLION) 83
      106. TABLE 105 GERMANY: BILIRUBIN BLOOD TEST MARKET, BY END GERMANY, 2022–2030 (USD MILLION) 83
      107. TABLE 106 GERMANY: BILIRUBIN BLOOD TEST MARKET, BY TEST, 2022–2030 (USD MILLION) 84
      108. TABLE 107 UK: BILIRUBIN BLOOD TEST MARKET, BY PRODUCT TYPE, 2022–2030 (USD MILLION) 84
      109. TABLE 108 UK: BILIRUBIN BLOOD TEST MARKET, BY INSTRUMENTS, 2022–2030 (USD MILLION) 85
      110. TABLE 109 UK: BILIRUBIN BLOOD TEST MARKET, BY ANALYZERS, 2022–2030 (USD MILLION) 85
      111. TABLE 110 UK: BILIRUBIN BLOOD TEST MARKET, BY BILIRUBINOMETER, 2022–2030 (USD MILLION) 85
      112. TABLE 111 UK: BILIRUBIN BLOOD TEST MARKET, BY APPLICATION, 2022–2030 (USD MILLION) 86
      113. TABLE 112 UK: BILIRUBIN BLOOD TEST MARKET, BY TEST, 2022–2030 (USD MILLION) 86
      114. TABLE 113 FRANCE: BILIRUBIN BLOOD TEST MARKET, BY PRODUCT TYPE, 2022–2030 (USD MILLION) 87
      115. TABLE 114 FRANCE: BILIRUBIN BLOOD TEST MARKET, BY INSTRUMENTS, 2022–2030 (USD MILLION) 87
      116. TABLE 115 FRANCE: BILIRUBIN BLOOD TEST MARKET, BY ANALYZERS, 2022–2030 (USD MILLION) 88
      117. TABLE 116 FRANCE: BILIRUBIN BLOOD TEST MARKET, BY BILIRUBINOMETER, 2022–2030 (USD MILLION) 88
      118. TABLE 117 FRANCE: BILIRUBIN BLOOD TEST MARKET, BY APPLICATION, 2022–2030 (USD MILLION) 88
      119. TABLE 118 FRANCE: BILIRUBIN BLOOD TEST MARKET, BY END USERS, 2022–2030 (USD MILLION) 89
      120. TABLE 119 FRANCE: BILIRUBIN BLOOD TEST MARKET, BY TEST, 2022–2030 (USD MILLION) 89
      121. TABLE 120 ITALY: BILIRUBIN BLOOD TEST MARKET, BY PRODUCT TYPE, 2022–2030 (USD MILLION) 90
      122. TABLE 121 ITALY: BILIRUBIN BLOOD TEST MARKET, BY INSTRUMENTS, 2022–2030 (USD MILLION) 90
      123. TABLE 122 ITALY: BILIRUBIN BLOOD TEST MARKET, BY ANALYZERS, 2022–2030 (USD MILLION) 91
      124. TABLE 123 ITALY: BILIRUBIN BLOOD TEST MARKET, BY BILIRUBINOMETER, 2022–2030 (USD MILLION) 91
      125. TABLE 124 ITALY: BILIRUBIN BLOOD TEST MARKET, BY APPLICATION, 2022–2030 (USD MILLION) 92
      126. TABLE 125 ITALY: BILIRUBIN BLOOD TEST MARKET, BY END USER, 2022–2030 (USD MILLION) 92
      127. TABLE 126 ITALY: BILIRUBIN BLOOD TEST MARKET, BY TEST, 2022–2030 (USD MILLION) 93
      128. TABLE 127 SPAIN: BILIRUBIN BLOOD TEST MARKET, BY PRODUCT TYPE, 2022–2030 (USD MILLION) 93
      129. TABLE 128 SPAIN: BILIRUBIN BLOOD TEST MARKET, BY INSTRUMENTS, 2022–2030 (USD MILLION) 94
      130. TABLE 129 SPAIN: BILIRUBIN BLOOD TEST MARKET, BY ANALYZERS, 2022–2030 (USD MILLION) 94
      131. TABLE 130 SPAIN: BILIRUBIN BLOOD TEST MARKET, BY BILIRUBINOMETER, 2022–2030 (USD MILLION) 94
      132. TABLE 131 SPAIN: BILIRUBIN BLOOD TEST MARKET, BY APPLICATION, 2022–2030 (USD MILLION) 95
      133. TABLE 132 SPAIN: BILIRUBIN BLOOD TEST MARKET, BY END USERS, 2022–2030 (USD MILLION) 95
      134. TABLE 133 SPAIN: BILIRUBIN BLOOD TEST MARKET, BY TEST, 2022–2030 (USD MILLION) 96
      135. TABLE 134 REST OF EUROPE : BILIRUBIN BLOOD TEST MARKET, BY INSTRUMENTS, 2022–2030 (USD MILLION) 97
      136. TABLE 135 REST OF EUROPE : BILIRUBIN BLOOD TEST MARKET, BY ANALYZERS, 2022–2030 (USD MILLION) 97
      137. TABLE 136 REST OF EUROPE : BILIRUBIN BLOOD TEST MARKET, BY BILIRUBINOMETER, 2022–2030 (USD MILLION) 97
      138. TABLE 137 REST OF EUROPE : BILIRUBIN BLOOD TEST MARKET, BY APPLICATION, 2022–2030 (USD MILLION) 98
      139. TABLE 138 REST OF EUROPE : BILIRUBIN BLOOD TEST MARKET, BY END USER, 2022–2030 (USD MILLION) 98
      140. TABLE 139 REST OF EUROPE : BILIRUBIN BLOOD TEST MARKET, BY TEST, 2022–2030 (USD MILLION) 99
      141. TABLE 140 ASIA-PACIFIC: BILIRUBIN BLOOD TEST MARKET, BY COUNTRY, 2022–2030 (USD MILLION) 99
      142. TABLE 141 ASIA-PACIFIC: BILIRUBIN BLOOD TEST MARKET, BY PRODUCT TYPE, 2022–2030 (USD MILLION) 100
      143. TABLE 142 ASIA-PACIFIC: BILIRUBIN BLOOD TEST MARKET, BY INSTRUMENTS, 2022–2030 (USD MILLION) 100
      144. TABLE 143 ASIA-PACIFIC: BILIRUBIN BLOOD TEST MARKET, BY BILIRUBINOMETER, 2022–2030 (USD MILLION) 101
      145. TABLE 144 ASIA-PACIFIC: BILIRUBIN BLOOD TEST MARKET, BY APPLICATION, 2022–2030 (USD MILLION) 101
      146. TABLE 145 ASIA-PACIFIC: BILIRUBIN BLOOD TEST MARKET, BY END ASIA-PACIFICER, 2022–2030 (USD MILLION) 102
      147. TABLE 146 ASIA-PACIFIC: BILIRUBIN BLOOD TEST MARKET, BY TEST, 2022–2030 (USD MILLION) 102
      148. TABLE 147 CHINA: BILIRUBIN BLOOD TEST MARKET, BY PRODUCT TYPE, 2022–2030 (USD MILLION) 103
      149. TABLE 148 CHINA: BILIRUBIN BLOOD TEST MARKET, BY INSTRUMENTS, 2022–2030 (USD MILLION) 103
      150. TABLE 149 CHINA: BILIRUBIN BLOOD TEST MARKET, BY ANALYZERS, 2022–2030 (USD MILLION) 104
      151. TABLE 150 CHINA: BILIRUBIN BLOOD TEST MARKET, BY BILIRUBINOMETER, 2022–2030 (USD MILLION) 104
      152. TABLE 151 CHINA: BILIRUBIN BLOOD TEST MARKET, BY APPLICATION, 2022–2030 (USD MILLION) 105
      153. TABLE 152 CHINA: BILIRUBIN BLOOD TEST MARKET, BY END CHINAER, 2022–2030 (USD MILLION) 105
      154. TABLE 153 CHINA: BILIRUBIN BLOOD TEST MARKET, BY TEST, 2022–2030 (USD MILLION) 106
      155. TABLE 154 INDIA: BILIRUBIN BLOOD TEST MARKET, BY PRODUCT TYPE, 2022–2030 (USD MILLION) 106
      156. TABLE 155 INDIA: BILIRUBIN BLOOD TEST MARKET, BY INSTRUMENTS, 2022–2030 (USD MILLION) 107
      157. TABLE 156 INDIA: BILIRUBIN BLOOD TEST MARKET, BY ANALYZERS, 2022–2030 (USD MILLION) 107
      158. TABLE 157 INDIA: BILIRUBIN BLOOD TEST MARKET, BY BILIRUBINOMETER, 2022–2030 (USD MILLION) 108
      159. TABLE 158 INDIA: BILIRUBIN BLOOD TEST MARKET, BY APPLICATION, 2022–2030 (USD MILLION) 108
      160. TABLE 159 INDIA: BILIRUBIN BLOOD TEST MARKET, BY END USERS, 2022–2030 (USD MILLION) 109
      161. TABLE 160 INDIA: BILIRUBIN BLOOD TEST MARKET, BY TEST, 2022–2030 (USD MILLION) 109
      162. TABLE 161 JAPAN: BILIRUBIN BLOOD TEST MARKET, BY PRODUCT TYPE, 2022–2030 (USD MILLION) 110
      163. TABLE 162 JAPAN: BILIRUBIN BLOOD TEST MARKET, BY INSTRUMENTS, 2022–2030 (USD MILLION) 110
      164. TABLE 163 JAPAN: BILIRUBIN BLOOD TEST MARKET, BY ANALYZERS, 2022–2030 (USD MILLION) 111
      165. TABLE 164 JAPAN: BILIRUBIN BLOOD TEST MARKET, BY BILIRUBINOMETER, 2022–2030 (USD MILLION) 111
      166. TABLE 165 JAPAN: BILIRUBIN BLOOD TEST MARKET, BY APPLICATION, 2022–2030 (USD MILLION) 112
      167. TABLE 166 JAPAN: BILIRUBIN BLOOD TEST MARKET, BY END USERS, 2022–2030 (USD MILLION) 112
      168. TABLE 167 JAPAN: BILIRUBIN BLOOD TEST MARKET, BY TEST, 2022–2030 (USD MILLION) 113
      169. TABLE 168 SOUTH KOREA: BILIRUBIN BLOOD TEST MARKET, BY PRODUCT TYPE, 2022–2030 (USD MILLION) 113
      170. TABLE 169 SOUTH KOREA: BILIRUBIN BLOOD TEST MARKET, BY INSTRUMENTS, 2022–2030 (USD MILLION) 114
      171. TABLE 170 SOUTH KOREA: BILIRUBIN BLOOD TEST MARKET, BY ANALYZERS, 2022–2030 (USD MILLION) 114
      172. TABLE 171 SOUTH KOREA: BILIRUBIN BLOOD TEST MARKET, BY BILIRUBINOMETER, 2022–2030 (USD MILLION) 115
      173. TABLE 172 SOUTH KOREA: BILIRUBIN BLOOD TEST MARKET, BY APPLICATION, 2022–2030 (USD MILLION) 115
      174. TABLE 173 SOUTH KOREA: BILIRUBIN BLOOD TEST MARKET, BY END SOUTH KOREAER, 2022–2030 (USD MILLION) 116
      175. TABLE 174 SOUTH KOREA: BILIRUBIN BLOOD TEST MARKET, BY TEST, 2022–2030 (USD MILLION) 116
      176. TABLE 175 REST OF ASIA-PACIFIC : BILIRUBIN BLOOD TEST MARKET, BY PRODUCT TYPE, 2022–2030 (USD MILLION) 117
      177. TABLE 176 REST OF ASIA-PACIFIC : BILIRUBIN BLOOD TEST MARKET, BY INSTRUMENTS, 2022–2030 (USD MILLION) 117
      178. TABLE 177 REST OF ASIA-PACIFIC : BILIRUBIN BLOOD TEST MARKET, BY ANALYZERS, 2022–2030 (USD MILLION) 118
      179. TABLE 178 REST OF ASIA-PACIFIC : BILIRUBIN BLOOD TEST MARKET, BY BILIRUBINOMETER, 2022–2030 (USD MILLION) 118
      180. TABLE 179 REST OF ASIA-PACIFIC : BILIRUBIN BLOOD TEST MARKET, BY APPLICATION, 2022–2030 (USD MILLION) 119
      181. TABLE 180 REST OF ASIA-PACIFIC : BILIRUBIN BLOOD TEST MARKET, BY END REST OF ASIA-PACIFIC ER, 2022–2030 (USD MILLION) 119
      182. TABLE 181 REST OF ASIA-PACIFIC : BILIRUBIN BLOOD TEST MARKET, BY TEST, 2022–2030 (USD MILLION) 120
      183. TABLE 182 ROW: BILIRUBIN BLOOD TEST MARKET, BY PRODUCT TYPE, 2022–2030 (USD MILLION) 120
      184. TABLE 183 ROW: BILIRUBIN BLOOD TEST MARKET, BY INSTRUMENTS, 2022–2030 (USD MILLION) 121
      185. TABLE 184 ROW: BILIRUBIN BLOOD TEST MARKET, BY ANALYZERS, 2022–2030 (USD MILLION) 121
      186. TABLE 185 ROW: BILIRUBIN BLOOD TEST MARKET, BY BILIRUBINOMETER, 2022–2030 (USD MILLION) 122
      187. TABLE 186 ROW: BILIRUBIN BLOOD TEST MARKET, BY APPLICATION, 2022–2030 (USD MILLION) 122
      188. TABLE 187 ROW: BILIRUBIN BLOOD TEST MARKET, BY END USER, 2022–2030 (USD MILLION) 123
      189. TABLE 188 ROW: BILIRUBIN BLOOD TEST MARKET, BY TEST, 2022–2030 (USD MILLION) 123
      190. TABLE 189 KEY DEVELOPMENTS OF MAJOR MARKET PLAYERS 125
      191. TABLE 190 KONINKLIJKE PHILIPS N.V.: KEY DEVELOPMENTS 129
      192. TABLE 191 BECKMAN COULTER, INC.: KEY DEVELOPMENTS 133
      193. TABLE 192 THERMO FISHER SCIENTIFIC INC.: KEY DEVELOPMENTS 136
      194. TABLE 193 F. HOFFMANN-LA ROCHE AG.: KEY DEVELOPMENTS 140
      195. TABLE 194 DRÄGERWERK AG & CO. KGAA: KEY DEVELOPMENTS 142
      196. TABLE 195 ADVANCED INSTRUMENTS: KEY DEVELOPMENTS 144
      197. TABLE 196 INSTRUMENTATION LABORATORY: KEY DEVELOPMENTS 147 13 List Of Figures
      198. FIGURE 1 GLOBAL BILIRUBIN BLOOD TEST MARKET SHARE, BY TEST TYPE 2022 (%) 14
      199. FIGURE 2 GLOBAL BILIRUBIN BLOOD TEST MARKET SHARE, BY PRODUCT TYPE, 2022 (%) 15
      200. FIGURE 3 GLOBAL BILIRUBIN BLOOD TEST MARKET SHARE, BY APPLICATIONS, 2022 (%) 15
      201. FIGURE 4 GLOBAL BILIRUBIN MARKET SHARE, BY REGION 2022 (%) 16
      202. FIGURE 5 GLOBAL BILIRUBIN MARKET, BY REGION, 2022-2030 (CAGR%) 16
      203. FIGURE 6 MARKET STRUCTURE OF GLOBAL BILIRUBIN BLOOD TEST MARKET 19
      204. FIGURE 7 RESEARCH PROCESS 25
      205. FIGURE 8 DROC OF GLOBAL BILIRUBIN BLOOD TEST MARKET 27
      206. FIGURE 9 GROWTH DRIVERS: IMPACT ANALYSIS 28
      207. FIGURE 10 RESTRAINTS: IMPACT ANALYSIS 29
      208. FIGURE 11 BILIRUBIN BLOOD TEST MARKET, BY TEST TYPE, 2022–2030 (USD MILLION) 31
      209. FIGURE 12 BILIRUBIN BLOOD TEST MARKET, BY PRODUCT TYPE, 2022–2030 (USD MILLION) 38
      210. FIGURE 13 BILIRUBIN BLOOD TEST MARKET, BY APPLICATION, 2022–2030 (USD MILLION) 55
      211. FIGURE 14 BILIRUBIN BLOOD TEST MARKET, BY END USER, 2022–2030 (USD MILLION) 60
      212. FIGURE 15 MARKET SHARE ANALYSIS BY KEY PLAYERS 2022 (%) 124
      213. FIGURE 16 MARKET COMPETITIVE ANALYSIS BY KEY PLAYERS 2022 (%) 125
      214. FIGURE 17 KONINKLIJKE PHILIPS N.V.: RECENT FINANCIALS 128
      215. FIGURE 18 KONINKLIJKE PHILIPS

    Bilirubin Blood Test Market Segmentation

    Market Segmentation Overview

    • Detailed segmentation data will be available in the full report
    • Comprehensive analysis by multiple parameters
    • Regional and country-level breakdowns
    • Market size forecasts by segment
    Infographic

    Free Sample Request

    Kindly complete the form below to receive a free sample of this Report

    Get Free Sample

    Customer Strories

    “I am very pleased with how market segments have been defined in a relevant way for my purposes (such as "Portable Freezers & refrigerators" and "last-mile"). In general the report is well structured. Thanks very much for your efforts.”

    Victoria Milne

    Founder
    Case Study
    Chemicals and Materials