×
Hero Background
English
Chinese
French
Japanese
Korean
German
Spanish

Bioenergy Market Share

ID: MRFR/EnP/10112-HCR
128 Pages
Shubhendra Anand
October 2025

Bioenergy Market Research Report Information By Type (Solid Biomass, Liquid Biofuel, Biogas, Others), By Feedstock (Agricultural waste, Wood waste, Solid Waste, Others), By Application (Power Generation, Heating, Transportation, Others), and By Region (North America, Europe, Asia Pacific, Middle East & Africa, South America) - Market Forecast Till 2035

Share:
Download PDF ×

We do not share your information with anyone. However, we may send you emails based on your report interest from time to time. You may contact us at any time to opt-out.

Bioenergy Market Infographic
Purchase Options

Market Share

Bioenergy Market Share Analysis

In the competitive landscape of the bioenergy market, companies employ various strategies to position themselves and capture market share. One prevalent approach is differentiation, where companies aim to distinguish their products or services from competitors'. This can be achieved through offering unique features, such as higher energy efficiency, lower emissions, or innovative production processes. By highlighting these distinct attributes, companies can attract environmentally conscious consumers or those seeking enhanced performance. Additionally, companies may focus on cost leadership, striving to offer bioenergy solutions at lower prices than competitors. This strategy aims to appeal to price-sensitive consumers and gain a larger market share through affordability.

Another crucial aspect of market share positioning in the bioenergy sector is market segmentation. Companies identify specific customer segments with distinct needs and preferences and tailor their offerings accordingly. For instance, they may target residential consumers looking for renewable energy options for their homes, or industrial clients seeking large-scale bioenergy solutions to reduce their carbon footprint. By understanding the unique requirements of each segment, companies can effectively allocate resources and develop targeted marketing campaigns to capture a larger share of the market.

Furthermore, strategic partnerships play a vital role in market share positioning within the bioenergy industry. Collaborating with complementary businesses, such as agricultural producers or technology providers, can enable companies to leverage each other's strengths and expand their reach. For example, a bioenergy company might partner with farmers to secure a steady supply of feedstock or collaborate with research institutions to develop cutting-edge technologies. These partnerships not only enhance the company's capabilities but also create opportunities for joint marketing efforts and access to new customer bases.

In addition to differentiation, cost leadership, market segmentation, and strategic partnerships, innovation is another key driver of market share positioning in the bioenergy market. Companies that invest in research and development to improve their products, optimize production processes, or explore alternative feedstock sources can gain a competitive edge. By offering superior or more sustainable solutions, these innovators can attract environmentally conscious consumers and establish themselves as leaders in the industry. Moreover, continuous innovation helps companies stay ahead of competitors and adapt to changing market dynamics, securing their position in the market.

Effective branding and marketing are also essential for successful market share positioning in the bioenergy sector. Companies need to develop strong brand identities that resonate with their target audience and differentiate them from competitors. This includes communicating their values, commitment to sustainability, and the benefits of their bioenergy solutions effectively. Through targeted marketing campaigns across various channels, such as social media, websites, and industry events, companies can raise awareness of their brand and attract potential customers.

Lastly, regulatory compliance and government policies play a significant role in shaping market share positioning within the bioenergy industry. Companies must stay abreast of regulations related to renewable energy, emissions standards, and incentives or subsidies for bioenergy production. By ensuring compliance with these regulations and actively participating in policy advocacy efforts, companies can mitigate risks and capitalize on opportunities in the market. Moreover, government support for renewable energy initiatives can create a favorable market environment for bioenergy companies, driving demand and facilitating market share expansion.

Market share positioning strategies in the bioenergy market encompass a range of approaches, including differentiation, cost leadership, market segmentation, strategic partnerships, innovation, branding, marketing, and regulatory compliance. By employing these strategies effectively, companies can enhance their competitive advantage, attract customers, and capture a larger share of the growing bioenergy market.

Author
Shubhendra Anand
Head Research

Having diverse understanding in both qualitative & quantitative research for Life Science, Chemicals & Materials. His multi-tasking skill always aided to obtain real time information for many critical projects. On the other hand, he has worked with many Fortune 500 companies over the last few years and helped them to take strategic move.

Leave a Comment

FAQs

What is the current valuation of the Bioenergy Market as of 2024?

The Bioenergy Market was valued at 137.38 USD Billion in 2024.

What is the projected market valuation for the Bioenergy Market in 2035?

The Bioenergy Market is projected to reach a valuation of 304.39 USD Billion by 2035.

What is the expected CAGR for the Bioenergy Market during the forecast period 2025 - 2035?

The expected CAGR for the Bioenergy Market during the forecast period 2025 - 2035 is 7.5%.

Which segments are included in the Bioenergy Market, and what are their valuations?

The Bioenergy Market includes segments such as Solid Biomass, Liquid Biofuel, Biogas, and Others, with valuations ranging from 17.38 to 110.0 USD Billion.

What are the primary feedstocks used in the Bioenergy Market?

Key feedstocks in the Bioenergy Market include Agricultural waste, Wood waste, Solid Waste, and Others, with valuations between 25.0 and 90.0 USD Billion.

What applications are driving growth in the Bioenergy Market?

The Bioenergy Market is driven by applications in Power generation, Heat Generation, Transportation, and Others, with valuations from 17.38 to 120.0 USD Billion.

Who are the key players in the Bioenergy Market?

Key players in the Bioenergy Market include Neste, Drax Group, Orsted, Enviva, Renewable Energy Group, BASF, Valmet, and Green Plains.

Market Summary

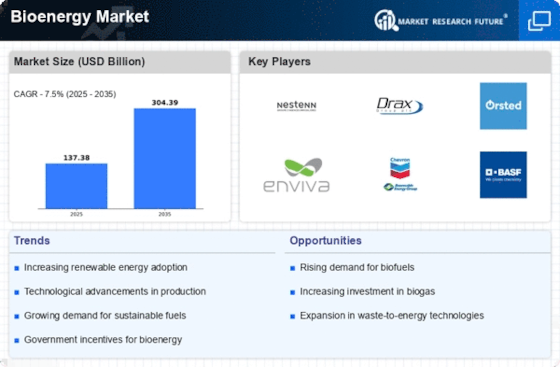
As per MRFR analysis, the Bioenergy Market Size was estimated at 137.38 USD Billion in 2024. The Bioenergy industry is projected to grow from 147.69 USD Billion in 2025 to 304.39 USD Billion by 2035, exhibiting a compound annual growth rate (CAGR) of 7.5 during the forecast period 2025 - 2035.

Key Market Trends & Highlights

The Bioenergy Market is poised for substantial growth driven by technological advancements and increasing demand for sustainable energy solutions.

  • Technological advancements in bioenergy production are enhancing efficiency and reducing costs, particularly in North America. Government policies and incentives are playing a crucial role in promoting bioenergy adoption across various sectors. The growing demand for sustainable energy solutions is particularly evident in the solid biomass segment, which remains the largest market segment. Investment in research and development, along with rising consumer awareness, are key drivers propelling the growth of the liquid biofuel segment in the Asia-Pacific region.

Market Size & Forecast

2024 Market Size 137.38 (USD Billion)
2035 Market Size 304.39 (USD Billion)
CAGR (2025 - 2035) 7.5%
Largest Regional Market Share in 2024 North America

Major Players

<p>Neste (FI), Drax Group (GB), Orsted (DK), Enviva (US), Renewable Energy Group (US), BASF (DE), Valmet (FI), Green Plains (US)</p>

Market Trends

The Bioenergy Market is currently experiencing a transformative phase, driven by a confluence of environmental concerns and technological advancements. As nations strive to reduce greenhouse gas emissions and transition towards sustainable energy sources, bioenergy emerges as a viable alternative. This sector encompasses various forms of energy derived from organic materials, including biomass, biogas, and biofuels. The increasing emphasis on renewable energy sources, coupled with supportive government policies, appears to bolster the growth of this market. Furthermore, innovations in conversion technologies and feedstock utilization may enhance efficiency and reduce costs, making bioenergy more competitive against fossil fuels. In addition to environmental motivations, the Bioenergy Market is influenced by economic factors. The rising demand for energy security and the need for rural development initiatives contribute to the sector's expansion. Bioenergy Market projects often create local jobs and stimulate economic activity in rural areas, which may further encourage investment. As the global community continues to prioritize sustainability, the Bioenergy Market is likely to evolve, presenting new opportunities and challenges for stakeholders. The interplay between technological advancements, policy frameworks, and market dynamics will shape the future landscape of bioenergy, making it a focal point for energy discussions in the coming years.

Technological Advancements in Bioenergy Market Production

Recent innovations in bioenergy production technologies are reshaping the landscape of the market. Enhanced methods for converting biomass into energy, such as advanced fermentation and gasification techniques, are likely to improve efficiency and yield. These advancements may also facilitate the use of diverse feedstocks, including agricultural residues and waste materials, thereby broadening the scope of bioenergy applications.

Government Policies and Incentives

Supportive government policies play a crucial role in the Bioenergy Market's growth trajectory. Many countries are implementing regulations and incentives aimed at promoting renewable energy sources. These initiatives may include tax credits, grants, and subsidies for bioenergy projects, which could stimulate investment and encourage the adoption of bioenergy solutions across various sectors.

Growing Demand for Sustainable Energy Solutions

The increasing The Bioenergy Market forward. As consumers and industries alike seek to reduce their carbon footprints, bioenergy presents an attractive alternative to traditional fossil fuels. This shift in consumer preferences may drive innovation and investment in bioenergy technologies, further solidifying its position in the energy mix.

Bioenergy Market Market Drivers

Investment in Research and Development

Investment in research and development (R&D) is a significant driver of growth in the Bioenergy Market. Increased funding for R&D initiatives is leading to breakthroughs in bioenergy technologies, which enhance production efficiency and reduce costs. For instance, recent advancements in genetic engineering and synthetic biology are paving the way for more efficient biomass conversion processes. Data suggests that R&D investments in bioenergy have increased by approximately 20% over the last three years, reflecting a strong commitment to innovation. This focus on R&D is essential for addressing challenges such as feedstock availability and production scalability. As the Bioenergy Market continues to evolve, sustained investment in R&D will be critical for maintaining competitive advantages and fostering long-term growth.

Integration of Bioenergy into Energy Systems

The integration of bioenergy into existing energy systems is emerging as a vital driver for the Bioenergy Market. As energy systems evolve to accommodate a diverse mix of renewable sources, bioenergy is increasingly recognized for its potential to provide reliable and flexible energy solutions. Recent analyses indicate that bioenergy can contribute to grid stability and energy security, particularly in regions with high renewable penetration. The ability to store bioenergy in the form of biogas or biofuels allows for a more resilient energy supply. This integration not only enhances the overall efficiency of energy systems but also supports the transition towards a more sustainable energy landscape. As the Bioenergy Market continues to adapt to these changes, the role of bioenergy in energy systems is likely to expand significantly.

Government Policies and Regulatory Frameworks

Government policies and regulatory frameworks are crucial drivers in the Bioenergy Market, as they create a conducive environment for investment and development. Many countries have established renewable energy targets and mandates that encourage the use of bioenergy. For example, the implementation of feed-in tariffs and renewable portfolio standards has incentivized the production of biofuels and biogas. Recent statistics indicate that nations with robust policy frameworks have seen a 15% increase in bioenergy production capacity over the past five years. These policies not only support the growth of the Bioenergy Market but also align with broader climate goals, promoting a transition towards a low-carbon economy. As governments continue to prioritize renewable energy, the Bioenergy Market is expected to benefit significantly from these initiatives.

Technological Innovations in Bioenergy Production

The Bioenergy Market is experiencing a surge in technological innovations that enhance the efficiency and sustainability of bioenergy production. Advanced methods such as anaerobic digestion and gasification are being adopted, which convert organic materials into energy more effectively. For instance, the implementation of enzyme technology has been shown to increase the yield of biofuels from biomass. According to recent data, the biofuels segment is projected to grow at a compound annual growth rate of approximately 8% through 2027. This growth is indicative of the industry's shift towards more efficient production techniques, which not only reduce costs but also minimize environmental impact. As these technologies continue to evolve, they are likely to play a pivotal role in shaping the future landscape of the Bioenergy Market.

Rising Consumer Awareness and Demand for Sustainability

There is a notable increase in consumer awareness regarding sustainability, which is driving demand within the Bioenergy Market. As individuals and businesses become more conscious of their carbon footprints, the preference for renewable energy sources, including bioenergy, is growing. Recent surveys indicate that over 70% of consumers are willing to pay a premium for products derived from sustainable energy sources. This shift in consumer behavior is prompting companies to invest in bioenergy solutions, thereby expanding the market. The Bioenergy Market is likely to see a corresponding rise in demand for biofuels, biogas, and other renewable energy products. This trend not only supports environmental goals but also presents lucrative opportunities for businesses engaged in sustainable practices.

Market Segment Insights

By Type: Solid Biomass (Largest) vs. Liquid Biofuel (Fastest-Growing)

<p>The Bioenergy Market is diverse, with Solid Biomass leading in market share, primarily due to its widespread availability and traditional use in energy generation. Solid Biomass accounts for a significant portion of the market, followed closely by Liquid Biofuel, which is rapidly gaining traction. Despite being a smaller segment currently, the growth of Liquid Biofuel is noteworthy as it is increasingly being integrated into existing fuel systems, driving its market presence and share to grow steadily.</p>

<p>Solid Biomass (Dominant) vs. Liquid Biofuel (Emerging)</p>

<p>Solid Biomass remains the dominant player in the Bioenergy Market, leveraging its traditional applications in heating and power generation, along with its availability from various sources like wood, agricultural residues, and waste. On the other hand, Liquid Biofuel is emerging as a pivotal player, driven by technological advancements and favorable governmental policies promoting renewable energy. Liquid Biofuels, such as biodiesel and ethanol, are capturing attention due to their potential to lower greenhouse gas emissions and their compatibility with existing engine technologies, making them a competitive alternative to fossil fuels.</p>

By Feedstock: Agricultural Waste (Largest) vs. Wood Waste (Fastest-Growing)

<p>The feedstock segment in the Bioenergy Market is diversified, with agricultural waste holding the largest share. This segment is dominated by crop residues, such as straw and husks, which provide significant feedstock for bioenergy production. Following closely is wood waste, which is also gaining traction due to its renewable attributes and abundance. Solid waste and other feedstocks contribute to the overall market but remain smaller segments, showcasing varied sources of bioenergy input combining municipal, industrial, and other alternative sources. Growth trends in this segment are driven by rising environmental awareness and the pursuit of sustainable energy solutions. The agricultural waste segment benefits from government incentives for biomass energy production, while wood waste is rapidly growing due to advancements in conversion technologies and increased recycling efforts. Additionally, as industries seek to reduce their carbon footprints, investment in bioenergy utilizing solid waste and other feedstocks is expected to rise, further boosting the segment's development in the future.</p>

<p>Agricultural Waste (Dominant) vs. Wood Waste (Emerging)</p>

<p>Agricultural waste is a dominant player in the bioenergy sector, owing to its abundance and economic viability. This feedstock includes diverse resources such as straw, leaves, and stalks, all of which are readily available from various farming practices. Wood waste, on the other hand, is an emerging feedstock type that includes by-products from timber processing, construction, and urban landscaping activities. The reliance on wood waste is growing as innovative processing technologies improve its viability as a cost-effective energy source. Both segments possess unique characteristics; agricultural waste is often used in direct combustion while wood waste is increasingly processed through anaerobic digestion and gasification methods, positioning both as pivotal to the future bioenergy landscape.</p>

By Application: Power Generation (Largest) vs. Heat Generation (Fastest-Growing)

<p>In the Bioenergy Market, Power Generation emerges as the largest application segment, holding a significant share due to the increasing demand for renewable energy sources. Energy policies and the push for sustainability are key factors driving this segment's growth, as both public and private sectors invest heavily in bioelectricity production. Heat Generation follows closely, gaining momentum from industrial and residential sectors seeking efficient heating solutions through bioenergy sources such as biomass and biogas. Analyzing the growth trends, the Heat Generation segment is identified as the fastest-growing, benefiting from advancements in technology that enhance efficiency and lower carbon footprints. Additionally, the rising awareness among consumers about the environmental benefits of using bioenergy for heating is fuelling this growth. As industries pivot towards cleaner alternatives, both Power and Heat Generation are poised for significant developments that will shape the future landscape of the bioenergy sector.</p>

<p>Power Generation (Dominant) vs. Heat Generation (Emerging)</p>

<p>Power Generation stands as the dominant application in the Bioenergy Market, characterized by its extensive integration of renewable energies in electricity grids. This segment leverages diverse bioenergy sources like biogas, biomass, and biofuels, contributing to a significant reduction in greenhouse gas emissions. Meanwhile, Heat Generation is an emerging segment, capturing attention for its rapid development facilitated by technological advancements that optimize the use of waste materials for heating purposes. The growing shift towards sustainable solutions in residential and industrial heating applications propels Heat Generation into the spotlight. Both segments reflect a comprehensive alignment with global sustainability goals, yet they cater to different energy needs and consumer preferences in the bioenergy landscape.</p>

Get more detailed insights about Bioenergy Market Research Report - Global Forecast to 2035

Regional Insights

North America : Leading Bioenergy Market Innovators

North America is the largest market for bioenergy, holding approximately 40% of the global share, driven by strong government policies and increasing demand for renewable energy. The U.S. and Canada are the primary contributors, with significant investments in biofuel technologies and infrastructure. Regulatory support, such as the Renewable Fuel Standard, has catalyzed growth, promoting cleaner energy alternatives and reducing greenhouse gas emissions. The competitive landscape is dominated by key players like Enviva, Renewable Energy Group, and Drax Group, which are leading the charge in biofuel production and innovation. The U.S. is particularly focused on advanced biofuels, while Canada emphasizes biomass energy. This region's commitment to sustainability and innovation positions it as a global leader in the bioenergy sector.

Europe : Regulatory Framework Driving Growth

Europe is the second-largest bioenergy market, accounting for approximately 30% of the global share. The region's growth is propelled by stringent EU regulations aimed at reducing carbon emissions and promoting renewable energy sources. The European Green Deal and Renewable Energy Directive are pivotal in shaping the market, encouraging investments in bioenergy technologies and infrastructure across member states. Leading countries include Germany, Sweden, and Finland, which are at the forefront of bioenergy production and utilization. Key players such as Orsted and BASF are actively involved in innovative projects that enhance bioenergy efficiency. The competitive landscape is characterized by a mix of large corporations and SMEs, all contributing to a robust bioenergy ecosystem that supports sustainability goals.

Asia-Pacific : Emerging Markets in Bioenergy Market

The Asia-Pacific region is rapidly emerging in the bioenergy market, holding about 20% of the global share. Countries like China and India are leading the charge, driven by increasing energy demands and government initiatives to promote renewable energy. Regulatory frameworks, such as China's Renewable Energy Law, are fostering investments in bioenergy projects, particularly in biomass and biogas sectors, to meet sustainability targets and reduce reliance on fossil fuels. China is the largest market in the region, focusing on bioethanol and biodiesel production, while India is investing in biogas and biomass energy. The competitive landscape features both domestic and international players, with companies like Green Plains and Valmet expanding their operations in the region. The growing emphasis on energy security and environmental sustainability is propelling the bioenergy sector forward.

Middle East and Africa : Resource-Rich Bioenergy Market Potential

The Middle East and Africa region is an emerging player in the bioenergy market, holding approximately 10% of the global share. The growth is primarily driven by the need for energy diversification and sustainable development. Countries like South Africa and Kenya are exploring bioenergy solutions to address energy shortages and promote rural development. Government initiatives and international partnerships are crucial in fostering bioenergy projects in this resource-rich region. South Africa is focusing on biomass and biofuels, while Kenya is investing in biogas and solar-bioenergy hybrids. The competitive landscape is characterized by a mix of local startups and international firms, all aiming to tap into the region's vast potential. The presence of key players and supportive policies is expected to enhance the bioenergy market's growth in the coming years.

Key Players and Competitive Insights

The Bioenergy Market is becoming increasingly competitive due to the presence of several large and small players that are consistently engaging in various strategies to gain a competitive edge. Some of the leading companies in the market include ADM, POET, LLC, Neste, RENEWABLE ENERGY GROUP (REG), ABENGOA BIOENERGY, WILMAR INTERNATIONAL, Raízen, VALERO ENERGY CORPORATION, ENVITEC Biogas AG, GEVO, INC.

These companies are primarily focused on the development of advanced biofuel technology and the introduction of innovative products. The players have been actively engaging in mergers and acquisitions, product launches, and other business strategies to enhance their market presence. These strategies are likely to help the key market players expand their business and further strengthen their existing position in the market.

Archer Daniels Midland Company (ADM): stands out prominently in the global bioenergy domain. Renowned for its prowess in food processing and commodities, ADM has seamlessly ventured into the bioenergy sector. With a robust focus on sustainability, ADM has emerged as a significant biofuel producer, particularly in the ethanol segment sourced from renewable feedstocks like corn and sugarcane. ADM's engagement extends to biodiesel production, research and development, and innovation in biofuel technologies. Its comprehensive approach encompasses not only production but also research initiatives aimed at enhancing bioenergy processes and feedstock utilization.

Furthermore, ADM advocates for supportive policies that foster the growth of the bioenergy market. This multifaceted involvement places ADM in a pivotal role, driving advancements in the bioenergy sector and contributing to a more sustainable energy landscape.

Envitec Biogas AG: is a significant player in the bioenergy market with a strong focus on biogas production. As a leading international supplier of biogas technology, the company specializes in designing, building, and operating biogas plants that utilize organic waste materials to generate renewable energy. Envitec's expertise spans across various sectors, including agriculture, industrial waste, and wastewater treatment, enabling efficient and sustainable energy production while addressing waste management challenges. With a commitment to innovation, Envitec continuously develops advanced biogas solutions and optimizes plant performance.

Its contributions extend beyond technology, as the company plays an essential role in promoting the adoption of biogas as a viable renewable energy source worldwide. Envitec Biogas AG's comprehensive approach positions it as a key player driving the transition to cleaner and more sustainable energy systems.

Key Companies in the Bioenergy Market market include

Industry Developments

July 2021, Liquind 24/7 GmbH and EnviTec Biogas AG agreed to deliver and market bio-LNG produced by EnviTec Biogas AG in Gustrow in heavy duty clients at Liquind 24/7 GmbH’s truck fueling facilities in Europe.

April 2020 - Finnish-Swiss biotech company Ductor is building three combined biofertilizer-biogas facilities in northern Poland. The new facilities will be built in Poland's Zachodniopomorskie region, located off the coast of the Baltic Sea. Two of the new plants would have installed capacity of 0.5MW, and the third will be 1MW. All three plants are expected to be operational in 2021.

February 2020 - The U.S. based Brightmark Energy company announced plans to expand its waste-to-biogas project, partnering with six total farms in the region. The 'Yellowjacket' project would extract methane from 265,000 gallons of dairy manure per day and convert it into renewable natural gas (RNG) and other useful by-products.

July 2024 – Banas Dairy and Suzuki Motor Corporation announced jointly that they plan to invest more than rupees 250 crores towards the construction of four biogas plants in Gujarat. The goal is to convert methane-rich biogas to automotive gasoline. In the Ahmedabad Mirror, Shankar Chaudhary, Banas Dairy Chairman, said the plant converts cattle manure to biogas using fermentation, which will be used as liquid fertilizer in agriculture.

In February 2024, TruAlt Bioenergy Market, one of the largest producers of biofuels, targets operational readiness for plants that would together add 2.7 lakh liters daily to production. The company plans further capital expenditures of approximately Rs 600 crore. This Bengaluru headquartered company is expecting a revenue jump of thirty percent this fiscal year.

In October 2024, Neste Corporation, one of the leaders in biodiesel production, informed that they are expanding their biofuel output in Europe. The renewable fuels production facility in Rotterdam is intended to augment supply to address the growing need for greener transportation solutions while further advancing the company's commitment to maintain the carbon-neutral pledge.

In September 2024, Drax Group finished building a new biomass set-up pellet production plant in the United States. The plant will be capable of producing millions of tons of sustainable biomass pellets each year, fulfilling Drax’s target to reduce carbon footprint by substituting renewable energy for coal in electricity generation.

Future Outlook

Bioenergy Market Future Outlook

<p>The Bioenergy Market is projected to grow at a 7.5% CAGR from 2024 to 2035, driven by increasing energy demands, sustainability initiatives, and technological advancements.</p>

New opportunities lie in:

  • <p>Expansion of biogas production facilities in urban areas.</p>
  • <p>Development of advanced biofuels for aviation and maritime sectors.</p>
  • <p>Investment in biomass supply chain optimization technologies.</p>

<p>By 2035, the Bioenergy Market is expected to be a pivotal component of the global energy landscape.</p>

Market Segmentation

Bioenergy Market Type Outlook

  • Solid Biomass
  • Liquid Biofuel
  • Biogas
  • Others

Bioenergy Market Feedstock Outlook

  • Agricultural waste
  • Wood waste
  • Solid Waste
  • Others

Bioenergy Market Application Outlook

  • Power generation
  • Heat Generation
  • Transportation
  • Others

Report Scope

MARKET SIZE 2024 137.38(USD Billion)
MARKET SIZE 2025 147.69(USD Billion)
MARKET SIZE 2035 304.39(USD Billion)
COMPOUND ANNUAL GROWTH RATE (CAGR) 7.5% (2024 - 2035)
REPORT COVERAGE Revenue Forecast, Competitive Landscape, Growth Factors, and Trends
BASE YEAR 2024
Market Forecast Period 2025 - 2035
Historical Data 2019 - 2024
Market Forecast Units USD Billion
Key Companies Profiled Market analysis in progress
Segments Covered Market segmentation analysis in progress
Key Market Opportunities Advancements in waste-to-energy technologies enhance sustainability in the Bioenergy Market.
Key Market Dynamics Rising demand for renewable energy sources drives innovation and investment in bioenergy technologies and infrastructure.
Countries Covered North America, Europe, APAC, South America, MEA

FAQs

What is the current valuation of the Bioenergy Market as of 2024?

The Bioenergy Market was valued at 137.38 USD Billion in 2024.

What is the projected market valuation for the Bioenergy Market in 2035?

The Bioenergy Market is projected to reach a valuation of 304.39 USD Billion by 2035.

What is the expected CAGR for the Bioenergy Market during the forecast period 2025 - 2035?

The expected CAGR for the Bioenergy Market during the forecast period 2025 - 2035 is 7.5%.

Which segments are included in the Bioenergy Market, and what are their valuations?

The Bioenergy Market includes segments such as Solid Biomass, Liquid Biofuel, Biogas, and Others, with valuations ranging from 17.38 to 110.0 USD Billion.

What are the primary feedstocks used in the Bioenergy Market?

Key feedstocks in the Bioenergy Market include Agricultural waste, Wood waste, Solid Waste, and Others, with valuations between 25.0 and 90.0 USD Billion.

What applications are driving growth in the Bioenergy Market?

The Bioenergy Market is driven by applications in Power generation, Heat Generation, Transportation, and Others, with valuations from 17.38 to 120.0 USD Billion.

Who are the key players in the Bioenergy Market?

Key players in the Bioenergy Market include Neste, Drax Group, Orsted, Enviva, Renewable Energy Group, BASF, Valmet, and Green Plains.

  1. SECTION I: EXECUTIVE SUMMARY AND KEY HIGHLIGHTS
    1. EXECUTIVE SUMMARY
      1. Market Overview
      2. Key Findings
      3. Market Segmentation
      4. Competitive Landscape
      5. Challenges and Opportunities
      6. Future Outlook 2
  2. SECTION II: SCOPING, METHODOLOGY AND MARKET STRUCTURE
    1. MARKET INTRODUCTION
      1. Definition
      2. Scope of the study
    2. RESEARCH METHODOLOGY
      1. Overview
      2. Data Mining
      3. Secondary Research
      4. Primary Research
      5. Forecasting Model
      6. Market Size Estimation
      7. Data Triangulation
      8. Validation 3
  3. SECTION III: QUALITATIVE ANALYSIS
    1. MARKET DYNAMICS
      1. Overview
      2. Drivers
      3. Restraints
      4. Opportunities
    2. MARKET FACTOR ANALYSIS
      1. Value chain Analysis
      2. Porter's Five Forces Analysis
      3. COVID-19 Impact Analysis
  4. SECTION IV: QUANTITATIVE ANALYSIS
    1. Energy & Power, BY Type (USD Billion)
      1. Solid Biomass
      2. Liquid Biofuel
      3. Biogas
      4. Others
    2. Energy & Power, BY Feedstock (USD Billion)
      1. Agricultural waste
      2. Wood waste
      3. Solid Waste
      4. Others
    3. Energy & Power, BY Application (USD Billion)
      1. Power generation
      2. Heat Generation
      3. Transportation
      4. Others
    4. Energy & Power, BY Region (USD Billion)
      1. North America
      2. Europe
      3. APAC
      4. South America
      5. MEA
  5. SECTION V: COMPETITIVE ANALYSIS
    1. Competitive Landscape
      1. Overview
      2. Competitive Analysis
      3. Market share Analysis
      4. Major Growth Strategy in the Energy & Power
      5. Competitive Benchmarking
      6. Leading Players in Terms of Number of Developments in the Energy & Power
      7. Key developments and growth strategies
      8. Major Players Financial Matrix
    2. Company Profiles
      1. Neste (FI)
      2. Drax Group (GB)
      3. Orsted (DK)
      4. Enviva (US)
      5. Renewable Energy Group (US)
      6. BASF (DE)
      7. Valmet (FI)
      8. Green Plains (US)
    3. Appendix
      1. References
      2. Related Reports 6 LIST OF FIGURES
    4. MARKET SYNOPSIS
    5. NORTH AMERICA MARKET ANALYSIS
    6. US MARKET ANALYSIS BY TYPE
    7. US MARKET ANALYSIS BY FEEDSTOCK
    8. US MARKET ANALYSIS BY APPLICATION
    9. CANADA MARKET ANALYSIS BY TYPE
    10. CANADA MARKET ANALYSIS BY FEEDSTOCK
    11. CANADA MARKET ANALYSIS BY APPLICATION
    12. EUROPE MARKET ANALYSIS
    13. GERMANY MARKET ANALYSIS BY TYPE
    14. GERMANY MARKET ANALYSIS BY FEEDSTOCK
    15. GERMANY MARKET ANALYSIS BY APPLICATION
    16. UK MARKET ANALYSIS BY TYPE
    17. UK MARKET ANALYSIS BY FEEDSTOCK
    18. UK MARKET ANALYSIS BY APPLICATION
    19. FRANCE MARKET ANALYSIS BY TYPE
    20. FRANCE MARKET ANALYSIS BY FEEDSTOCK
    21. FRANCE MARKET ANALYSIS BY APPLICATION
    22. RUSSIA MARKET ANALYSIS BY TYPE
    23. RUSSIA MARKET ANALYSIS BY FEEDSTOCK
    24. RUSSIA MARKET ANALYSIS BY APPLICATION
    25. ITALY MARKET ANALYSIS BY TYPE
    26. ITALY MARKET ANALYSIS BY FEEDSTOCK
    27. ITALY MARKET ANALYSIS BY APPLICATION
    28. SPAIN MARKET ANALYSIS BY TYPE
    29. SPAIN MARKET ANALYSIS BY FEEDSTOCK
    30. SPAIN MARKET ANALYSIS BY APPLICATION
    31. REST OF EUROPE MARKET ANALYSIS BY TYPE
    32. REST OF EUROPE MARKET ANALYSIS BY FEEDSTOCK
    33. REST OF EUROPE MARKET ANALYSIS BY APPLICATION
    34. APAC MARKET ANALYSIS
    35. CHINA MARKET ANALYSIS BY TYPE
    36. CHINA MARKET ANALYSIS BY FEEDSTOCK
    37. CHINA MARKET ANALYSIS BY APPLICATION
    38. INDIA MARKET ANALYSIS BY TYPE
    39. INDIA MARKET ANALYSIS BY FEEDSTOCK
    40. INDIA MARKET ANALYSIS BY APPLICATION
    41. JAPAN MARKET ANALYSIS BY TYPE
    42. JAPAN MARKET ANALYSIS BY FEEDSTOCK
    43. JAPAN MARKET ANALYSIS BY APPLICATION
    44. SOUTH KOREA MARKET ANALYSIS BY TYPE
    45. SOUTH KOREA MARKET ANALYSIS BY FEEDSTOCK
    46. SOUTH KOREA MARKET ANALYSIS BY APPLICATION
    47. MALAYSIA MARKET ANALYSIS BY TYPE
    48. MALAYSIA MARKET ANALYSIS BY FEEDSTOCK
    49. MALAYSIA MARKET ANALYSIS BY APPLICATION
    50. THAILAND MARKET ANALYSIS BY TYPE
    51. THAILAND MARKET ANALYSIS BY FEEDSTOCK
    52. THAILAND MARKET ANALYSIS BY APPLICATION
    53. INDONESIA MARKET ANALYSIS BY TYPE
    54. INDONESIA MARKET ANALYSIS BY FEEDSTOCK
    55. INDONESIA MARKET ANALYSIS BY APPLICATION
    56. REST OF APAC MARKET ANALYSIS BY TYPE
    57. REST OF APAC MARKET ANALYSIS BY FEEDSTOCK
    58. REST OF APAC MARKET ANALYSIS BY APPLICATION
    59. SOUTH AMERICA MARKET ANALYSIS
    60. BRAZIL MARKET ANALYSIS BY TYPE
    61. BRAZIL MARKET ANALYSIS BY FEEDSTOCK
    62. BRAZIL MARKET ANALYSIS BY APPLICATION
    63. MEXICO MARKET ANALYSIS BY TYPE
    64. MEXICO MARKET ANALYSIS BY FEEDSTOCK
    65. MEXICO MARKET ANALYSIS BY APPLICATION
    66. ARGENTINA MARKET ANALYSIS BY TYPE
    67. ARGENTINA MARKET ANALYSIS BY FEEDSTOCK
    68. ARGENTINA MARKET ANALYSIS BY APPLICATION
    69. REST OF SOUTH AMERICA MARKET ANALYSIS BY TYPE
    70. REST OF SOUTH AMERICA MARKET ANALYSIS BY FEEDSTOCK
    71. REST OF SOUTH AMERICA MARKET ANALYSIS BY APPLICATION
    72. MEA MARKET ANALYSIS
    73. GCC COUNTRIES MARKET ANALYSIS BY TYPE
    74. GCC COUNTRIES MARKET ANALYSIS BY FEEDSTOCK
    75. GCC COUNTRIES MARKET ANALYSIS BY APPLICATION
    76. SOUTH AFRICA MARKET ANALYSIS BY TYPE
    77. SOUTH AFRICA MARKET ANALYSIS BY FEEDSTOCK
    78. SOUTH AFRICA MARKET ANALYSIS BY APPLICATION
    79. REST OF MEA MARKET ANALYSIS BY TYPE
    80. REST OF MEA MARKET ANALYSIS BY FEEDSTOCK
    81. REST OF MEA MARKET ANALYSIS BY APPLICATION
    82. KEY BUYING CRITERIA OF ENERGY & POWER
    83. RESEARCH PROCESS OF MRFR
    84. DRO ANALYSIS OF ENERGY & POWER
    85. DRIVERS IMPACT ANALYSIS: ENERGY & POWER
    86. RESTRAINTS IMPACT ANALYSIS: ENERGY & POWER
    87. SUPPLY / VALUE CHAIN: ENERGY & POWER
    88. ENERGY & POWER, BY TYPE, 2024 (% SHARE)
    89. ENERGY & POWER, BY TYPE, 2024 TO 2035 (USD Billion)
    90. ENERGY & POWER, BY FEEDSTOCK, 2024 (% SHARE)
    91. ENERGY & POWER, BY FEEDSTOCK, 2024 TO 2035 (USD Billion)
    92. ENERGY & POWER, BY APPLICATION, 2024 (% SHARE)
    93. ENERGY & POWER, BY APPLICATION, 2024 TO 2035 (USD Billion)
    94. BENCHMARKING OF MAJOR COMPETITORS 7 LIST OF TABLES
    95. LIST OF ASSUMPTIONS
    96. North America MARKET SIZE ESTIMATES; FORECAST
      1. BY TYPE, 2025-2035 (USD Billion)
      2. BY FEEDSTOCK, 2025-2035 (USD Billion)
      3. BY APPLICATION, 2025-2035 (USD Billion)
    97. US MARKET SIZE ESTIMATES; FORECAST
      1. BY TYPE, 2025-2035 (USD Billion)
      2. BY FEEDSTOCK, 2025-2035 (USD Billion)
      3. BY APPLICATION, 2025-2035 (USD Billion)
    98. Canada MARKET SIZE ESTIMATES; FORECAST
      1. BY TYPE, 2025-2035 (USD Billion)
      2. BY FEEDSTOCK, 2025-2035 (USD Billion)
      3. BY APPLICATION, 2025-2035 (USD Billion)
    99. Europe MARKET SIZE ESTIMATES; FORECAST
      1. BY TYPE, 2025-2035 (USD Billion)
      2. BY FEEDSTOCK, 2025-2035 (USD Billion)
      3. BY APPLICATION, 2025-2035 (USD Billion)
    100. Germany MARKET SIZE ESTIMATES; FORECAST
      1. BY TYPE, 2025-2035 (USD Billion)
      2. BY FEEDSTOCK, 2025-2035 (USD Billion)
      3. BY APPLICATION, 2025-2035 (USD Billion)
    101. UK MARKET SIZE ESTIMATES; FORECAST
      1. BY TYPE, 2025-2035 (USD Billion)
      2. BY FEEDSTOCK, 2025-2035 (USD Billion)
      3. BY APPLICATION, 2025-2035 (USD Billion)
    102. France MARKET SIZE ESTIMATES; FORECAST
      1. BY TYPE, 2025-2035 (USD Billion)
      2. BY FEEDSTOCK, 2025-2035 (USD Billion)
      3. BY APPLICATION, 2025-2035 (USD Billion)
    103. Russia MARKET SIZE ESTIMATES; FORECAST
      1. BY TYPE, 2025-2035 (USD Billion)
      2. BY FEEDSTOCK, 2025-2035 (USD Billion)
      3. BY APPLICATION, 2025-2035 (USD Billion)
    104. Italy MARKET SIZE ESTIMATES; FORECAST
      1. BY TYPE, 2025-2035 (USD Billion)
      2. BY FEEDSTOCK, 2025-2035 (USD Billion)
      3. BY APPLICATION, 2025-2035 (USD Billion)
    105. Spain MARKET SIZE ESTIMATES; FORECAST
      1. BY TYPE, 2025-2035 (USD Billion)
      2. BY FEEDSTOCK, 2025-2035 (USD Billion)
      3. BY APPLICATION, 2025-2035 (USD Billion)
    106. Rest of Europe MARKET SIZE ESTIMATES; FORECAST
      1. BY TYPE, 2025-2035 (USD Billion)
      2. BY FEEDSTOCK, 2025-2035 (USD Billion)
      3. BY APPLICATION, 2025-2035 (USD Billion)
    107. APAC MARKET SIZE ESTIMATES; FORECAST
      1. BY TYPE, 2025-2035 (USD Billion)
      2. BY FEEDSTOCK, 2025-2035 (USD Billion)
      3. BY APPLICATION, 2025-2035 (USD Billion)
    108. China MARKET SIZE ESTIMATES; FORECAST
      1. BY TYPE, 2025-2035 (USD Billion)
      2. BY FEEDSTOCK, 2025-2035 (USD Billion)
      3. BY APPLICATION, 2025-2035 (USD Billion)
    109. India MARKET SIZE ESTIMATES; FORECAST
      1. BY TYPE, 2025-2035 (USD Billion)
      2. BY FEEDSTOCK, 2025-2035 (USD Billion)
      3. BY APPLICATION, 2025-2035 (USD Billion)
    110. Japan MARKET SIZE ESTIMATES; FORECAST
      1. BY TYPE, 2025-2035 (USD Billion)
      2. BY FEEDSTOCK, 2025-2035 (USD Billion)
      3. BY APPLICATION, 2025-2035 (USD Billion)
    111. South Korea MARKET SIZE ESTIMATES; FORECAST
      1. BY TYPE, 2025-2035 (USD Billion)
      2. BY FEEDSTOCK, 2025-2035 (USD Billion)
      3. BY APPLICATION, 2025-2035 (USD Billion)
    112. Malaysia MARKET SIZE ESTIMATES; FORECAST
      1. BY TYPE, 2025-2035 (USD Billion)
      2. BY FEEDSTOCK, 2025-2035 (USD Billion)
      3. BY APPLICATION, 2025-2035 (USD Billion)
    113. Thailand MARKET SIZE ESTIMATES; FORECAST
      1. BY TYPE, 2025-2035 (USD Billion)
      2. BY FEEDSTOCK, 2025-2035 (USD Billion)
      3. BY APPLICATION, 2025-2035 (USD Billion)
    114. Indonesia MARKET SIZE ESTIMATES; FORECAST
      1. BY TYPE, 2025-2035 (USD Billion)
      2. BY FEEDSTOCK, 2025-2035 (USD Billion)
      3. BY APPLICATION, 2025-2035 (USD Billion)
    115. Rest of APAC MARKET SIZE ESTIMATES; FORECAST
      1. BY TYPE, 2025-2035 (USD Billion)
      2. BY FEEDSTOCK, 2025-2035 (USD Billion)
      3. BY APPLICATION, 2025-2035 (USD Billion)
    116. South America MARKET SIZE ESTIMATES; FORECAST
      1. BY TYPE, 2025-2035 (USD Billion)
      2. BY FEEDSTOCK, 2025-2035 (USD Billion)
      3. BY APPLICATION, 2025-2035 (USD Billion)
    117. Brazil MARKET SIZE ESTIMATES; FORECAST
      1. BY TYPE, 2025-2035 (USD Billion)
      2. BY FEEDSTOCK, 2025-2035 (USD Billion)
      3. BY APPLICATION, 2025-2035 (USD Billion)
    118. Mexico MARKET SIZE ESTIMATES; FORECAST
      1. BY TYPE, 2025-2035 (USD Billion)
      2. BY FEEDSTOCK, 2025-2035 (USD Billion)
      3. BY APPLICATION, 2025-2035 (USD Billion)
    119. Argentina MARKET SIZE ESTIMATES; FORECAST
      1. BY TYPE, 2025-2035 (USD Billion)
      2. BY FEEDSTOCK, 2025-2035 (USD Billion)
      3. BY APPLICATION, 2025-2035 (USD Billion)
    120. Rest of South America MARKET SIZE ESTIMATES; FORECAST
      1. BY TYPE, 2025-2035 (USD Billion)
      2. BY FEEDSTOCK, 2025-2035 (USD Billion)
      3. BY APPLICATION, 2025-2035 (USD Billion)
    121. MEA MARKET SIZE ESTIMATES; FORECAST
      1. BY TYPE, 2025-2035 (USD Billion)
      2. BY FEEDSTOCK, 2025-2035 (USD Billion)
      3. BY APPLICATION, 2025-2035 (USD Billion)
    122. GCC Countries MARKET SIZE ESTIMATES; FORECAST
      1. BY TYPE, 2025-2035 (USD Billion)
      2. BY FEEDSTOCK, 2025-2035 (USD Billion)
      3. BY APPLICATION, 2025-2035 (USD Billion)
    123. South Africa MARKET SIZE ESTIMATES; FORECAST
      1. BY TYPE, 2025-2035 (USD Billion)
      2. BY FEEDSTOCK, 2025-2035 (USD Billion)
      3. BY APPLICATION, 2025-2035 (USD Billion)
    124. Rest of MEA MARKET SIZE ESTIMATES; FORECAST
      1. BY TYPE, 2025-2035 (USD Billion)
      2. BY FEEDSTOCK, 2025-2035 (USD Billion)
      3. BY APPLICATION, 2025-2035 (USD Billion)
    125. PRODUCT LAUNCH/PRODUCT DEVELOPMENT/APPROVAL
    126. ACQUISITION/PARTNERSHIP

Bioenergy Market Segmentation

Bioenergy Type Outlook (USD Million, 2019-2030)

  • Solid Biomass
  • Liquid Biofuel
  • Biogas
  • Others

Bioenergy Feedstock Outlook (USD Million, 2019-2030)

  • Agricultural waste
  • Wood waste
  • Solid Waste
  • Others

Bioenergy Application Outlook (USD Million, 2019-2030)

  • Power generation
  • Heat Generation
  • Transportation
  • Others  

Bioenergy Regional Outlook (USD Million, 2019-2030)

  • North America Outlook (USD Million, 2019-2030)
    • North America Bioenergy by Type
      • Solid Biomass
      • Liquid Biofuel
      • Biogas
      • Others
    • North America Bioenergy by Application
      • Power generation
      • Heat Generation
      • Transportation
      • Others
    • North America Bioenergy by Feedstock
      • Agricultural waste
      • Wood waste
      • Solid Waste
      • Others
  • US Outlook (USD Million, 2019-2030)
  • US Bioenergy by Type
    • Solid Biomass
    • Liquid Biofuel
    • Biogas
    • Others
  • US Bioenergy by Application
    • Power generation
    • Heat Generation
    • Transportation
    • Others
  • US Bioenergy by Feedstock
    • Agricultural waste
    • Wood waste
    • Solid Waste
    • Others
  • Canada Outlook (USD Million, 2019-2030)
  • Canada Bioenergy by Type
    • Solid Biomass
    • Liquid Biofuel
    • Biogas
    • Others
  • Canada Bioenergy by Application
    • Power generation
    • Heat Generation
    • Transportation
    • Others
  • Canada Bioenergy by Feedstock
    • Agricultural waste
    • Wood waste
    • Solid Waste
    • Others
  • Europe Outlook (USD Million, 2019-2030)
    • Europe Bioenergy by Type
      • Solid Biomass
      • Liquid Biofuel
      • Biogas
      • Others
    • Europe Bioenergy by Application
      • Power generation
      • Heat Generation
      • Transportation
      • Others
    • Europe Bioenergy by Feedstock
      • Agricultural waste
      • Wood waste
      • Solid Waste
      • Others
  • Germany Outlook (USD Million, 2019-2030)
  • Germany Bioenergy by Type
    • Solid Biomass
    • Liquid Biofuel
    • Biogas
    • Others
  • Germany Bioenergy by Application
    • Power generation
    • Heat Generation
    • Transportation
    • Others
  • Germany Bioenergy by Feedstock
    • Agricultural waste
    • Wood waste
    • Solid Waste
    • Others
  • France Outlook (USD Million, 2019-2030)
  • France Bioenergy by Type
    • Solid Biomass
    • Liquid Biofuel
    • Biogas
    • Others
  • France Bioenergy by Application
    • Power generation
    • Heat Generation
    • Transportation
    • Others
  • France Bioenergy by Feedstock
    • Agricultural waste
    • Wood waste
    • Solid Waste
    • Others
  • UK Outlook (USD Million, 2019-2030)
  • UK Bioenergy by Type
    • Solid Biomass
    • Liquid Biofuel
  • UK Bioenergy by Application
    • Power generation
    • Heat Generation
    • Transportation
    • Others
  • UK Bioenergy by Feedstock
    • Agricultural waste
    • Wood waste
    • Solid Waste
    • Others
  • ITALY Outlook (USD Million, 2019-2030)
  • ITALY Bioenergy by Type
    • Solid Biomass
    • Liquid Biofuel
    • Biogas
    • Others
  • ITALY Bioenergy by Application
    • Power generation
    • Heat Generation
    • Transportation
    • Others
  • ITALY Bioenergy by Feedstock
    • Agricultural waste
    • Wood waste
    • Solid Waste
    • Others
  • Spain Outlook (USD Million, 2019-2030)
  • Spain Bioenergy by Type
    • Solid Biomass
    • Liquid Biofuel
    • Biogas
    • Others
  • Spain Bioenergy by Application
    • Power generation
    • Heat Generation
    • Transportation
    • Others
  • Spain Bioenergy by Feedstock
    • Agricultural waste
    • Wood waste
    • Solid Waste
    • Others
  • Rest Of Europe Outlook (USD Million, 2019-2030)
  • Rest Of Europe Bioenergy by Type
    • Solid Biomass
    • Liquid Biofuel
    • Biogas
    • Others
  • Rest Of Europe Bioenergy by Application
    • Power generation
    • Heat Generation
    • Transportation
    • Others
  • Rest Of Europe Bioenergy by Feedstock
    • Agricultural waste
    • Wood waste
    • Solid Waste
    • Others
  • Asia-Pacific Outlook (USD Million, 2019-2030)
    • Asia-Pacific Bioenergy by Type
      • Solid Biomass
      • Liquid Biofuel
      • Biogas
      • Others
    • Asia-Pacific Bioenergy by Application
      • Power generation
      • Heat Generation
      • Transportation
      • Others
    • Asia-Pacific Bioenergy by Feedstock
      • Agricultural waste
      • Wood waste
      • Solid Waste
      • Others
  • China Outlook (USD Million, 2019-2030)
  • China Bioenergy by Type
    • Solid Biomass
    • Liquid Biofuel
    • Biogas
    • Others
  • China Bioenergy by Application
    • Power generation
    • Heat Generation
    • Transportation
    • Others
  • China Bioenergy by Feedstock
    • Agricultural waste
    • Wood waste
    • Solid Waste
    • Others
  • Japan Outlook (USD Million, 2019-2030)
  • Japan Bioenergy by Type
    • Solid Biomass
    • Liquid Biofuel
    • Biogas
    • Others
  • Japan Bioenergy by Application
    • Power generation
    • Heat Generation
    • Transportation
    • Others
  • Japan Bioenergy by Feedstock
    • Agricultural waste
    • Wood waste
    • Solid Waste
    • Others
  • India Outlook (USD Million, 2019-2030)
  • India Bioenergy by Type
    • Solid Biomass
    • Liquid Biofuel
    • Biogas
    • Others
  • India Bioenergy by Application
    • Power generation
    • Heat Generation
    • Transportation
    • Others
  • India Bioenergy by Feedstock
    • Agricultural waste
    • Wood waste
    • Solid Waste
    • Others
  • Australia Outlook (USD Million, 2019-2030)
  • Australia Bioenergy by Type
    • Solid Biomass
    • Liquid Biofuel
    • Biogas
    • Others
  • Australia Bioenergy by Application
    • Power generation
    • Heat Generation
    • Transportation
    • Others
  • Australia Bioenergy by Feedstock
    • Agricultural waste
    • Wood waste
    • Solid Waste
    • Others
  • Rest of Asia-Pacific Outlook (USD Million, 2019-2030)
  • Rest of Asia-Pacific Bioenergy by Type
    • Solid Biomass
    • Liquid Biofuel
    • Biogas
    • Others
  • Rest of Asia-Pacific Bioenergy by Application
    • Power generation
    • Heat Generation
    • Transportation
    • Others
  • Rest of Asia-Pacific Bioenergy by Feedstock
    • Agricultural waste
    • Wood waste
    • Solid Waste
    • Others
  • Middle East & Africa Outlook (USD Million, 2019-2030)
    • Middle East & Africa Bioenergy by Type
      • Solid Biomass
      • Liquid Biofuel
      • Biogas
      • Others
    • Middle East & Africa Bioenergy by Application
      • Power generation
      • Heat Generation
      • Transportation
      • Others
    • Middle East & Africa Bioenergy by Feedstock
      • Agricultural waste
      • Wood waste
      • Solid Waste
      • Others
  • Saudi Arabia Outlook (USD Million, 2019-2030)
  • Saudi Arabia Bioenergy by Type
    • Solid Biomass
    • Liquid Biofuel
    • Biogas
    • Others
  • Saudi Arabia Bioenergy by Application
    • Power generation
    • Heat Generation
    • Transportation
    • Others
  • Saudi Arabia Bioenergy by Feedstock
    • Agricultural waste
    • Wood waste
    • Solid Waste
    • Others
  • UAE Outlook (USD Million, 2019-2030)
  • UAE Bioenergy by Type
    • Solid Biomass
    • Liquid Biofuel
    • Biogas
    • Others
  • UAE Bioenergy by Application
    • Power generation
    • Heat Generation
    • Transportation
    • Others
  • UAE Bioenergy by Feedstock
    • Agricultural waste
    • Wood waste
    • Solid Waste
    • Others
  • South Africa Outlook (USD Million, 2019-2030)
  • South Africa US Bioenergy by Type
    • Solid Biomass
    • Liquid Biofuel
    • Biogas
    • Others
  • South Africa Bioenergy by Application
    • Power generation
    • Heat Generation
    • Transportation
    • Others
  • South Africa Bioenergy by Feedstock
    • Agricultural waste
    • Wood waste
    • Solid Waste
    • Others
  • Rest of Middle East & Africa Outlook (USD Million, 2019-2030)
  • Rest of Middle East & Africa Bioenergy by Type
    • Solid Biomass
    • Liquid Biofuel
    • Biogas
    • Others
  • Rest of Middle East & Africa Bioenergy by Application
    • Power generation
    • Heat Generation
    • Transportation
    • Others
  • Rest of Middle East & Africa Bioenergy by Feedstock
    • Agricultural waste
    • Wood waste
    • Solid Waste
    • Others
  • South America Outlook (USD Million, 2019-2030)
    • South America Bioenergy by Type
      • Solid Biomass
      • Liquid Biofuel
      • Biogas
      • Others
    • South America Bioenergy by Application
      • Power generation
      • Heat Generation
      • Transportation
      • Others
    • South America Bioenergy by Feedstock
      • Agricultural waste
      • Wood waste
      • Solid Waste
      • Others
    • Brazil Outlook (USD Million, 2019-2030)
    • Brazil Bioenergy by Type
      • Solid Biomass
      • Liquid Biofuel
      • Biogas
      • Others
    • Brazil US Bioenergy by Application
      • Power generation
      • Heat Generation
      • Transportation
      • Others
    • Brazil Bioenergy by Feedstock
      • Agricultural waste
      • Wood waste
      • Solid Waste
      • Others
    • Argentina Outlook (USD Million, 2019-2030)
    • Argentina Bioenergy by Type
      • Solid Biomass
      • Liquid Biofuel
      • Biogas
      • Others
    • Argentina Bioenergy by Application
      • Power generation
      • Heat Generation
      • Transportation
      • Others
    • Argentina Bioenergy by Feedstock
      • Agricultural waste
      • Wood waste
      • Solid Waste
      • Others
    • Rest of South America Outlook (USD Million, 2019-2030)
    • Rest of South America US Bioenergy by Type
      • Solid Biomass
      • Liquid Biofuel
      • Biogas
      • Others
    • Rest of South America Bioenergy by Application
      • Power generation
      • Heat Generation
      • Transportation
      • Others
    • Rest of South America Bioenergy by Feedstock
      • Agricultural waste
      • Wood waste
      • Solid Waste
      • Others
Infographic

Free Sample Request

Kindly complete the form below to receive a free sample of this Report

Get Free Sample

Customer Strories

“I am very pleased with how market segments have been defined in a relevant way for my purposes (such as "Portable Freezers & refrigerators" and "last-mile"). In general the report is well structured. Thanks very much for your efforts.”

Victoria Milne

Founder

Compare Licence

×
Features License Type
Single User Multiuser License Enterprise User
Price $4,950 $5,950 $7,250
Maximum User Access Limit 1 User Upto 10 Users Unrestricted Access Throughout the Organization
Free Customization
Direct Access to Analyst
Deliverable Format
Platform Access
Discount on Next Purchase 10% 15% 15%
Printable Versions