• Cat-intel
  • MedIntelliX
  • Resources
  • About Us
  • Hero Background
    English
    Chinese
    French
    Japanese
    Korean
    German
    Spanish

    Buses and coaches Market Analysis

    ID: MRFR/AM/9948-CR
    188 Pages
    Swapnil Palwe
    March 2024

    Buses and Coaches Market Research Report Information by Type (Single Deck, Double Deck, Low floor buses, Minibus, Coaches and Others), by Propulsion (ICE and Electric), by Seat Capacity (15-30 Seats, 31-50 Seats and more than 50 Seats), By Application (City Buses, Intercity Coaches, Airport Shuttle, Delivery Van, School Buses and Others), By Sales Channel (OEM and Aftermarket) and By Region (...

    Share:
    Download PDF ×

    We do not share your information with anyone. However, we may send you emails based on your report interest from time to time. You may contact us at any time to opt-out.

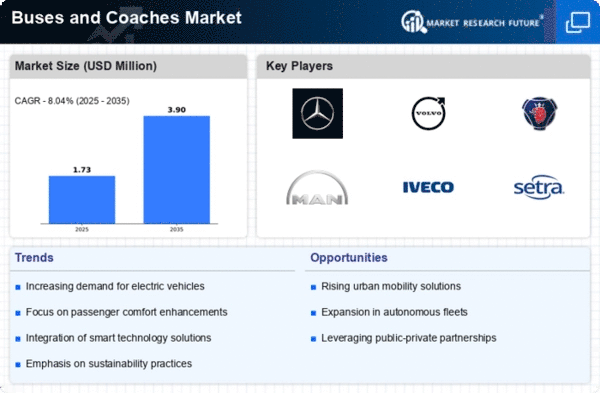
    Buses and coaches Market Infographic
    $ 4,950.0
    $ 5,950.0
    $ 7,250.0

    Market Analysis

    In-depth Analysis of Buses and coaches Market Industry Landscape

    The buses and coaches market is influenced by a myriad of factors that collectively contribute to its size, growth, and dynamics. One of the primary drivers of this market is the increasing demand for sustainable and efficient public transportation solutions. As urbanization continues to accelerate globally, cities face challenges related to traffic congestion, pollution, and the need for reliable mass transit. Buses and coaches emerge as viable solutions, offering a more environmentally friendly alternative to individual car ownership and helping alleviate congestion in urban areas. Government initiatives and policies play a pivotal role in shaping the buses and coaches market. Many governments around the world are implementing measures to promote public transportation, reduce emissions, and enhance the overall efficiency of transit systems. Incentives, subsidies, and regulatory frameworks aimed at supporting the adoption of clean and sustainable transportation solutions significantly impact the market. As a result, both public and private entities are incentivized to invest in modernizing their fleets with environmentally friendly buses and coaches, further boosting market growth. Advancements in technology are transforming the buses and coaches market, driving innovation and improving the overall efficiency and sustainability of these vehicles. The development of electric and hybrid buses is gaining traction, addressing concerns related to air quality and reducing the carbon footprint of public transportation. Additionally, the integration of smart and connected technologies, such as real-time tracking systems, Wi-Fi connectivity, and advanced safety features, enhances the appeal and functionality of buses and coaches, contributing to market expansion. Global trends in urban mobility, including a shift toward multimodal transportation systems, are influencing the buses and coaches market. Integrated transportation networks that seamlessly connect buses, coaches, trains, and other modes of transit are becoming increasingly important for providing commuters with convenient and efficient travel options. This trend encourages investments in modernizing bus and coach fleets to integrate seamlessly into broader transportation ecosystems, fostering market growth. The growing emphasis on sustainability and corporate social responsibility (CSR) is encouraging businesses and fleet operators to adopt greener transportation solutions. As companies strive to reduce their environmental impact and meet sustainability goals, the demand for eco-friendly buses and coaches is on the rise. This shift in corporate mindset not only positively influences the market but also aligns with broader global efforts to combat climate change and reduce dependency on fossil fuels. Market factors related to demographic trends also contribute to the growth of the buses and coaches market. In regions experiencing population growth and urbanization, the demand for efficient and affordable public transportation options is higher. Additionally, an aging population in some areas creates opportunities for the development of accessible and comfortable buses and coaches designed to cater to the specific needs of elderly passengers, further influencing market dynamics. Infrastructure development, including the expansion and improvement of urban transportation networks, is a critical factor in the buses and coaches market. Investments in new roads, bus lanes, and transit hubs enhance the accessibility and efficiency of public transportation systems. Governments and city planners recognizing the importance of a well-connected and efficient transit infrastructure contribute to a favorable market environment for buses and coaches. In conclusion, the buses and coaches market is shaped by a complex interplay of factors ranging from government policies and technological advancements to global trends in sustainability and urbanization. As the demand for efficient and environmentally friendly transportation solutions continues to grow, the buses and coaches market is poised for further expansion, presenting opportunities for industry players to innovate and contribute to the evolution of public transit systems worldwide.

    Market Summary

    As per Market Research Future Analysis, the Global Buses and Coaches Market was valued at USD 37,510.0 Million in 2022 and is projected to grow from USD 39,832.0 Million in 2023 to USD 68,957.4 Million by 2032, with a CAGR of 6.3% during the forecast period. The market encompasses various vehicles for passenger transport, driven by urbanization, economic growth, and technological advancements. The increasing demand for electric and hybrid buses presents significant opportunities, supported by government incentives and lower operational costs. The market is segmented by type, propulsion, seat capacity, application, and sales channel, with city buses and single deck buses holding substantial shares.

    Key Market Trends & Highlights

    The Buses and Coaches Market is witnessing significant trends driven by environmental concerns and technological advancements.

    • Projected market growth from USD 39,832.0 Million in 2023 to USD 68,957.4 Million by 2032.
    • Single deck buses dominate the market, driven by demand for eco-friendly transportation.
    • Electric and hybrid buses are gaining traction due to government incentives and lower maintenance costs.
    • Asia-Pacific is the largest regional market, propelled by public transport demand and urbanization.

    Market Size & Forecast

    2022 Market Size USD 37,510.0 Million
    2023 Market Size USD 39,832.0 Million
    2032 Market Size USD 68,957.4 Million
    CAGR 6.3% (2023-2032)
    Largest Regional Market Asia-Pacific.

    Major Players

    Anhui Ankai Automobile Co., Ltd, BYD Company Limited, Daimler Truck AG, Proterra, AB Volvo, MAN, Xiamen King Long United Automotive Industry Co., Ltd, Yutong Bus Co., Ltd., NFI Group, Tata Motors.

    Market Trends

    The ongoing transition towards sustainable transportation solutions is reshaping the global buses and coaches market, as cities increasingly prioritize eco-friendly public transit options to reduce urban congestion and emissions.

    U.S. Department of Transportation

    Buses and coaches Market Market Drivers

    Rising Fuel Prices

    Rising fuel prices are influencing the Global Buses and Coaches Market Industry by prompting a shift towards more sustainable transport options. As fuel costs escalate, both operators and passengers are seeking alternatives that offer better economic viability. This has led to increased interest in electric and hybrid buses, which, despite higher initial costs, promise lower operational expenses over time. For example, cities are investing in electric bus infrastructure to mitigate the impact of fuel price volatility. This trend indicates a potential for market expansion, as more stakeholders recognize the long-term benefits of transitioning to alternative fuel sources.

    Growing Urbanization

    The Global Buses and Coaches Market Industry is experiencing a surge driven by rapid urbanization. As cities expand, the demand for public transportation solutions increases, leading to a projected market value of 40.3 USD Billion in 2024. Urban areas are increasingly adopting buses and coaches as efficient means of transport to alleviate traffic congestion and reduce pollution. For instance, cities like London and New York have invested heavily in modern bus fleets, enhancing service frequency and reliability. This trend indicates a shift towards sustainable urban mobility, suggesting that the market will continue to grow as urban populations rise.

    Environmental Regulations

    Stringent environmental regulations are shaping the Global Buses and Coaches Market Industry. Governments worldwide are implementing policies aimed at reducing greenhouse gas emissions, which encourages the adoption of cleaner technologies in public transport. Electric and hybrid buses are gaining traction as cities strive to meet these regulations. For example, the European Union has set ambitious targets for reducing emissions, prompting cities to transition to electric buses. This regulatory environment not only fosters innovation but also positions the market for substantial growth, potentially reaching 82.8 USD Billion by 2035 as more regions adopt eco-friendly transport solutions.

    Market Growth Projections

    The Global Buses and Coaches Market Industry is projected to experience robust growth, with a market value expected to reach 82.8 USD Billion by 2035. This growth trajectory reflects a compound annual growth rate of 6.76% from 2025 to 2035. The increasing demand for efficient public transport solutions, coupled with technological advancements and supportive government policies, is likely to drive this expansion. Furthermore, the shift towards sustainable transport options and the need for improved urban mobility solutions are anticipated to contribute to this upward trend. The market's resilience in adapting to changing consumer preferences and regulatory landscapes suggests a promising future.

    Technological Advancements

    Technological advancements are a key driver in the Global Buses and Coaches Market Industry. Innovations such as smart ticketing systems, real-time tracking, and autonomous driving technology are enhancing the efficiency and appeal of bus services. For instance, cities are increasingly implementing contactless payment systems, making public transport more user-friendly. Moreover, the integration of artificial intelligence in fleet management optimizes routes and reduces operational costs. These advancements are likely to attract more users to public transport, contributing to a compound annual growth rate of 6.76% from 2025 to 2035, as the industry evolves to meet modern transportation needs.

    Increasing Public Transport Investments

    Increasing investments in public transport infrastructure are significantly impacting the Global Buses and Coaches Market Industry. Governments are allocating substantial budgets to enhance public transport systems, recognizing their role in economic development and sustainability. For instance, many countries are prioritizing the expansion of bus rapid transit systems, which offer efficient and cost-effective solutions for urban mobility. This influx of funding is likely to bolster the market, as improved infrastructure attracts more users and encourages the adoption of modern bus fleets. Consequently, the market is poised for growth, with projections indicating a value of 82.8 USD Billion by 2035.

    Market Segment Insights

    Buses and Coaches Market Type Segment Insights

    Buses and Coaches Type Insights

    Based on Type, the Buses and Coaches Market segmentation includes single deck, double deck, low floor buses, minibus, coaches, and others. The single deck segment is the largest segment of the IPMI market, accounting for most of the market share. The buses and coaches market includes an important segment of single deck buses, which are frequently used for public transportation, school buses, and shuttle services.

    These buses generally seat up to 50 passengers and provide a cost-effective mode of transportation for both urban and suburban areas. One significant driver of the single deck bus market is the growing demand for environmentally friendly and fuel-efficient vehicles. In recent years, the use of alternative fuels such as electric, hybrid, and CNG (compressed natural gas) in single deck buses has become increasingly popular.

    Buses and Coaches Market Propulsion Segment Insights

    Buses and Coaches Propulsion Insights

    Based on Propulsion, the Buses and Coaches Market segmentation includes ICE and electric. The ICE segment is the largest segment of the IPMI market, accounting for most of the market share. the ICE buses and coaches’ segment of the global market is expected to continue growing in the near future, driven by factors such as increasing demand for public transportation, rising disposable incomes, and the expansion of the global economy. Nevertheless, it is important for the industry to address environmental concerns by exploring and adopting sustainable fuel technologies.

    Source: Secondary Research, Primary Research, Market Research Future Database, and Analyst Review

    Buses and Coaches Market Seat Capacity Segment Insights

    Buses and Coaches Seat Capacity Insights

    Based on Seat Capacity, the Buses and Coaches Market segmentation includes 15-30 Seats, 31-50 Seats and more than 50 Seats. 31-50 Seats and more than 50 Seats hold the largest market share in 2022. These coaches offer comfort and convenience, featuring amenities such as reclining seats, onboard toilets, and entertainment systems.

    Airport shuttles are also a sizeable portion of this market segment, employed to transport passengers between airports and other locations. These shuttles generally have spacious luggage compartments and comfortable seating arrangements. Overall, the 31-50 seat buses and coaches’ market is a vital market that caters to diverse transportation needs. As the demand for efficient and comfortable transportation continues to increase, this market segment is expected to grow further in the future.

    Buses and Coaches Industry Application Segment Insights:

    Buses and Coaches Application Insights

    Based on application the Buses and Coaches Market is divided into City Buses, Intercity Coaches, Airport Shuttle, Delivery Van, School Buses, and Others. City buses hold the largest market share as they are designed to operate in urban areas, providing residents and commuters with a convenient and affordable means of travel. These buses are designed for frequent stops and starts and typically have a low-floor design for easy access and disembarkation.

    The city buses segment of the global buses and coaches’ market is driven by factors such as increasing urbanization, government initiatives to reduce traffic congestion and air pollution, and rising demand for sustainable transportation options.

    Buses and Coaches Market Sales Channel Segment Insights:

    Buses and Coaches Sales Channel Insights

    Based on Sales Channel, the Buses and Coaches Market segmentation includes OEM and aftermarket. By sales channel, the OEM segment holds the majority market share in 2022 contributing 75.3 % of the market share. Original Equipment Manufacturers (OEM) are a significant player in the global buses and coach’s market. OEMs are companies that design, manufacture, and sell buses and coaches under their own brand name. They play a critical role in the industry by providing end-users with a range of options and features and driving innovation in the market.

    Get more detailed insights about Buses and Coaches Market Research Report - Forecast to 2032

    Regional Insights

    By Region, the study provides market insights into North America, Europe, Asia-Pacific, Middle East & Africa, and Latin America. In terms of revenue, Asia-Pacific is the largest and most advanced market for the Buses and Coaches Market. The Asia Pacific region is a significant market for buses and coaches, with numerous manufacturers and operators engaged in the production and usage of these vehicles. Demand for public transport, tourism, and private hire services drives the market.

    The market is highly fragmented, with various manufacturers and operators located across different countries in the region. Some of the major manufacturers of buses and coaches in Asia Pacific are Toyota, Isuzu Motors, Hino Motors, Tata Motors, Hyundai Motor Company, and Yutong. In terms of demand, the Asia Pacific buses and coaches’ market is propelled by the need for efficient and dependable public transport services to meet the growing transportation requirements of the rapidly expanding urban population.

    Figure3: Buses And Coaches Market Size By Region 2022&2032

    BUSES AND COACHES MARKET SIZE BY REGION 2022&2032

    Source: Secondary Research, Primary Research, Market Research Future Database, and Analyst Review

    Further, the major countries studied in the market report are the U.S., Canada, Germany, France, the UK, Italy, Spain, China, Japan, India, Australia, South Korea, and Brazil.

    The North America market is expected to grow because of the rising number of data centers in the region. The market is propelled by various factors, including the rising demand for public transportation, the expansion of the tourism industry, and the requirement for effective and sustainable transportation alternatives. The United States dominates the buses and coaches’ market in North America, occupying the majority of the market share.

    The demand for buses and coaches in the US is fueled by factors such as the growing urban population, the increasing focus on eco-friendly transportation, and the need to replace old fleets. Moreover, the tourism industry in North America is a significant driver of the demand for buses and coaches.

    The Europe region is predicted to have a significant share of the global market is primarily driven by demand for transport services, including public transport, tourism, and private hire. The market is fueled by the demand for transport services, including public transport, tourism, and private hire.

    With many manufacturers and operators scattered across different countries, the market is highly fragmented. Some of the notable manufacturers of buses and coaches in Europe are Daimler AG, Volvo Group, Iveco, MAN Truck & Bus, and Scania AB. The public transport sector plays a significant role in driving demand for buses and coaches in Europe, followed by the tourism industry, which requires coaches to ferry tourists to different destinations across the continent.

    Key Players and Competitive Insights

    With a strong presence across different verticals and geographies, the Buses and Coaches Market is highly competitive and dominated by established, pure-play vendors. These vendors have a robust geographic footprint and partner ecosystem to cater to diverse customer segments. The Buses and Coaches Market is highly competitive, with many vendors offering similar products and services.

    The major players in the market include Anhui Ankai Automobile Co., Ltd, BYD Company Limited, Daimler Truck AG, Proterra, AB Volvo, MAN, Xiamen King Long United Automotive Industry Co., Ltd, Yutong Bus Co., Ltd., NFI Group, and Tata Motors. are the major players in the market, competing in terms of a variety of products for the global buses and coaches’ market and their components, as well as efficiency, reliability, affordability, and advanced technology.

    The primary focus of the players is to provide advanced products to aid in increasing adoption, which could help strengthen a country’s growth with advanced products. Although global players dominate the market, a few regional and other local players with a limited market share also have a prominent presence in this market.

    Key Companies in the Buses and coaches Market market include

    Industry Developments

      • In May 2023, King Long has signed strategic cooperation agreement with Vivipra, a long-distance bus sales agent in Chile. This agreement will enhance the brand recognition & influence of King Long and promote the development of local public transportation in Chile.

      • In April 2023, Volvo Penta has invested in Utility Innovation Group (UIG) to acquire a minority stake in the group. This investment will accelerate Volvo Penta’s entry into the utility sector and further develop battery energy storage subsystem & power generation portfolio as part of its road to net zero.

      • In Septem,ber 2022, Ankai has signed a framework cooperation agreement with JAC Group, Fudi Battery Co., Ltd. and Zhechu Energy Group Co., Ltd. for Vehicle Power Battery Development & Production. The company will Invest 450 million RMB in this new joint venture.

    Future Outlook

    Buses and coaches Market Future Outlook

    The Global Buses and Coaches Market is projected to grow at a 6.76% CAGR from 2024 to 2035, driven by urbanization, environmental regulations, and technological advancements.

    New opportunities lie in:

    • Invest in electric bus technology to meet sustainability goals.
    • Develop smart transit solutions integrating AI for operational efficiency.
    • Expand into emerging markets with tailored financing options for fleet purchases.

    By 2035, the market is expected to demonstrate robust growth and innovation, solidifying its role in sustainable transportation.

    Market Segmentation

    Buses and Coaches Type Outlook

    • Single Deck
    • Double Deck
    • Low floor buses
    • Minibus
    • Coaches
    • Others

    Buses and Coaches Regional Outlook

    North America
    • US
    • Canada

    Buses and Coaches Propulsion Outlook

    • ICE
    • Electric

    Buses and Coaches Application Outlook

    • City Buses
    • Intercity Coaches
    • Airport Shuttle
    • Delivery Van
    • School Buses
    • Others

    Buses and Coaches Sales Channel Outlook

    • OEM
    • Aftermarket

    Buses and Coaches Seat Capacity Outlook

    • 15-30 Seats
    • 31-50 Seats
    • More than 50 Seats

    Report Scope

    Report Attribute/Metric Details
    Market Size2022 USD 37,510.0 Million
    Market Size 2023 USD 39,832.0 Million
    Market Size 2032 USD 68,957.4 Million
    Compound Annual Growth Rate (CAGR) 6.3 % (2023-2032)
    Base Year 2022
    Market Forecast Period 2023-2032
    Historical Data 2019- 2022
    Market Forecast Units Value (USD Million)
    Report Coverage Revenue Forecast, Market Competitive Landscape, Growth Factors, and Trends
    Segments Covered Type, Propulsion, Seat Capacity, Application, Sales Channel and Region
    Geographies Covered Europe, North America, Asia-Pacific, Middle East & Africa, and Latin America
    Countries Covered The U.S, Germany, Canada, U.K., Italy, France, Spain, Japan, China, Mexico, India, South Korea, Brazil, and others.
    Key Companies Profiled Anhui Ankai Automobile Co., Ltd, BYD Company Limited, Daimler Truck AG, Proterra, AB Volvo, MAN, Xiamen King Long United Automotive Industry Co., Ltd, Yutong Bus Co., Ltd., NFI Group, and Tata Motors.
    Key Market Opportunities ·       Increasing Demand for Electric & Hybrid Vehicles
    Key Market Dynamics ·       Increased Appetite for Connectivity And Emerging Technologies ·       Growing Investments in Public Transportation Infrastructure

    Market Highlights

    Author

    Swapnil Palwe
    Team Lead - Research

    She holds an experience of about 6+ years in market research and business consulting, working under the spectrum of information communication technology, telecommunications and semiconductor domains. aarti conceptualizes and implements a scalable business strategy and provides strategic leadership to the clients. her expertise lies in market estimation, competitive intelligence, pipeline analysis, customer assessment, etc.

    Leave a Comment

    Latest Comments

    John Doe
    john@example.com

    This is a great article! Really helped me understand the topic better.

    Posted on July 23, 2025, 10:15 AM
    Jane Smith
    jane@domain.com

    Thanks for sharing this. I’ve bookmarked it for later reference.

    Posted on July 22, 2025, 7:45 PM

    FAQs

    How much is the Buses and Coaches Market?

    The Buses and Coaches Market size is expected to be valued at USD 37,510.0 Million in 2022.

    What is the growth rate of the Buses and Coaches Market?

    The global market is projected to grow at a CAGR of 6.3 % during the forecast period, 2023-2032.

    Which region held the largest market share in the Buses and Coaches Market?

    Asia-Pacific had the largest share of the global market.

    Who are the key players in the Buses and Coaches Market?

    The key players in the market are Anhui Ankai Automobile Co., Ltd, BYD Company Limited, Daimler Truck AG, Proterra, AB Volvo, MAN, Xiamen King Long United Automotive Industry Co., Ltd, Yutong Bus Co., Ltd., NFI Group, and Tata Motors.

    Which Type led the Buses and Coaches Market?

    The single deck category dominated the market in 2022.

    1. Table of Contents
    2. Executive Summary 17
      1. GLOBAL BUSES AND COACHES MARKET, BY TYPE 19
        1. GLOBAL BUSES AND COACHES MARKET, BY PROPULSION 20
        2. GLOBAL BUSES AND COACHES MARKET, BY SEAT CAPACITY 21
        3. GLOBAL BUSES AND COACHES MARKET, BY APPLICATION 22
        4. GLOBAL BUSES AND COACHES MARKET, BY SALES CHANNEL 23
        5. GLOBAL BUSES AND COACHES MARKET, BY REGION 24
    3. Market Introduction 25
      1. DEFINITION 25
      2. Scope of the Study 25
      3. RESEARCH OBJECTIVE 25
      4. MARKET STRUCTURE 26
    4. Research Methodology 27
      1. RESEARCH PROCESS 27
      2. PRIMARY RESEARCH 28
      3. SECONDARY RESEARCH 29
      4. MARKET SIZE ESTIMATION 30
      5. FORECAST MODEL 31
      6. LIST OF ASSUMPTIONS 32
    5. MARKET DYNAMICS 33
      1. OVERVIEW 33
      2. DRIVERS 34
        1. INCREASED APPETITE FOR CONNECTIVITY AND EMERGING TECHNOLOGIES 34
        2. GROWING INVESTMENTS IN PUBLIC TRANSPORTATION INFRASTRUCTURE 34
      3. RESTRAINTS 35
        1. HIGH INITIAL COST 35
      4. OPPORTUNITIES 36
        1. INCREASING DEMAND FOR ELECTRIC & HYBRID VEHICLES 36
      5. COVID-19 IMPACT ANALYSIS 36
        1. IMPACT ON OVERALL AUTOMOTIVE INDUSTRY 36
        2. IMPACT ON BUSES AND COACHES MARKET 37
        3. IMPACT ON THE SUPPLY CHAIN 37
        4. IMPACT ON MARKET DEMAND OF BUSES AND COACHES 39
        5. IMPACT ON PRICING OF BUSES AND COACHES 39
    6. MARKET FACTOR ANALYSIS 40
      1. SUPPLY CHAIN ANALYSIS 40
        1. DESIGN & DEVELOPMENT 41
        2. RAW MATERIAL SUPPLY 41
        3. MANUFACTURE & ASSEMBLY 41
        4. SALES & DISTRIBUTION 41
        5. END USERS 42
      2. PORTER''S FIVE FORCES MODEL 42
        1. THREAT OF NEW ENTRANTS 43
        2. BARGAINING POWER OF SUPPLIERS 43
        3. THREAT OF SUBSTITUTES 43
        4. BARGAINING POWER OF BUYERS 43
        5. INTENSITY OF RIVALRY 43
    7. GLOBAL BUSES AND COACHES MARKET, BY TYPE 44
      1. OVERVIEW 44
      2. SINGLE DECK 45
      3. DOUBLE DECK 45
      4. LOW FLOOR BUSES 46
      5. MINIBUS 46
      6. COACHES 46
      7. OTHERS 46
    8. GLOBAL BUSES AND COACHES MARKET, BY PROPULSION 48
      1. OVERVIEW 48
      2. ICE 49
      3. ELECTRIC 49
    9. GLOBAL BUSES AND COACHES MARKET, BY SEAT CAPACITY 50
      1. OVERVIEW 50
      2. 15-30 SEATS 51
      3. 31-50 SEATS 51
      4. MORE THAN 50 SEATS 52
    10. GLOBAL BUSES AND COACHES MARKET, BY APPLICATION 53
      1. OVERVIEW 53
      2. CITY BUSES 54
      3. INTERCITY BUSES 54
      4. AIRPORT SHUTTLE 55
      5. DELIVERY VAN 55
      6. SCHOOL BUSES 55
      7. OTHERS 56
    11. GLOBAL BUSES AND COACHES MARKET, BY SALES CHANNEL 57
      1. OVERVIEW 57
      2. OEM 58
      3. AFTERMARKET 58
    12. GLOBAL BUSES AND COACHES MARKET, BY REGION 59
      1. OVERVIEW 59
      2. NORTH AMERICA 61
        1. US 63
        2. CANADA 65
        3. MEXICO 67
      3. EUROPE 69
        1. GERMANY 71
        2. FRANCE 73
        3. UK 75
        4. SPAIN 76
        5. ITALY 78
        6. POLAND 80
        7. CZECH REPUBLIC 81
        8. REST OF EUROPE 83
      4. ASIA-PACIFIC 85
        1. CHINA 88
        2. INDIA 89
        3. JAPAN 91
        4. SOUTH KOREA 93
        5. AUSTRALIA 94
        6. REST OF ASIA-PACIFIC 96
      5. MIDDLE EAST & AFRICA 98
        1. EGYPT 100
        2. TURKEY 102
        3. REST OF MIDDLE EAST & AFRICA 104
      6. LATIN AMERICA 106
    13. Competitive Landscape 108
      1. OVERVIEW 108
      2. COMPETITIVE BENCHMARKING 109
      3. MARKET SHARE ANALYSIS, 2022 110
      4. KEY DEVELOPMENT IN THE GLOBAL BUSES AND COACHES MARKET 110
        1. PRODUCT LAUNCH 110
        2. COLLABORATION 110
        3. PARTNERSHIP 111
        4. EXPANSION 111
        5. INVESTMENT 111
        6. ACQUSITION 112
        7. CONTRACTS & AGREEMENTS 112
    14. COMPANY PROFILES 113
      1. ANHUI ANKAI AUTOMOBILE CO., LTD 113
        1. COMPANY OVERVIEW 113
        2. FINANCIAL OVERVIEW 113
        3. PRODUCTS OFFERED 114
        4. KEY DEVELOPMENTS 115
        5. SWOT ANALYSIS 116
        6. KEY STRATEGIES 116
      2. BYD COMPANY LIMITED 117
        1. COMPANY OVERVIEW 117
        2. FINANCIAL OVERVIEW 118
        3. PRODUCTS OFFERED 118
        4. KEY DEVELOPMENTS 119
        5. SWOT ANALYSIS 119
        6. KEY STRATEGIES 119
      3. DAIMLER TRUCK AG 120
        1. COMPANY OVERVIEW 120
        2. FINANCIAL OVERVIEW 120
        3. PRODUCTS OFFERED 121
        4. KEY DEVELOPMENTS 122
        5. SWOT ANALYSIS 122
        6. KEY STRATEGIES 122
      4. PROTERRA 123
        1. COMPANY OVERVIEW 123
        2. FINANCIAL OVERVIEW 123
        3. PRODUCTS OFFERED 124
        4. KEY DEVELOPMENTS 124
        5. SWOT ANALYSIS 125
        6. KEY STRATEGIES 125
      5. AB VOLVO 126
        1. COMPANY OVERVIEW 126
        2. FINANCIAL OVERVIEW 127
        3. PRODUCTS OFFERED 127
        4. KEY DEVELOPMENTS 128
        5. SWOT ANALYSIS 128
        6. KEY STRATEGIES 129
      6. MAN 130
        1. COMPANY OVERVIEW 130
        2. FINANCIAL OVERVIEW 130
        3. PRODUCTS OFFERED 131
        4. KEY DEVELOPMENTS 131
        5. SWOT ANALYSIS 132
        6. KEY STRATEGIES 132
      7. XIAMEN KING LONG UNITED AUTOMOTIVE INDUSTRY CO., LTD 133
        1. COMPANY OVERVIEW 133
        2. FINANCIAL OVERVIEW 133
        3. PRODUCTS OFFERED 134
        4. KEY DEVELOPMENTS 134
        5. SWOT ANALYSIS 135
        6. KEY STRATEGIES 135
      8. YUTONG BUS CO., LTD. 136
        1. COMPANY OVERVIEW 136
        2. FINANCIAL OVERVIEW 136
        3. PRODUCTS OFFERED 137
        4. KEY DEVELOPMENTS 137
        5. SWOT ANALYSIS 137
        6. KEY STRATEGIES 138
      9. NFI GROUP 139
        1. COMPANY OVERVIEW 139
        2. FINANCIAL OVERVIEW 140
        3. PRODUCTS OFFERED 140
        4. KEY DEVELOPMENTS 141
        5. SWOT ANALYSIS 141
        6. KEY STRATEGIES 141
      10. TATA MOTORS 142
        1. COMPANY OVERVIEW 142
        2. FINANCIAL OVERVIEW 143
        3. PRODUCTS OFFERED 143
        4. KEY DEVELOPMENTS 143
        5. SWOT ANALYSIS 144
        6. KEY STRATEGIES 144
    15. List of Tables and Figures
      1. LIST OF TABLES
      2. TABLE 1 LIST OF ASSUMPTIONS 32
      3. TABLE 2 GLOBAL BUSES AND COACHES MARKET ESTIMATES & FORECAST, BY TYPE, 2018-2032 (USD MILLION) 45
      4. TABLE 3 GLOBAL BUSES AND COACHES MARKET ESTIMATES & FORECAST, BY PROPULSION, 2018-2032 (USD MILLION) 49
      5. TABLE 4 GLOBAL BUSES AND COACHES MARKET ESTIMATES & FORECAST, BY SEAT CAPACITY, 2018-2032 (USD MILLION) 51
      6. TABLE 5 GLOBAL BUSES AND COACHES MARKET ESTIMATES & FORECAST, BY APPLICATION, 2018-2032 (USD MILLION) 54
      7. TABLE 6 GLOBAL BUSES AND COACHES MARKET ESTIMATES & FORECAST, BY SALES CHANNEL, 2018-2032 (USD MILLION) 58
      8. TABLE 7 GLOBAL BUSES AND COACHES MARKET ESTIMATES & FORECAST, BY REGION, 2019-2032 (USD MILLION) 60
      9. TABLE 8 NORTH AMERICA: BUSES AND COACHES MARKET SIZE, BY COUNTRY, 2018-2032 (USD MILLION) 61
      10. TABLE 9 NORTH AMERICA BUSES AND COACHES MARKET ESTIMATES & FORECAST, BY TYPE, 2018-2032 (USD MILLION) 62
      11. TABLE 10 NORTH AMERICA BUSES AND COACHES MARKET ESTIMATES & FORECAST, BY PROPULSION, 2018-2032 (USD MILLION) 62
      12. TABLE 11 NORTH AMERICA BUSES AND COACHES MARKET ESTIMATES & FORECAST, BY SEAT CAPACITY, 2018-2032 (USD MILLION) 62
      13. TABLE 12 NORTH AMERICA BUSES AND COACHES MARKET ESTIMATES & FORECAST, BY APPLICATION, 2018-2032 (USD MILLION) 63
      14. TABLE 13 NORTH AMERICA BUSES AND COACHES MARKET ESTIMATES & FORECAST, BY SALES CHANNEL, 2018-2032 (USD MILLION) 63
      15. TABLE 14 US BUSES AND COACHES MARKET ESTIMATES & FORECAST, BY TYPE, 2018-2032 (USD MILLION) 63
      16. TABLE 15 US BUSES AND COACHES MARKET ESTIMATES & FORECAST, BY PROPULSION, 2018-2032 (USD MILLION) 64
      17. TABLE 16 US BUSES AND COACHES MARKET ESTIMATES & FORECAST, BY SEAT CAPACITY, 2018-2032 (USD MILLION) 64
      18. TABLE 17 US BUSES AND COACHES MARKET ESTIMATES & FORECAST, BY APPLICATION, 2018-2032 (USD MILLION) 64
      19. TABLE 18 US BUSES AND COACHES MARKET ESTIMATES & FORECAST, BY SALES CHANNEL, 2018-2032 (USD MILLION) 65
      20. TABLE 19 CANADA BUSES AND COACHES MARKET ESTIMATES & FORECAST, BY TYPE, 2018-2032 (USD MILLION) 65
      21. TABLE 20 CANADA BUSES AND COACHES MARKET ESTIMATES & FORECAST, BY PROPULSION, 2018-2032 (USD MILLION) 65
      22. TABLE 21 CANADA BUSES AND COACHES MARKET ESTIMATES & FORECAST, BY SEAT CAPACITY, 2018-2032 (USD MILLION) 66
      23. TABLE 22 CANADA BUSES AND COACHES MARKET ESTIMATES & FORECAST, BY APPLICATION, 2018-2032 (USD MILLION) 66
      24. TABLE 23 CANADA BUSES AND COACHES MARKET ESTIMATES & FORECAST, BY SALES CHANNEL, 2018-2032 (USD MILLION) 66
      25. TABLE 24 MEXICO BUSES AND COACHES MARKET ESTIMATES & FORECAST, BY TYPE, 2018-2032 (USD MILLION) 67
      26. TABLE 25 MEXICO BUSES AND COACHES MARKET ESTIMATES & FORECAST, BY PROPULSION, 2018-2032 (USD MILLION) 67
      27. TABLE 26 MEXICO BUSES AND COACHES MARKET ESTIMATES & FORECAST, BY SEAT CAPACITY, 2018-2032 (USD MILLION) 67
      28. TABLE 27 MEXICO BUSES AND COACHES MARKET ESTIMATES & FORECAST, BY APPLICATION, 2018-2032 (USD MILLION) 68
      29. TABLE 28 MEXICO BUSES AND COACHES MARKET ESTIMATES & FORECAST, BY SALES CHANNEL, 2018-2032 (USD MILLION) 68
      30. TABLE 29 EUROPE: BUSES AND COACHES MARKET SIZE, BY COUNTRY, 2018-2032 (USD MILLION) 69
      31. TABLE 30 EUROPE BUSES AND COACHES MARKET ESTIMATES & FORECAST, BY TYPE, 2018-2032 (USD MILLION) 70
      32. TABLE 31 EUROPE BUSES AND COACHES MARKET ESTIMATES & FORECAST, BY PROPULSION, 2018-2032 (USD MILLION) 70
      33. TABLE 32 EUROPE BUSES AND COACHES MARKET ESTIMATES & FORECAST, BY SEAT CAPACITY, 2018-2032 (USD MILLION) 70
      34. TABLE 33 EUROPE BUSES AND COACHES MARKET ESTIMATES & FORECAST, BY APPLICATION, 2018-2032 (USD MILLION) 71
      35. TABLE 34 EUROPE BUSES AND COACHES MARKET ESTIMATES & FORECAST, BY SALES CHANNEL, 2018-2032 (USD MILLION) 71
      36. TABLE 35 GERMANY BUSES AND COACHES MARKET ESTIMATES & FORECAST, BY TYPE, 2018-2032 (USD MILLION) 71
      37. TABLE 36 GERMANY BUSES AND COACHES MARKET ESTIMATES & FORECAST, BY PROPULSION, 2018-2032 (USD MILLION) 72
      38. TABLE 37 GERMANY BUSES AND COACHES MARKET ESTIMATES & FORECAST, BY SEAT CAPACITY, 2018-2032 (USD MILLION) 72
      39. TABLE 38 GERMANY BUSES AND COACHES MARKET ESTIMATES & FORECAST, BY APPLICATION, 2018-2032 (USD MILLION) 72
      40. TABLE 39 GERMANY BUSES AND COACHES MARKET ESTIMATES & FORECAST, BY SALES CHANNEL, 2018-2032 (USD MILLION) 73
      41. TABLE 40 FRANCE BUSES AND COACHES MARKET ESTIMATES & FORECAST, BY TYPE, 2018-2032 (USD MILLION) 73
      42. TABLE 41 FRANCE BUSES AND COACHES MARKET ESTIMATES & FORECAST, BY PROPULSION, 2018-2032 (USD MILLION) 73
      43. TABLE 42 FRANCE BUSES AND COACHES MARKET ESTIMATES & FORECAST, BY SEAT CAPACITY, 2018-2032 (USD MILLION) 74
      44. TABLE 43 FRANCE BUSES AND COACHES MARKET ESTIMATES & FORECAST, BY APPLICATION, 2018-2032 (USD MILLION) 74
      45. TABLE 44 FRANCE BUSES AND COACHES MARKET ESTIMATES & FORECAST, BY SALES CHANNEL, 2018-2032 (USD MILLION) 74
      46. TABLE 45 UK BUSES AND COACHES MARKET ESTIMATES & FORECAST, BY TYPE, 2018-2032 (USD MILLION) 75
      47. TABLE 46 UK BUSES AND COACHES MARKET ESTIMATES & FORECAST, BY PROPULSION, 2018-2032 (USD MILLION) 75
      48. TABLE 47 UK BUSES AND COACHES MARKET ESTIMATES & FORECAST, BY SEAT CAPACITY, 2018-2032 (USD MILLION) 75
      49. TABLE 48 UK BUSES AND COACHES MARKET ESTIMATES & FORECAST, BY APPLICATION, 2018-2032 (USD MILLION) 76
      50. TABLE 49 UK BUSES AND COACHES MARKET ESTIMATES & FORECAST, BY SALES CHANNEL, 2018-2032 (USD MILLION) 76
      51. TABLE 50 SPAIN BUSES AND COACHES MARKET ESTIMATES & FORECAST, BY TYPE, 2018-2032 (USD MILLION) 76
      52. TABLE 51 SPAIN BUSES AND COACHES MARKET ESTIMATES & FORECAST, BY PROPULSION, 2018-2032 (USD MILLION) 77
      53. TABLE 52 SPAIN BUSES AND COACHES MARKET ESTIMATES & FORECAST, BY SEAT CAPACITY, 2018-2032 (USD MILLION) 77
      54. TABLE 53 SPAIN BUSES AND COACHES MARKET ESTIMATES & FORECAST, BY APPLICATION, 2018-2032 (USD MILLION) 77
      55. TABLE 54 SPAIN BUSES AND COACHES MARKET ESTIMATES & FORECAST, BY SALES CHANNEL, 2018-2032 (USD MILLION) 78
      56. TABLE 55 ITALY BUSES AND COACHES MARKET ESTIMATES & FORECAST, BY TYPE, 2018-2032 (USD MILLION) 78
      57. TABLE 56 ITALY BUSES AND COACHES MARKET ESTIMATES & FORECAST, BY PROPULSION, 2018-2032 (USD MILLION) 78
      58. TABLE 57 ITALY BUSES AND COACHES MARKET ESTIMATES & FORECAST, BY SEAT CAPACITY, 2018-2032 (USD MILLION) 79
      59. TABLE 58 ITALY BUSES AND COACHES MARKET ESTIMATES & FORECAST, BY APPLICATION, 2018-2032 (USD MILLION) 79
      60. TABLE 59 ITALY BUSES AND COACHES MARKET ESTIMATES & FORECAST, BY SALES CHANNEL, 2018-2032 (USD MILLION) 79
      61. TABLE 60 POLAND BUSES AND COACHES MARKET ESTIMATES & FORECAST, BY TYPE, 2018-2032 (USD MILLION) 80
      62. TABLE 61 POLAND BUSES AND COACHES MARKET ESTIMATES & FORECAST, BY PROPULSION, 2018-2032 (USD MILLION) 80
      63. TABLE 62 POLAND BUSES AND COACHES MARKET ESTIMATES & FORECAST, BY SEAT CAPACITY, 2018-2032 (USD MILLION) 80
      64. TABLE 63 POLAND BUSES AND COACHES MARKET ESTIMATES & FORECAST, BY APPLICATION, 2018-2032 (USD MILLION) 81
      65. TABLE 64 POLAND BUSES AND COACHES MARKET ESTIMATES & FORECAST, BY SALES CHANNEL, 2018-2032 (USD MILLION) 81
      66. TABLE 65 CZECH REPUBLIC BUSES AND COACHES MARKET ESTIMATES & FORECAST, BY TYPE, 2018-2032 (USD MILLION) 81
      67. TABLE 66 CZECH REPUBLIC BUSES AND COACHES MARKET ESTIMATES & FORECAST, BY PROPULSION, 2018-2032 (USD MILLION) 82
      68. TABLE 67 CZECH REPUBLIC BUSES AND COACHES MARKET ESTIMATES & FORECAST, BY SEAT CAPACITY, 2018-2032 (USD MILLION) 82
      69. TABLE 68 CZECH REPUBLIC BUSES AND COACHES MARKET ESTIMATES & FORECAST, BY APPLICATION, 2018-2032 (USD MILLION) 82
      70. TABLE 69 CZECH REPUBLIC BUSES AND COACHES MARKET ESTIMATES & FORECAST, BY SALES CHANNEL, 2018-2032 (USD MILLION) 83
      71. TABLE 70 REST OF EUROPE BUSES AND COACHES MARKET ESTIMATES & FORECAST, BY TYPE, 2018-2032 (USD MILLION) 83
      72. TABLE 71 REST OF EUROPE BUSES AND COACHES MARKET ESTIMATES & FORECAST, BY PROPULSION, 2018-2032 (USD MILLION) 83
      73. TABLE 72 REST OF EUROPE BUSES AND COACHES MARKET ESTIMATES & FORECAST, BY SEAT CAPACITY, 2018-2032 (USD MILLION) 84
      74. TABLE 73 REST OF EUROPE BUSES AND COACHES MARKET ESTIMATES & FORECAST, BY APPLICATION, 2018-2032 (USD MILLION) 84
      75. TABLE 74 REST OF EUROPE BUSES AND COACHES MARKET ESTIMATES & FORECAST, BY SALES CHANNEL, 2018-2032 (USD MILLION) 84
      76. TABLE 75 ASIA-PACIFIC: BUSES AND COACHES MARKET SIZE, BY COUNTRY, 2018-2032 (USD MILLION) 86
      77. TABLE 76 ASIA-PACIFIC BUSES AND COACHES MARKET ESTIMATES & FORECAST, BY TYPE, 2018-2032 (USD MILLION) 86
      78. TABLE 77 ASIA-PACIFIC BUSES AND COACHES MARKET ESTIMATES & FORECAST, BY PROPULSION, 2018-2032 (USD MILLION) 86
      79. TABLE 78 ASIA-

    Buses and Coaches Market Segmentation

    • Global Buses and Coaches, By Type Outlook (USD Million, 2019-2032)
      • Single Deck
      • Double Deck
      • Low floor buses
      • Minibus
      • Coaches
      • Others
    • Global Buses and Coaches, By Propulsion Outlook (USD Million, 2019-2032)
      • ICE
      • Electric
    • Global Buses and Coaches, By Seat Capacity Outlook (USD Million, 2019-2032)
      • 15-30 Seats
      • 31-50 Seats
      • More than 50 Seats
    • Global Buses and Coaches Sales Channel Outlook (USD Million, 2019-2032)
      • OEM
      • Aftermarket
    • Global Buses and Coaches Application Outlook (USD Million, 2019-2032)
      • City Buses
      • Intercity Coaches
      • AIRPORT SHUTTLE
      • Delivery Van
      • School Buses
      • Fast DC Chargers (EV)
      • Overload Detection
      • Grid Infrastructure
      • Automotive Power Trains
      • Others
    • Global Buses and Coaches Regional Outlook (USD Million, 2019-2032)
    • North America Outlook (USD Million, 2019-2032)
    • North America Buses and Coaches, By Type Outlook (USD Million, 2019-2032)
      • Single Deck
      • Double Deck
      • Low floor buses
      • Minibus
      • Coaches
      • Others
    • North America Buses and Coaches, By Propulsion Outlook (USD Million, 2019-2032)
      • ICE
      • Electric
    • North America Buses and Coaches, By Seat Capacity Outlook (USD Million, 2019-2032)
      • 15-30 Seats
      • 31-50 Seats
      • More than 50 Seats
    • North America Buses and Coaches Sales Channel Outlook (USD Million, 2019-2032)
      • OEM
      • Aftermarket
    • North America Buses and Coaches Application Outlook (USD Million, 2019-2032)
      • City Buses
      • Intercity Coaches
      • Airport Shuttle
      • Delivery Van
      • School Buses
      • Fast DC Chargers (EV)
      • Overload Detection
      • Grid Infrastructure
      • Automotive Power Trains
      • Others
      • US Outlook (USD Million, 2019-2032)
      • US Buses and Coaches, By Type Outlook (USD Million, 2019-2032)
        • Single Deck
        • Double Deck
        • Low floor buses
        • Minibus
        • Coaches
        • Others
      • US Buses and Coaches, By Propulsion Outlook (USD Million, 2019-2032)
        • ICE
        • Electric
      • US Buses and Coaches, By Seat Capacity Outlook (USD Million, 2019-2032)
        • 15-30 Seats
        • 31-50 Seats
        • More than 50 Seats
      • US Buses and Coaches Sales Channel Outlook (USD Million, 2019-2032)
        • OEM
        • Aftermarket
      • US Buses and Coaches Application Outlook (USD Million, 2019-2032)
        • City Buses
        • Intercity Coaches
        • Airport Shuttle
        • Delivery Van
        • School Buses
        • Others
      • Canada Outlook (USD Million, 2019-2032)
      • Canada Buses and Coaches, By Type Outlook (USD Million, 2019-2032)
        • Single Deck
        • Double Deck
        • Low floor buses
        • Minibus
        • Coaches
        • Others
      • Canada Buses and Coaches, By Propulsion Outlook (USD Million, 2019-2032)
        • ICE
        • Electric
      • Canada Buses and Coaches, By Seat Capacity Outlook (USD Million, 2019-2032)
        • 15-30 Seats
        • 31-50 Seats
        • More than 50 Seats
      • Canada Buses and Coaches Sales Channel Outlook (USD Million, 2019-2032)
        • OEM
        • Aftermarket
      • Canada Buses and Coaches Application Outlook (USD Million, 2019-2032)
        • City Buses
        • Intercity Coaches
        • Airport Shuttle
        • Delivery Van
        • School Buses
        • Others
      • Mexico Outlook (USD Million, 2019-2032)
      • Mexico Buses and Coaches, By Type Outlook (USD Million, 2019-2032)
        • Single Deck
        • Double Deck
        • Low floor buses
        • Minibus
        • Coaches
        • Others
      • Mexico Buses and Coaches, By Propulsion Outlook (USD Million, 2019-2032)
        • ICE
        • Electric
      • Mexico Buses and Coaches, By Seat Capacity Outlook (USD Million, 2019-2032)
        • 15-30 Seats
        • 31-50 Seats
        • More than 50 Seats
      • Mexico Buses and Coaches Sales Channel Outlook (USD Million, 2019-2032)
        • OEM
        • Aftermarket
      • Mexico Buses and Coaches Application Outlook (USD Million, 2019-2032)
        • City Buses
        • Intercity Coaches
        • Airport Shuttle
        • Delivery Van
        • School Buses
        • Others
      • Europe Outlook (USD Million, 2019-2032)
      • Europe Buses and Coaches, By Type Outlook (USD Million, 2019-2032)
        • Single Deck
        • Double Deck
        • Low floor buses
        • Minibus
        • Coaches
        • Others
      • Europe Buses and Coaches, By Propulsion Outlook (USD Million, 2019-2032)
        • ICE
        • Electric
      • Europe Buses and Coaches, By Seat Capacity Outlook (USD Million, 2019-2032)
        • 15-30 Seats
        • 31-50 Seats
        • More than 50 Seats
      • Europe Buses and Coaches Sales Channel Outlook (USD Million, 2019-2032)
        • OEM
        • Aftermarket
      • Europe Buses and Coaches Application Outlook (USD Million, 2019-2032)
        • City Buses
        • Intercity Coaches
        • Airport Shuttle
        • Delivery Van
        • School Buses
        • Others
        • Germany Outlook (USD Million, 2019-2032)
        • Germany Buses and Coaches, By Type Outlook (USD Million, 2019-2032)
          • Single Deck
          • Double Deck
          • Low floor buses
          • Minibus
          • Coaches
          • Others

    Germany Buses and Coaches, By Propulsion Outlook (USD Million, 2019-2032)

    • ICE
    • Electric
    • Germany Buses and Coaches, By Seat Capacity Outlook (USD Million, 2019-2032)
      • 15-30 Seats
      • 31-50 Seats
      • More than 50 Seats
    • Germany Buses and Coaches Sales Channel Outlook (USD Million, 2019-2032)
      • OEM
      • Aftermarket
    • Germany Buses and Coaches Application Outlook (USD Million, 2019-2032)
      • City Buses
      • Intercity Coaches
      • Airport Shuttle
      • Delivery Van
      • School Buses
      • Others
    • France Outlook (USD Million, 2019-2032)
    • France Buses and Coaches, By Type Outlook (USD Million, 2019-2032)
      • Single Deck
      • Double Deck
      • Low floor buses
      • Minibus
      • Coaches
      • Others
    • France Buses and Coaches, By Propulsion Outlook (USD Million, 2019-2032)
      • ICE
      • Electric
    • France Buses and Coaches, By Seat Capacity Outlook (USD Million, 2019-2032)
      • 15-30 Seats
      • 31-50 Seats
      • More than 50 Seats
    • France Buses and Coaches Sales Channel Outlook (USD Million, 2019-2032)
      • OEM
      • Aftermarket
    • France Buses and Coaches Application Outlook (USD Million, 2019-2032)
      • City Buses
      • Intercity Coaches
      • Airport Shuttle
      • Delivery Van
      • School Buses
      • Others
    • UK Outlook (USD Million, 2019-2032)
    • UK Buses and Coaches, By Type Outlook (USD Million, 2019-2032)
      • Single Deck
      • Double Deck
      • Low floor buses
      • Minibus
      • Coaches
      • Others
    • UK Buses and Coaches, By Propulsion Outlook (USD Million, 2019-2032)
      • ICE
      • Electric
    • UK Buses and Coaches, By Seat Capacity Outlook (USD Million, 2019-2032)
      • 15-30 Seats
      • 31-50 Seats
      • More than 50 Seats
    • UK Buses and Coaches Sales Channel Outlook (USD Million, 2019-2032)
      • OEM
      • Aftermarket
    • UK Buses and Coaches Application Outlook (USD Million, 2019-2032)
      • City Buses
      • Intercity Coaches
      • Airport Shuttle
      • Delivery Van
      • School Buses
      • Others
    • Rest of Europe Outlook (USD Million, 2019-2032)
    • Rest of Europe Buses and Coaches, By Type Outlook (USD Million, 2019-2032)
      • Single Deck
      • Double Deck
      • Low floor buses
      • Minibus
      • Coaches
      • Others
    • Rest of Europe Buses and Coaches, By Propulsion Outlook (USD Million, 2019-2032)
      • ICE
      • Electric
    • Rest of Europe Buses and Coaches, By Seat Capacity Outlook (USD Million, 2019-2032)
      • 15-30 Seats
      • 31-50 Seats
      • More than 50 Seats
    • Rest of Europe Buses and Coaches Sales Channel Outlook (USD Million, 2019-2032)
      • OEM
      • Aftermarket
    • Rest of Europe Buses and Coaches Application Outlook (USD Million, 2019-2032)
      • City Buses
      • Intercity Coaches
      • Airport Shuttle
      • Delivery Van
      • School Buses
      • Others
    • Asia-Pacific Outlook (USD Million, 2019-2032)
    • Asia-Pacific Buses and Coaches, By Type Outlook (USD Million, 2019-2032)
      • Single Deck
      • Double Deck
      • Low floor buses
      • Minibus
      • Coaches
      • Others
    • Asia-Pacific Buses and Coaches, By Propulsion Outlook (USD Million, 2019-2032)
      • ICE
      • Electric
    • Asia-Pacific Buses and Coaches, By Seat Capacity Outlook (USD Million, 2019-2032)
      • 15-30 Seats
      • 31-50 Seats
      • More than 50 Seats
    • Asia-Pacific Buses and Coaches Sales Channel Outlook (USD Million, 2019-2032)
      • OEM
      • Aftermarket
    • Asia-Pacific Buses and Coaches Application Outlook (USD Million, 2019-2032)
      • City Buses
      • Intercity Coaches
      • Airport Shuttle
      • Delivery Van
      • School Buses
      • Others
      • China Outlook (USD Million, 2019-2032)
      • China Buses and Coaches, By Type Outlook (USD Million, 2019-2032)
        • Single Deck
        • Double Deck
        • Low floor buses
        • Minibus
        • Coaches
        • Others
      • China Buses and Coaches, By Propulsion Outlook (USD Million, 2019-2032)
        • ICE
        • Electric
      • China Buses and Coaches, By Seat Capacity Outlook (USD Million, 2019-2032)
        • 15-30 Seats
        • 31-50 Seats
        • More than 50 Seats
      • China Buses and Coaches Sales Channel Outlook (USD Million, 2019-2032)
        • OEM
        • Aftermarket
      • China Buses and Coaches Application Outlook (USD Million, 2019-2032)
        • City Buses
        • Intercity Coaches
        • Airport Shuttle
        • Delivery Van
        • School Buses
        • Others
      • India Outlook (USD Million, 2019-2032)
      • India Buses and Coaches, By Type Outlook (USD Million, 2019-2032)
        • Single Deck
        • Double Deck
        • Low floor buses
        • Minibus
        • Coaches
        • Others
      • India Buses and Coaches, By Propulsion Outlook (USD Million, 2019-2032)
        • ICE
        • Electric
      • India Buses and Coaches, By Seat Capacity Outlook (USD Million, 2019-2032)
        • 15-30 Seats
        • 31-50 Seats
        • More than 50 Seats
      • India Buses and Coaches Sales Channel Outlook (USD Million, 2019-2032)
        • OEM
        • Aftermarket
      • India Buses and Coaches Application Outlook (USD Million, 2019-2032)
        • City Buses
        • Intercity Coaches
        • Airport Shuttle
        • Delivery Van
        • School Buses
        • Others


    • Japan Outlook (USD Million, 2019-2032)
    • Japan Buses and Coaches, By Type Outlook (USD Million, 2019-2032)
      • Single Deck
      • Double Deck
      • Low floor buses
      • Minibus
      • Coaches
      • Others
    • Japan Buses and Coaches, By Propulsion Outlook (USD Million, 2019-2032)
      • ICE
      • Electric
    • Japan Buses and Coaches, By Seat Capacity Outlook (USD Million, 2019-2032)
      • 15-30 Seats
      • 31-50 Seats
      • More than 50 Seats
    • Japan Buses and Coaches Sales Channel Outlook (USD Million, 2019-2032)
      • OEM
      • Aftermarket
    • Japan Buses and Coaches Application Outlook (USD Million, 2019-2032)
      • City Buses
      • Intercity Coaches
      • Airport Shuttle
      • Delivery Van
      • School Buses
      • Others


    • Rest of Asia-Pacific Outlook (USD Million, 2019-2032)
    • Rest of Asia-Pacific Buses and Coaches, By Type Outlook (USD Million, 2019-2032)
      • Single Deck
      • Double Deck
      • Low floor buses
      • Minibus
      • Coaches
      • Others
    • Rest of Asia-Pacific Buses and Coaches, By Propulsion Outlook (USD Million, 2019-2032)
      • ICE
      • Electric
    • Rest of Asia-Pacific Buses and Coaches, By Seat Capacity Outlook (USD Million, 2019-2032)
      • 15-30 Seats
      • 31-50 Seats
      • More than 50 Seats
    • Rest of Asia-Pacific Buses and Coaches Sales Channel Outlook (USD Million, 2019-2032)
      • OEM
      • Aftermarket
    • Rest of Asia-Pacific Buses and Coaches Application Outlook (USD Million, 2019-2032)
      • City Buses
      • Intercity Coaches
      • Airport Shuttle
      • Delivery Van
      • School Buses
      • Others
    • Middle East & Africa Outlook (USD Million, 2019-2032)
    • Middle East & Africa Buses and Coaches, By Type Outlook (USD Million, 2019-2032)
      • Single Deck
      • Double Deck
      • Low floor buses
      • Minibus
      • Coaches
      • Others
    • Middle East & Africa Buses and Coaches, By Propulsion Outlook (USD Million, 2019-2032)
      • ICE
      • Electric
    • Middle East & Africa Buses and Coaches, By Seat Capacity Outlook (USD Million, 2019-2032)
      • 15-30 Seats
      • 31-50 Seats
      • More than 50 Seats
    • Middle East & Africa Buses and Coaches Sales Channel Outlook (USD Million, 2019-2032)
      • OEM
      • Aftermarket
    • Middle East & Africa Buses and Coaches Application Outlook (USD Million, 2019-2032)
      • City Buses
      • Intercity Coaches
      • Airport Shuttle
      • Delivery Van
      • School Buses
      • Others


    • GCC Countries Outlook (USD Million, 2019-2032)
    • GCC Countries Buses and Coaches, By Type Outlook (USD Million, 2019-2032)
      • Single Deck
      • Double Deck
      • Low floor buses
      • Minibus
      • Coaches
      • Others
    • GCC Countries Buses and Coaches, By Propulsion Outlook (USD Million, 2019-2032)
      • ICE
      • Electric
    • GCC Countries Buses and Coaches, By Seat Capacity Outlook (USD Million, 2019-2032)
      • 15-30 Seats
      • 31-50 Seats
      • More than 50 Seats
    • GCC Countries Buses and Coaches Sales Channel Outlook (USD Million, 2019-2032)
      • OEM
      • Aftermarket
    • GCC Countries Buses and Coaches Application Outlook (USD Million, 2019-2032)
      • City Buses
      • Intercity Coaches
      • Airport Shuttle
      • Delivery Van
      • School Buses
      • Others


    • South Africa Outlook (USD Million, 2019-2032)
    • South Africa Buses and Coaches, By Type Outlook (USD Million, 2019-2032)
      • Single Deck
      • Double Deck
      • Low floor buses
      • Minibus
      • Coaches
      • Others
    • South Africa Buses and Coaches, By Propulsion Outlook (USD Million, 2019-2032)
      • ICE
      • Electric
    • South Africa Buses and Coaches, By Seat Capacity Outlook (USD Million, 2019-2032)
      • 15-30 Seats
      • 31-50 Seats
      • More than 50 Seats
    • South Africa Buses and Coaches Sales Channel Outlook (USD Million, 2019-2032)
      • OEM
      • Aftermarket
    • South Africa Buses and Coaches Application Outlook (USD Million, 2019-2032)
      • City Buses
      • Intercity Coaches
      • Airport Shuttle
      • Delivery Van
      • School Buses
      • Others


    • Rest of Middle East & Africa Outlook (USD Million, 2019-2032)
    • Rest of Middle East & Africa Buses and Coaches, By Type Outlook (USD Million, 2019-2032)
      • Single Deck
      • Double Deck
      • Low floor buses
      • Minibus
      • Coaches
      • Others
    • Rest of Middle East & Africa Buses and Coaches, By Propulsion Outlook (USD Million, 2019-2032)
      • ICE
      • Electric
    • Rest of Middle East & Africa Buses and Coaches, By Seat Capacity Outlook (USD Million, 2019-2032)
      • 15-30 Seats
      • 31-50 Seats
      • More than 50 Seats
    • Rest of Middle East & Africa Buses and Coaches Sales Channel Outlook (USD Million, 2019-2032)
      • OEM
      • Aftermarket
    • Rest of Middle East & Africa Buses and Coaches Application Outlook (USD Million, 2019-2032)
      • City Buses
      • Intercity Coaches
      • Airport Shuttle
      • Delivery Van
      • School Buses
      • Others
    • South America Outlook (USD Million, 2019-2032)
    • South America Buses and Coaches, By Type Outlook (USD Million, 2019-2032)
      • Single Deck
      • Double Deck
      • Low floor buses
      • Minibus
      • Coaches
      • Others
    • South America Buses and Coaches, By Propulsion Outlook (USD Million, 2019-2032)
      • ICE
      • Electric
    • South America Buses and Coaches, By Seat Capacity Outlook (USD Million, 2019-2032)
      • 15-30 Seats
      • 31-50 Seats
      • More than 50 Seats
    • South America Buses and Coaches Sales Channel Outlook (USD Million, 2019-2032)
      • OEM
      • Aftermarket
    • South America Buses and Coaches Application Outlook (USD Million, 2019-2032)
      • City Buses
      • Intercity Coaches
      • Airport Shuttle
      • Delivery Van
      • School Buses
      • Others


    • Brazil Outlook (USD Million, 2019-2032)
    • Brazil Buses and Coaches, By Type Outlook (USD Million, 2019-2032)
      • Single Deck
      • Double Deck
      • Low floor buses
      • Minibus
      • Coaches
      • Others
    • Brazil Buses and Coaches, By Propulsion Outlook (USD Million, 2019-2032)
      • ICE
      • Electric
    • Brazil Buses and Coaches, By Seat Capacity Outlook (USD Million, 2019-2032)
      • 15-30 Seats
      • 31-50 Seats
      • More than 50 Seats
    • Brazil Buses and Coaches Sales Channel Outlook (USD Million, 2019-2032)
      • OEM
      • Aftermarket
    • Brazil Buses and Coaches Application Outlook (USD Million, 2019-2032)
      • City Buses
      • Intercity Coaches
      • Airport Shuttle
      • Delivery Van
      • School Buses
      • Others
    • Chile Outlook (USD Million, 2019-2032)
    • Chile Buses and Coaches, By Type Outlook (USD Million, 2019-2032)
      • Single Deck
      • Double Deck
      • Low floor buses
      • Minibus
      • Coaches
      • Others
    • Chile Buses and Coaches, By Propulsion Outlook (USD Million, 2019-2032)
      • ICE
      • Electric
    • Chile Buses and Coaches, By Seat Capacity Outlook (USD Million, 2019-2032)
      • 15-30 Seats
      • 31-50 Seats
      • More than 50 Seats
    • Chile Buses and Coaches Sales Channel Outlook (USD Million, 2019-2032)
      • OEM
      • Aftermarket
    • Chile Buses and Coaches Application Outlook (USD Million, 2019-2032)
      • City Buses
      • Intercity Coaches
      • Airport Shuttle
      • Delivery Van
      • School Buses
      • Others


    • Rest of South America Outlook (USD Million, 2019-2032)
    • Rest of South America Buses and Coaches, By Type Outlook (USD Million, 2019-2032)
      • Single Deck
      • Double Deck
      • Low floor buses
      • Minibus
      • Coaches
      • Others
    • Rest of South America Buses and Coaches, By Propulsion Outlook (USD Million, 2019-2032)
      • ICE
      • Electric
    • Rest of South America Buses and Coaches, By Seat Capacity Outlook (USD Million, 2019-2032)
      • 15-30 Seats
      • 31-50 Seats
      • More than 50 Seats
    • Rest of South America Buses and Coaches Sales Channel Outlook (USD Million, 2019-2032)
      • OEM
      • Aftermarket
    • Rest of South America Buses and Coaches Application Outlook (USD Million, 2019-2032)
      • City Buses
      • Intercity Coaches
      • Airport Shuttle
      • Delivery Van
      • School Buses
      • Others
    Infographic

    Free Sample Request

    Kindly complete the form below to receive a free sample of this Report

    Get Free Sample

    Customer Strories

    “I am very pleased with how market segments have been defined in a relevant way for my purposes (such as "Portable Freezers & refrigerators" and "last-mile"). In general the report is well structured. Thanks very much for your efforts.”

    Victoria Milne

    Founder
    Case Study
    Chemicals and Materials