×
Hero Background
English
Chinese
French
Japanese
Korean
German
Spanish

Business Travel Market Analysis

ID: MRFR/CG/14610-HCR
128 Pages
Pradeep Nandi
October 2025

Global Business Travel Market Research Report Information by Type (Managed Business Travel and Unmanaged Business Travel), by Purpose (Marketing, Internal Meetings, Trade Shows, Product Launch, and Others), by Expenditure (Marketing Travel Fare, Lodging, Dining, and Others), by Age Group (Travelers Below 40 Years and Travelers Above 40 Years ), by Traveler (Group Travel, Solo Travel, and Service), by Service (Food and Lodging and Recreation Activity), by Industry (Government and Corporate) And By Region (North America, Europe, Asia-Pacific, ... read more

Share:
Download PDF ×

We do not share your information with anyone. However, we may send you emails based on your report interest from time to time. You may contact us at any time to opt-out.

Business Travel Market Infographic
Purchase Options

Market Analysis

In-depth Analysis of Business Travel Market Industry Landscape

The business travel market is influenced by a variety of factors that collectively define its contours and determine its trajectory. One of the fundamental elements shaping this market is the overall economic environment. The state of the economy plays a pivotal role in influencing corporate decisions regarding business travel. During periods of economic growth and stability, companies tend to expand their operations, leading to increased business travel for meetings, conferences, and negotiations. Conversely, economic downturns may prompt organizations to tighten budgets, resulting in a reduction in business travel expenditures.

Technological advancements contribute significantly to the market factors in the business travel industry. The rise of virtual communication tools, video conferencing, and collaborative online platforms has altered the landscape of business interactions. While these technologies provide alternatives to physical travel, they also impact the demand for traditional business travel services. The balance between the convenience of virtual meetings and the importance of face-to-face interactions influences corporate travel decisions, contributing to the overall dynamics of the business travel market.

Geopolitical factors play a crucial role in shaping the business travel market. Political stability, diplomatic relations, and international conflicts can impact travel patterns and decision-making for companies with global operations. Changes in visa regulations, trade agreements, and geopolitical tensions may influence travel restrictions and preferences, creating a complex environment that businesses must navigate when planning their travel activities.

Corporate policies and practices are essential market factors in the business travel sector. Company policies regarding travel expenses, travel approvals, and travel management systems shape how organizations approach business travel. Increasingly, companies are adopting sustainable travel practices, considering the environmental impact of their travel activities. Travel policies that prioritize sustainability, cost-efficiency, and employee well-being contribute to the evolving dynamics of the business travel market.

The airline industry plays a central role in the business travel market, and factors such as airfare prices, flight availability, and airline alliances influence corporate travel decisions. The competitiveness of the airline industry, including the presence of low-cost carriers and the quality of services offered, impacts the overall cost of business travel. Additionally, global events, such as pandemics or natural disasters, can disrupt air travel and reshape the priorities and considerations of businesses regarding employee travel.

Accommodation options and the hospitality sector are critical market factors in business travel. The availability of hotels, conference facilities, and other lodging options impacts the decisions of companies when planning business trips. Quality, convenience, and cost-effectiveness of accommodation options influence the overall experience of business travelers and contribute to the attractiveness of specific destinations for corporate events and meetings.

Regulatory factors also shape the business travel market. Changes in visa requirements, health and safety regulations, and travel restrictions imposed by governments impact the feasibility and logistics of business travel. Companies must stay abreast of these regulations and adapt their travel plans accordingly, influencing the overall dynamics of the business travel market.

Market factors in the business travel industry are also influenced by societal trends and cultural considerations. The growing emphasis on work-life balance, flexible work arrangements, and employee well-being impact corporate attitudes towards business travel. Companies are increasingly mindful of the impact of frequent travel on employee health and job satisfaction, leading to a reassessment of travel policies and preferences for remote collaboration.

In conclusion, the business travel market is a multifaceted landscape shaped by economic conditions, technological advancements, geopolitical factors, corporate policies, airline industry dynamics, accommodation options, regulatory considerations, and societal trends. The interplay of these factors defines the contours of the business travel sector, reflecting the evolving needs and priorities of businesses as they navigate a complex and dynamic environment.

Author
Pradeep Nandi
Senior Research Analyst

I have a bachelor's degree in mechanical engineering and an MBA. I have more than two years of expertise in the retail, food, and beverage, chemical, and material industries, and hence have developed a sound cross-domain expertise. A firm believer in lifelong learning and sharing of knowledge. Having a proclivity for hatching ideas and trying to absorb as much information as possible in a short amount of time. Introducing corporates to the data and insight, which enables them to move from probability to possibility, has been my key areas of interest. 

Leave a Comment

FAQs

What is the current valuation of the Business Travel Market in 2025?

The Business Travel Market is valued at approximately 2.779 USD Billion in 2024.

Market Summary

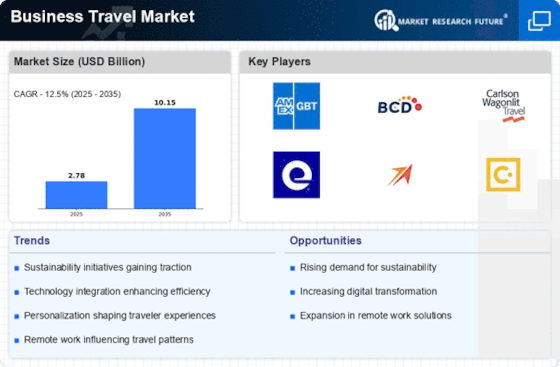
As per MRFR analysis, the Business Travel Market Size was estimated at 2.779 USD Billion in 2024. The Business Travel industry is projected to grow from 3.126 USD Billion in 2025 to 10.15 USD Billion by 2035, exhibiting a compound annual growth rate (CAGR) of 12.5 during the forecast period 2025 - 2035.

Key Market Trends & Highlights

The Business Travel Market is experiencing a dynamic shift towards sustainability and technological integration.

  • North America remains the largest market for business travel, driven by robust corporate profitability and a focus on employee well-being.
  • Asia-Pacific is emerging as the fastest-growing region, reflecting a surge in demand for both managed and unmanaged travel solutions.
  • Managed business travel continues to dominate the market, while unmanaged travel is rapidly gaining traction due to evolving corporate policies.
  • Key market drivers include rising corporate profitability and an increased emphasis on sustainability and corporate responsibility.

Market Size & Forecast

2024 Market Size 2.779 (USD Billion)
2035 Market Size 10.15 (USD Billion)
CAGR (2025 - 2035) 12.5%
Largest Regional Market Share in 2024 North America

Major Players

<p>American Express Global Business Travel (US), BCD Travel (NL), Carlson Wagonlit Travel (FR), Expedia Group (US), Travel Leaders Group (US), SAP Concur (US), Egencia (US), ATPI (GB), Frosch (US)</p>

Market Trends

The Business Travel Market is currently experiencing a dynamic evolution, influenced by various factors that shape corporate travel behaviors and preferences. Companies are increasingly prioritizing sustainability, leading to a growing demand for eco-friendly travel options. This shift reflects a broader societal trend towards environmental responsibility, as organizations seek to minimize their carbon footprints while conducting business. Additionally, advancements in technology are transforming the way travel is managed, with digital tools streamlining booking processes and enhancing traveler experiences. As remote work becomes more prevalent, the nature of business travel is also changing, with a focus on essential trips that foster collaboration and relationship-building. Moreover, the Business Travel Market is witnessing a rise in personalized travel experiences, as companies recognize the importance of catering to individual employee preferences. This trend suggests a move away from one-size-fits-all approaches, allowing for tailored itineraries that enhance satisfaction and productivity. Furthermore, the integration of health and safety measures remains a priority, as organizations aim to ensure the well-being of their employees during travel. Overall, the Business Travel Market appears poised for continued growth, driven by evolving corporate strategies and changing traveler expectations.

Sustainability Initiatives

The Business Travel Market is increasingly influenced by sustainability initiatives, as companies strive to adopt eco-friendly practices. This trend encompasses the selection of greener transportation options, accommodations that prioritize environmental responsibility, and the implementation of carbon offset programs. Organizations are recognizing the importance of aligning their travel policies with broader sustainability goals, which may enhance their corporate image and appeal to environmentally conscious clients.

Technological Advancements

Technological advancements are reshaping the Business Travel Market, with digital tools enhancing the efficiency of travel management. Innovations such as mobile applications, artificial intelligence, and data analytics are streamlining booking processes and improving traveler experiences. These technologies facilitate real-time communication and provide valuable insights, enabling companies to optimize their travel strategies and respond swiftly to changing circumstances.

Personalized Travel Experiences

The demand for personalized travel experiences is on the rise within the Business Travel Market. Companies are increasingly recognizing the value of catering to individual preferences, allowing employees to customize their itineraries. This trend reflects a shift towards enhancing traveler satisfaction and productivity, as organizations seek to create a more engaging and fulfilling travel experience that aligns with the unique needs of their workforce.

Business Travel Market Market Drivers

Expansion of Emerging Markets

The Business Travel Market is significantly influenced by the expansion of emerging markets, which are increasingly becoming vital players in the global economy. Countries in Asia, Africa, and Latin America are witnessing rapid economic growth, leading to a surge in business activities. This growth is accompanied by an increase in travel requirements for meetings, conferences, and trade shows. For instance, the International Monetary Fund has projected that emerging markets will contribute over 60% of global GDP growth in the coming years. As businesses seek to establish a presence in these regions, the demand for business travel services is expected to rise. This trend not only enhances the Business Travel Market but also encourages the development of infrastructure and services tailored to meet the needs of international travelers.

Rising Corporate Profitability

The Business Travel Market appears to be buoyed by the increasing profitability of corporations across various sectors. As companies report higher earnings, they are more inclined to invest in travel for their employees. This trend is particularly evident in sectors such as technology and finance, where travel is often essential for client meetings and networking opportunities. According to recent data, corporate travel spending is projected to grow at a compound annual growth rate of 5.5% over the next five years. This growth indicates a robust demand for business travel services, as organizations prioritize face-to-face interactions to foster relationships and drive sales. Consequently, the Business Travel Market is likely to experience a surge in demand, as companies seek to capitalize on new opportunities and expand their market reach.

Increased Focus on Employee Well-being

The Business Travel Market is increasingly shaped by a heightened focus on employee well-being and work-life balance. Companies are recognizing the importance of ensuring that their employees are not only productive but also satisfied with their travel experiences. This shift is leading to the adoption of more flexible travel policies, which may include options for leisure travel combined with business trips. According to recent surveys, nearly 70% of employees express a preference for companies that prioritize their well-being during business travel. As organizations strive to attract and retain top talent, the Business Travel Market is likely to adapt by offering more personalized and employee-centric travel solutions, thereby enhancing overall satisfaction and productivity.

Sustainability and Corporate Responsibility

The Business Travel Market is increasingly influenced by the growing emphasis on sustainability and corporate responsibility. Companies are becoming more aware of their environmental impact and are seeking to implement sustainable travel practices. This includes opting for eco-friendly accommodations, reducing carbon footprints, and supporting local economies. Recent studies suggest that nearly 60% of business travelers prefer companies that demonstrate a commitment to sustainability. As organizations strive to align their travel policies with corporate social responsibility goals, the Business Travel Market is likely to see a shift towards greener travel options. This trend not only enhances brand reputation but also attracts environmentally conscious clients and partners.

Technological Integration in Travel Management

The Business Travel Market is undergoing a transformation due to the integration of advanced technologies in travel management. Companies are increasingly adopting travel management software and mobile applications to streamline booking processes and enhance traveler experiences. This technological shift not only improves efficiency but also provides valuable data analytics that can inform travel policies and spending. Recent statistics indicate that organizations utilizing travel management tools can reduce travel costs by up to 20%. As technology continues to evolve, the Business Travel Market is expected to embrace innovations such as artificial intelligence and machine learning, which could further optimize travel planning and enhance decision-making processes.

Market Segment Insights

By Type: Managed Business Travel Market (Largest) vs. Unmanaged Business Travel Market (Fastest-Growing)

<p>In the Business Travel Market, Managed Business Travel Market holds the largest share due to the increasing preference of corporations to control travel expenses and ensure compliance with travel policies. Companies are leveraging managed travel services to optimize their travel programs, offering structured travel solutions that enhance accountability and cost-efficiency. The trend towards managed travel is further propelled by the growth of technology in travel management, providing greater visibility and control over travel spending. On the other hand, Unmanaged Business Travel Market is emerging as the fastest-growing segment, driven by the rise of remote work and the increasing desire for flexibility among business travelers. More professionals are choosing the unmanaged route, prioritizing personal convenience over corporate guidelines. The proliferation of online booking platforms and alternative accommodations is also making unmanaged travel more accessible, appealing to a broader range of business travelers seeking tailored travel experiences.</p>

<p>Managed Business Travel Market (Dominant) vs. Unmanaged Business Travel Market (Emerging)</p>

<p>Managed Business Travel Market is characterized by a systematic approach that organizations use to oversee employee travel. This segment's dominance arises from its focus on policy compliance, cost control, and traveler safety. Companies are investing in technology-driven solutions to enhance their travel management processes, resulting in improved visibility into travel expenses and behaviors. In contrast, Unmanaged Business Travel Market is taking center stage as an emerging option for more flexible travel arrangements. Business professionals who prefer spontaneity are increasingly drawn to this segment, often utilizing various platforms for booking travel independently. The accessibility and personalization offered by unmanaged travel are driving its growth, allowing travelers to tailor their experiences based on personal preferences and needs.</p>

By Purpose: Internal Meetings (Largest) vs. Marketing (Fastest-Growing)

<p>In the Business Travel Market, Internal Meetings hold the largest market share, reflecting the fundamental need for organizations to facilitate collaboration among teams and stakeholders. Trade Shows and Product Launches follow closely, driven by the necessity to showcase products and network with potential partners. Meanwhile, Marketing activities in business travel are gaining momentum, highlighting a growing effort by companies to establish brand presence and build relationships through direct interaction.</p>

<p>Internal Meetings: Dominant vs. Marketing: Emerging</p>

<p>Internal Meetings continue to dominate the Business Travel Market due to their critical role in maintaining effective communication within organizations. They are characterized by regular, planned gatherings that contribute significantly to strategic discussions and decision-making processes. In contrast, Marketing is emerging as a key player, focusing on experiential and relationship-driven strategies that enhance brand visibility. This trend is fueled by increasing recognition of the effectiveness of face-to-face interactions in building customer loyalty and engaging prospective clients. As companies prioritize both internal collaboration and external branding efforts, the marketing purpose of business travel is likely to expand, with innovative approaches shaping how organizations connect with their audiences.</p>

By Expenditure: Lodging (Largest) vs. Dining (Fastest-Growing)

<p>In the Business Travel Market, expenditures are primarily divided among marketing travel fares, lodging, dining, and others. Lodging stands as the largest expenditure category, owing to essential stays required for business trips across various sectors. The demand for quality accommodations has solidified its significant share, with companies prioritizing comfort for their traveling employees. Meanwhile, dining expenses are rapidly surging, driven by the growing trend of business meals and networking events. This segment has been increasingly recognized as vital for fostering client relationships and enhancing business dealings. The growth trends in the expenditure segment are influenced by evolving corporate travel policies and the rising importance of employee satisfaction. As businesses adapt to a post-pandemic environment, there is a marked shift towards investing in premium lodging options to enhance employee experiences. Additionally, the dining segment is witnessing an upward trend, prompted by the increasing frequency of formal dining occasions, corporate events, and the desire for quality culinary experiences in travel. These trends indicate a promising trajectory for expenditures in both lodging and dining categories within the business travel sector.</p>

<p>Lodging: Dominant vs. Dining: Emerging</p>

<p>Lodging emerges as the dominant segment in the Business Travel Market, characterized by its critical role in ensuring employee comfort and productivity during travel. Companies are increasingly recognizing the importance of providing quality lodging to facilitate accessible meetings and enhance overall travel experiences. In contrast, dining is an emerging segment gaining traction as businesses prioritize networking and relationship-building opportunities during meals. This segment is evolving with a focus on culinary quality and service excellence in restaurants suitable for business engagements. The shift towards experiential dining reflects a broader trend of enriching business travel experiences while catering to the needs of modern corporate travelers.</p>

By Age Group: Travelers Below 40 Years (Largest) vs. Travelers Above 40 Years (Fastest-Growing)

<p>In the Business Travel Market, the segment of Travelers Below 40 Years commands the largest share, reflecting the preferences of younger professionals who prioritize flexibility and technology in their travel arrangements. This demographic tends to be more adventurous and willing to explore new destinations, leading to a significant portion of business travel attributed to this age group. Conversely, Travelers Above 40 Years are emerging as the fastest-growing segment, driven by their increased participation in business activities, often bringing experience and established networks that are beneficial for organizations.</p>

<p>Travelers Below 40 Years (Dominant) vs. Travelers Above 40 Years (Emerging)</p>

<p>Travelers Below 40 Years are characterized by their tech-savvy nature and preference for digital booking platforms, making them a dominant force in the Business Travel Market. They tend to favor experiential travel opportunities, opting for unique accommodations and dynamic itineraries. On the other hand, Travelers Above 40 Years are seen as an emerging force, increasingly venturing into business travel as their career paths evolve. This segment typically exhibits loyalty to travel brands and emphasizes comfort and efficiency in their travel planning. As companies recognize the value of leveraging the expertise of seasoned professionals, this group's market presence is expected to continue growing steadily.</p>

By Traveler: Group Travel (Largest) vs. Solo Travel (Fastest-Growing)

<p>In the Business Travel Market, the segment distribution reveals that Group Travel holds a significant portion of the market, characterized by corporate events, conventions, and team-building activities. The advent of innovative travel solutions has solidified its prominent standing, catering to organizations looking to enhance collaboration among teams through shared travel experiences. Conversely, the Solo Travel segment is rapidly gaining traction, fueled by the increasing preference for personalized travel for business professionals. More individuals are opting for tailored experiences that allow them to focus on unique objectives during their trips, contributing to its accelerated growth.</p>

<p>Group Travel (Dominant) vs. Solo Travel (Emerging)</p>

<p>Group Travel remains the dominant force within the Business Travel Market, offering tailored packages for corporations seeking to enhance teamwork and efficiency through collective journeys. Often organized around events, conferences, or retreats, this segment caters to businesses aiming to foster collaboration and networking among employees. On the other hand, Solo Travel has emerged as a burgeoning trend, with more professionals choosing individualized travel experiences that align closely with personal and organizational objectives. This shift is driven by the desire for flexibility and autonomy, as many business travelers prioritize convenience and focused itineraries, which accommodate their specific needs, making Solo Travel a noteworthy competitor in the market.</p>

By Service: Food and Lodging (Largest) vs. Recreation Activities (Fastest-Growing)

<p>In the Business Travel Market, the service segment is primarily dominated by Food and Lodging, which holds the largest share. This segment includes expenses related to accommodation, meals, and related services that are essential for business travelers. In contrast, Recreation Activities, though smaller in comparison, are gaining traction as more business travelers seek leisure and balance during their trips. This shift reflects a growing trend towards enhanced travel experiences, where work and leisure coexist harmoniously.</p>

<p>Food and Lodging: Dominant vs. Recreation Activities: Emerging</p>

<p>Food and Lodging serves as the cornerstone of the Business Travel Market, playing a crucial role in the overall travel experience. As more companies recognize the importance of providing quality accommodations and meal options to employees, this segment remains dominant. On the other hand, Recreation Activities are emerging strongly as a complementary offering, with business travelers increasingly participating in team-building and leisure activities to recharge during trips. This segment's growth is fueled by evolving corporate travel policies that encourage work-life balance, as well as the demand for unique experiences that enhance employee satisfaction and engagement.</p>

By Industry: Corporate (Largest) vs. Government (Fastest-Growing)

<p>In the Business Travel Market, the industry segment is primarily dominated by corporate travel, which constitutes a significant portion of the overall market. Corporate travel accounts for the majority share, largely driven by the necessity of businesses to regularly engage with clients, attend conferences, and maintain operations in different locations. In comparison, government travel is also noteworthy but represents a smaller share, though it has been steadily increasing due to more governmental engagements and travel mandates.</p>

<p>Corporate: Dominant vs. Government: Emerging</p>

<p>Corporate travel is characterized by frequent trips made by employees for business purposes, including meetings, training, and conferences. This segment is supported by robust reimbursement policies and the necessity for businesses to establish and maintain partnerships and customer relationships. On the other hand, government travel is emerging rapidly, primarily driven by increased funding for government programs and initiatives that require travel. This segment is characterized by budget constraints and specific guidelines for travel, making it distinct. As governmental operations expand and focus on outreach, the demand for government travel will likely continue to rise.</p>

Get more detailed insights about Business Travel Market Research - Global Forecast to 2035

Regional Insights

By region, the study provides market insights into North America, Europe, Asia-Pacific, and Rest of the World. North America dominates due to its economic power, with a high concentration of multinational corporations and a robust business environment. The region's advanced infrastructure, technological innovation, and a large number of corporate headquarters make it a hub for business activities, driving significant demand for business travel services.

Further, the major countries studied in the market report are The US, Canada, Germany, France, the UK, Italy, Spain, China, Japan, India, Australia, South Korea, and Brazil.

Figure 2: Global Business Travel Market Share By Region 2022 (USD Billion)

Global Business Travel Market Share By Region 2022

Secondary Research, Primary Research, MRFR Database and Analyst Review

Europe’s Business Travel Market accounts for the second-largest market share due to its strong economic ties, extensive business networks, and historical significance as a global business center. Further, the German market held the largest market share, and the UK Business Travel Market was the fastest-growing market in the European region

The Asia-Pacific Market is expected to grow at the fastest CAGR from 2023 to 2032. This is due to rapid economic growth, emerging markets, and a surge in business opportunities. The region's dynamic business landscape, increasing foreign investments, and a growing number of business events position it as a key player in the market. Moreover, China’s Business Travel Market held the largest market share, and the Indian Business Travel Market was the fastest-growing market in the Asia-Pacific region.

Key Players and Competitive Insights

Leading market players are leveraging advanced technologies, such as travel management platforms, mobile apps, and AI-driven solutions, to streamline booking processes, enhance traveler experience, and provide real-time updates. Market participants are also adopting a variety of strategic activities to expand their global presence, with important market developments including new product launches, contractual agreements, mergers and acquisitions, personalization of Services, integration of technology, higher investments, and collaboration with other organizations. To expand and survive in a more competitive and rising market climate, the Business Travel industry must offer comprehensive service solutions.

Utilizing data analytics to gather insights into traveler behavior, preferences, and spending patterns helps companies tailor their services is one of the key business tactics used by manufacturers in the global Business Travel industry to increase their market share. In recent years, the Business Travel industry has offered some of the most significant advantages to Consumers.

Major players in the Business Travel Market, including ADEKA CORPORATION Airbnb, Inc., Expedia, Inc., Fareportal, Flight Centre Travel Group Limited, Wexas Travel, Hogg Robinson Ltd, Priceline, American Express Company, and others, are attempting to increase market demand by investing in product development to increase their product line and cater to diverse consumer needs.

Started in 1975 by John Fentener van Vlissingen, BCD Group is now a big name in travel. It has two parts, BCD Travel, and Park ‘N Fly, offering travel services and technology to lots of customers every day. Even though it began with just $10,000, BCD Group has grown a ton, going from a small business to a major player in the travel industry. They focus on being excellent, innovative, and making customers happy, making them a trusted leader in travel.

In February 2023, BCD Travel expanded its agreement with Amadeus as the forward-thinking travel management company (TMC) refined its global technology approach to capitalize on opportunities in the new era of business travel.

Founded as a global leader in business travel management services, Corporate Travel Management (CTM) is dedicated to enhancing savings, efficiency, safety, and sustainability for businesses and their travelers worldwide. Choosing CTM means experiencing a distinctive approach to global travel – a bespoke program crafted collaboratively and consistently delivered with expertise across every region of operation. CTM specializes in designing travel programs that yield strategic outcomes for all facets of a business and every team member, ensuring a tailored and impactful travel experience across all operational regions.

In December 2022, CWT Global B.V. expanded its global partnership with Paramount Global, a multinational media and entertainment conglomerate. This move involved managing Paramount's expanded travel business.

Key Companies in the Business Travel Market market include

Industry Developments

Ovation Travel Group

January, 2025: Ovation Travel Group announced a new partnership with a leading technology provider to enhance their travel management solutions. This collaboration aims to streamline booking processes and improve client experiences.

February, 2025: The company reported a 20% increase in corporate travel bookings compared to the previous year, citing a strong rebound in business travel demand.

Travel Leaders Group

January, 2025: Travel Leaders Group introduced a new mobile app designed for corporate travelers, featuring real-time updates, itinerary management, and travel alerts.

February, 2025: The group reported that 75% of their corporate clients have resumed pre-pandemic travel levels, highlighting a significant recovery in the business travel sector.

In June 2023, Priceline and Google Cloud announced a partnership to enhance the experience of booking for travelers with artificial intelligence chatbot technology. Using Google’s generative AI, the partnership permits future travelers to chat with a bot at the planning stage. On top of the existing chatbot features, Priceline will also add a map view of hotel details pages powered by Google Cloud Vertex AI in the near future. This will help users with customized neighborhood analytics, which will include points of interest, restaurants, and events around the area.

In November 2023, Flight Centre Travel Group (FCTG), a leading international company in travel management, announced that it had established an ‘AI Centre of Excellence’. This new global division is committed to the development, adoption and integration of AI technology within the corporate divisions of FCTG. The ‘AI Centre of Excellence’ has as its main focus the deployment of AI so that there is an improvement that will change the dynamics of FCTG's major business travel operations, FCM, and Corporate Traveller.

The goal of the deployment of AI is to improve customer experiences and the performance of employees and foster innovation in the organization.

July 2022: Corporate Travel Management Limited completed the acquisition of 1000 Mile Travel Group Ltd. The aim was to broaden its involvement in the market using the independent consultant model.

July 2022: BCD Group (BCD Travel) forged a partnership with Airbus, an aerospace products manufacturing company. The collaboration was geared towards serving four European home markets, namely France, Germany, Spain, and the UK.

Future Outlook

Business Travel Market Future Outlook

<p>The Business Travel Market is projected to grow at a 12.5% CAGR from 2024 to 2035, driven by technological advancements, increased globalization, and evolving corporate travel policies.</p>

New opportunities lie in:

  • <p>Integration of AI-driven travel management platforms</p>
  • <p>Expansion of sustainable travel options for corporate clients</p>
  • <p>Development of personalized travel experiences through data analytics</p>

<p>By 2035, the Business Travel Market is expected to be robust, reflecting dynamic growth and innovation.</p>

Market Segmentation

Business Travel Market Type Outlook

  • Managed Business Travel
  • Unmanaged Business Travel

Business Travel Market Purpose Outlook

  • Marketing
  • Internal Meetings
  • Trade Shows
  • Product Launch
  • Others

Business Travel Market Service Outlook

  • Food and Lodging
  • Recreation Activities

Business Travel Market Industry Outlook

  • Government
  • Corporate

Business Travel Market Traveler Outlook

  • Group Travel
  • Solo Travel
  • Service

Business Travel Market Age Group Outlook

  • Travelers Below 40 Years
  • Travelers Above 40 Years

Business Travel Market Expenditure Outlook

  • Marketing Travel Fare
  • Lodging
  • Dining
  • Others

Report Scope

MARKET SIZE 20242.779(USD Billion)
MARKET SIZE 20253.126(USD Billion)
MARKET SIZE 203510.15(USD Billion)
COMPOUND ANNUAL GROWTH RATE (CAGR)12.5% (2024 - 2035)
REPORT COVERAGERevenue Forecast, Competitive Landscape, Growth Factors, and Trends
BASE YEAR2024
Market Forecast Period2025 - 2035
Historical Data2019 - 2024
Market Forecast UnitsUSD Billion
Key Companies ProfiledMarket analysis in progress
Segments CoveredMarket segmentation analysis in progress
Key Market OpportunitiesIntegration of advanced digital solutions enhances efficiency in the Business Travel Market.
Key Market DynamicsRising demand for sustainable travel options drives innovation and competition in the Business Travel Market.
Countries CoveredNorth America, Europe, APAC, South America, MEA

FAQs

What is the current valuation of the Business Travel Market in 2025?

The Business Travel Market is valued at approximately 2.779 USD Billion in 2024.

  1. SECTION I: EXECUTIVE SUMMARY AND KEY HIGHLIGHTS
    1. EXECUTIVE SUMMARY
      1. Market Overview
      2. Key Findings
      3. Market Segmentation
      4. Competitive Landscape
      5. Challenges and Opportunities
      6. Future Outlook
  2. SECTION II: SCOPING, METHODOLOGY AND MARKET STRUCTURE
    1. MARKET INTRODUCTION
      1. Definition
      2. Scope of the study
    2. RESEARCH METHODOLOGY
      1. Overview
      2. Data Mining
      3. Secondary Research
      4. Primary Research
      5. Forecasting Model
      6. Market Size Estimation
      7. Data Triangulation
      8. Validation
  3. SECTION III: QUALITATIVE ANALYSIS
    1. MARKET DYNAMICS
      1. Overview
      2. Drivers
      3. Restraints
      4. Opportunities
    2. MARKET FACTOR ANALYSIS
      1. Value chain Analysis
      2. Porter's Five Forces Analysis
      3. COVID-19 Impact Analysis
  4. SECTION IV: QUANTITATIVE ANALYSIS
    1. Automobile, BY Type (USD Billion)
      1. Managed Business Travel
      2. Unmanaged Business Travel
    2. Automobile, BY Purpose (USD Billion)
      1. Marketing
      2. Internal Meetings
      3. Trade Shows
      4. Product Launch
      5. Others
    3. Automobile, BY Expenditure (USD Billion)
      1. Marketing Travel Fare
      2. Lodging
      3. Dining
      4. Others
    4. Automobile, BY Age Group (USD Billion)
      1. Travelers Below 40 Years
      2. Travelers Above 40 Years
    5. Automobile, BY Traveler (USD Billion)
      1. Group Travel
      2. Solo Travel
      3. Service
    6. Automobile, BY Service (USD Billion)
      1. Food and Lodging
      2. Recreation Activities
    7. Automobile, BY Industry (USD Billion)
      1. Government
      2. Corporate
    8. Automobile, BY Region (USD Billion)
      1. North America
      2. Europe
      3. APAC
      4. South America
      5. MEA
  5. SECTION V: COMPETITIVE ANALYSIS
    1. Competitive Landscape
      1. Overview
      2. Competitive Analysis
      3. Market share Analysis
      4. Major Growth Strategy in the Automobile
      5. Competitive Benchmarking
      6. Leading Players in Terms of Number of Developments in the Automobile
      7. Key developments and growth strategies
      8. Major Players Financial Matrix
    2. Company Profiles
      1. American Express Global Business Travel (US)
      2. BCD Travel (NL)
      3. Carlson Wagonlit Travel (FR)
      4. Expedia Group (US)
      5. Travel Leaders Group (US)
      6. SAP Concur (US)
      7. Egencia (US)
      8. ATPI (GB)
      9. Frosch (US)
    3. Appendix
      1. References
      2. Related Reports
  6. LIST OF FIGURES
    1. MARKET SYNOPSIS
    2. NORTH AMERICA MARKET ANALYSIS
    3. US MARKET ANALYSIS BY TYPE
    4. US MARKET ANALYSIS BY PURPOSE
    5. US MARKET ANALYSIS BY EXPENDITURE
    6. US MARKET ANALYSIS BY AGE GROUP
    7. US MARKET ANALYSIS BY TRAVELER
    8. US MARKET ANALYSIS BY SERVICE
    9. US MARKET ANALYSIS BY INDUSTRY
    10. CANADA MARKET ANALYSIS BY TYPE
    11. CANADA MARKET ANALYSIS BY PURPOSE
    12. CANADA MARKET ANALYSIS BY EXPENDITURE
    13. CANADA MARKET ANALYSIS BY AGE GROUP
    14. CANADA MARKET ANALYSIS BY TRAVELER
    15. CANADA MARKET ANALYSIS BY SERVICE
    16. CANADA MARKET ANALYSIS BY INDUSTRY
    17. EUROPE MARKET ANALYSIS
    18. GERMANY MARKET ANALYSIS BY TYPE
    19. GERMANY MARKET ANALYSIS BY PURPOSE
    20. GERMANY MARKET ANALYSIS BY EXPENDITURE
    21. GERMANY MARKET ANALYSIS BY AGE GROUP
    22. GERMANY MARKET ANALYSIS BY TRAVELER
    23. GERMANY MARKET ANALYSIS BY SERVICE
    24. GERMANY MARKET ANALYSIS BY INDUSTRY
    25. UK MARKET ANALYSIS BY TYPE
    26. UK MARKET ANALYSIS BY PURPOSE
    27. UK MARKET ANALYSIS BY EXPENDITURE
    28. UK MARKET ANALYSIS BY AGE GROUP
    29. UK MARKET ANALYSIS BY TRAVELER
    30. UK MARKET ANALYSIS BY SERVICE
    31. UK MARKET ANALYSIS BY INDUSTRY
    32. FRANCE MARKET ANALYSIS BY TYPE
    33. FRANCE MARKET ANALYSIS BY PURPOSE
    34. FRANCE MARKET ANALYSIS BY EXPENDITURE
    35. FRANCE MARKET ANALYSIS BY AGE GROUP
    36. FRANCE MARKET ANALYSIS BY TRAVELER
    37. FRANCE MARKET ANALYSIS BY SERVICE
    38. FRANCE MARKET ANALYSIS BY INDUSTRY
    39. RUSSIA MARKET ANALYSIS BY TYPE
    40. RUSSIA MARKET ANALYSIS BY PURPOSE
    41. RUSSIA MARKET ANALYSIS BY EXPENDITURE
    42. RUSSIA MARKET ANALYSIS BY AGE GROUP
    43. RUSSIA MARKET ANALYSIS BY TRAVELER
    44. RUSSIA MARKET ANALYSIS BY SERVICE
    45. RUSSIA MARKET ANALYSIS BY INDUSTRY
    46. ITALY MARKET ANALYSIS BY TYPE
    47. ITALY MARKET ANALYSIS BY PURPOSE
    48. ITALY MARKET ANALYSIS BY EXPENDITURE
    49. ITALY MARKET ANALYSIS BY AGE GROUP
    50. ITALY MARKET ANALYSIS BY TRAVELER
    51. ITALY MARKET ANALYSIS BY SERVICE
    52. ITALY MARKET ANALYSIS BY INDUSTRY
    53. SPAIN MARKET ANALYSIS BY TYPE
    54. SPAIN MARKET ANALYSIS BY PURPOSE
    55. SPAIN MARKET ANALYSIS BY EXPENDITURE
    56. SPAIN MARKET ANALYSIS BY AGE GROUP
    57. SPAIN MARKET ANALYSIS BY TRAVELER
    58. SPAIN MARKET ANALYSIS BY SERVICE
    59. SPAIN MARKET ANALYSIS BY INDUSTRY
    60. REST OF EUROPE MARKET ANALYSIS BY TYPE
    61. REST OF EUROPE MARKET ANALYSIS BY PURPOSE
    62. REST OF EUROPE MARKET ANALYSIS BY EXPENDITURE
    63. REST OF EUROPE MARKET ANALYSIS BY AGE GROUP
    64. REST OF EUROPE MARKET ANALYSIS BY TRAVELER
    65. REST OF EUROPE MARKET ANALYSIS BY SERVICE
    66. REST OF EUROPE MARKET ANALYSIS BY INDUSTRY
    67. APAC MARKET ANALYSIS
    68. CHINA MARKET ANALYSIS BY TYPE
    69. CHINA MARKET ANALYSIS BY PURPOSE
    70. CHINA MARKET ANALYSIS BY EXPENDITURE
    71. CHINA MARKET ANALYSIS BY AGE GROUP
    72. CHINA MARKET ANALYSIS BY TRAVELER
    73. CHINA MARKET ANALYSIS BY SERVICE
    74. CHINA MARKET ANALYSIS BY INDUSTRY
    75. INDIA MARKET ANALYSIS BY TYPE
    76. INDIA MARKET ANALYSIS BY PURPOSE
    77. INDIA MARKET ANALYSIS BY EXPENDITURE
    78. INDIA MARKET ANALYSIS BY AGE GROUP
    79. INDIA MARKET ANALYSIS BY TRAVELER
    80. INDIA MARKET ANALYSIS BY SERVICE
    81. INDIA MARKET ANALYSIS BY INDUSTRY
    82. JAPAN MARKET ANALYSIS BY TYPE
    83. JAPAN MARKET ANALYSIS BY PURPOSE
    84. JAPAN MARKET ANALYSIS BY EXPENDITURE
    85. JAPAN MARKET ANALYSIS BY AGE GROUP
    86. JAPAN MARKET ANALYSIS BY TRAVELER
    87. JAPAN MARKET ANALYSIS BY SERVICE
    88. JAPAN MARKET ANALYSIS BY INDUSTRY
    89. SOUTH KOREA MARKET ANALYSIS BY TYPE
    90. SOUTH KOREA MARKET ANALYSIS BY PURPOSE
    91. SOUTH KOREA MARKET ANALYSIS BY EXPENDITURE
    92. SOUTH KOREA MARKET ANALYSIS BY AGE GROUP
    93. SOUTH KOREA MARKET ANALYSIS BY TRAVELER
    94. SOUTH KOREA MARKET ANALYSIS BY SERVICE
    95. SOUTH KOREA MARKET ANALYSIS BY INDUSTRY
    96. MALAYSIA MARKET ANALYSIS BY TYPE
    97. MALAYSIA MARKET ANALYSIS BY PURPOSE
    98. MALAYSIA MARKET ANALYSIS BY EXPENDITURE
    99. MALAYSIA MARKET ANALYSIS BY AGE GROUP
    100. MALAYSIA MARKET ANALYSIS BY TRAVELER
    101. MALAYSIA MARKET ANALYSIS BY SERVICE
    102. MALAYSIA MARKET ANALYSIS BY INDUSTRY
    103. THAILAND MARKET ANALYSIS BY TYPE
    104. THAILAND MARKET ANALYSIS BY PURPOSE
    105. THAILAND MARKET ANALYSIS BY EXPENDITURE
    106. THAILAND MARKET ANALYSIS BY AGE GROUP
    107. THAILAND MARKET ANALYSIS BY TRAVELER
    108. THAILAND MARKET ANALYSIS BY SERVICE
    109. THAILAND MARKET ANALYSIS BY INDUSTRY
    110. INDONESIA MARKET ANALYSIS BY TYPE
    111. INDONESIA MARKET ANALYSIS BY PURPOSE
    112. INDONESIA MARKET ANALYSIS BY EXPENDITURE
    113. INDONESIA MARKET ANALYSIS BY AGE GROUP
    114. INDONESIA MARKET ANALYSIS BY TRAVELER
    115. INDONESIA MARKET ANALYSIS BY SERVICE
    116. INDONESIA MARKET ANALYSIS BY INDUSTRY
    117. REST OF APAC MARKET ANALYSIS BY TYPE
    118. REST OF APAC MARKET ANALYSIS BY PURPOSE
    119. REST OF APAC MARKET ANALYSIS BY EXPENDITURE
    120. REST OF APAC MARKET ANALYSIS BY AGE GROUP
    121. REST OF APAC MARKET ANALYSIS BY TRAVELER
    122. REST OF APAC MARKET ANALYSIS BY SERVICE
    123. REST OF APAC MARKET ANALYSIS BY INDUSTRY
    124. SOUTH AMERICA MARKET ANALYSIS
    125. BRAZIL MARKET ANALYSIS BY TYPE
    126. BRAZIL MARKET ANALYSIS BY PURPOSE
    127. BRAZIL MARKET ANALYSIS BY EXPENDITURE
    128. BRAZIL MARKET ANALYSIS BY AGE GROUP
    129. BRAZIL MARKET ANALYSIS BY TRAVELER
    130. BRAZIL MARKET ANALYSIS BY SERVICE
    131. BRAZIL MARKET ANALYSIS BY INDUSTRY
    132. MEXICO MARKET ANALYSIS BY TYPE
    133. MEXICO MARKET ANALYSIS BY PURPOSE
    134. MEXICO MARKET ANALYSIS BY EXPENDITURE
    135. MEXICO MARKET ANALYSIS BY AGE GROUP
    136. MEXICO MARKET ANALYSIS BY TRAVELER
    137. MEXICO MARKET ANALYSIS BY SERVICE
    138. MEXICO MARKET ANALYSIS BY INDUSTRY
    139. ARGENTINA MARKET ANALYSIS BY TYPE
    140. ARGENTINA MARKET ANALYSIS BY PURPOSE
    141. ARGENTINA MARKET ANALYSIS BY EXPENDITURE
    142. ARGENTINA MARKET ANALYSIS BY AGE GROUP
    143. ARGENTINA MARKET ANALYSIS BY TRAVELER
    144. ARGENTINA MARKET ANALYSIS BY SERVICE
    145. ARGENTINA MARKET ANALYSIS BY INDUSTRY
    146. REST OF SOUTH AMERICA MARKET ANALYSIS BY TYPE
    147. REST OF SOUTH AMERICA MARKET ANALYSIS BY PURPOSE
    148. REST OF SOUTH AMERICA MARKET ANALYSIS BY EXPENDITURE
    149. REST OF SOUTH AMERICA MARKET ANALYSIS BY AGE GROUP
    150. REST OF SOUTH AMERICA MARKET ANALYSIS BY TRAVELER
    151. REST OF SOUTH AMERICA MARKET ANALYSIS BY SERVICE
    152. REST OF SOUTH AMERICA MARKET ANALYSIS BY INDUSTRY
    153. MEA MARKET ANALYSIS
    154. GCC COUNTRIES MARKET ANALYSIS BY TYPE
    155. GCC COUNTRIES MARKET ANALYSIS BY PURPOSE
    156. GCC COUNTRIES MARKET ANALYSIS BY EXPENDITURE
    157. GCC COUNTRIES MARKET ANALYSIS BY AGE GROUP
    158. GCC COUNTRIES MARKET ANALYSIS BY TRAVELER
    159. GCC COUNTRIES MARKET ANALYSIS BY SERVICE
    160. GCC COUNTRIES MARKET ANALYSIS BY INDUSTRY
    161. SOUTH AFRICA MARKET ANALYSIS BY TYPE
    162. SOUTH AFRICA MARKET ANALYSIS BY PURPOSE
    163. SOUTH AFRICA MARKET ANALYSIS BY EXPENDITURE
    164. SOUTH AFRICA MARKET ANALYSIS BY AGE GROUP
    165. SOUTH AFRICA MARKET ANALYSIS BY TRAVELER
    166. SOUTH AFRICA MARKET ANALYSIS BY SERVICE
    167. SOUTH AFRICA MARKET ANALYSIS BY INDUSTRY
    168. REST OF MEA MARKET ANALYSIS BY TYPE
    169. REST OF MEA MARKET ANALYSIS BY PURPOSE
    170. REST OF MEA MARKET ANALYSIS BY EXPENDITURE
    171. REST OF MEA MARKET ANALYSIS BY AGE GROUP
    172. REST OF MEA MARKET ANALYSIS BY TRAVELER
    173. REST OF MEA MARKET ANALYSIS BY SERVICE
    174. REST OF MEA MARKET ANALYSIS BY INDUSTRY
    175. KEY BUYING CRITERIA OF AUTOMOBILE
    176. RESEARCH PROCESS OF MRFR
    177. DRO ANALYSIS OF AUTOMOBILE
    178. DRIVERS IMPACT ANALYSIS: AUTOMOBILE
    179. RESTRAINTS IMPACT ANALYSIS: AUTOMOBILE
    180. SUPPLY / VALUE CHAIN: AUTOMOBILE
    181. AUTOMOBILE, BY TYPE, 2024 (% SHARE)
    182. AUTOMOBILE, BY TYPE, 2024 TO 2035 (USD Billion)
    183. AUTOMOBILE, BY PURPOSE, 2024 (% SHARE)
    184. AUTOMOBILE, BY PURPOSE, 2024 TO 2035 (USD Billion)
    185. AUTOMOBILE, BY EXPENDITURE, 2024 (% SHARE)
    186. AUTOMOBILE, BY EXPENDITURE, 2024 TO 2035 (USD Billion)
    187. AUTOMOBILE, BY AGE GROUP, 2024 (% SHARE)
    188. AUTOMOBILE, BY AGE GROUP, 2024 TO 2035 (USD Billion)
    189. AUTOMOBILE, BY TRAVELER, 2024 (% SHARE)
    190. AUTOMOBILE, BY TRAVELER, 2024 TO 2035 (USD Billion)
    191. AUTOMOBILE, BY SERVICE, 2024 (% SHARE)
    192. AUTOMOBILE, BY SERVICE, 2024 TO 2035 (USD Billion)
    193. AUTOMOBILE, BY INDUSTRY, 2024 (% SHARE)
    194. AUTOMOBILE, BY INDUSTRY, 2024 TO 2035 (USD Billion)
    195. BENCHMARKING OF MAJOR COMPETITORS
  7. LIST OF TABLES
    1. LIST OF ASSUMPTIONS
    2. North America MARKET SIZE ESTIMATES; FORECAST
      1. BY TYPE, 2025-2035 (USD Billion)
      2. BY PURPOSE, 2025-2035 (USD Billion)
      3. BY EXPENDITURE, 2025-2035 (USD Billion)
      4. BY AGE GROUP, 2025-2035 (USD Billion)
      5. BY TRAVELER, 2025-2035 (USD Billion)
      6. BY SERVICE, 2025-2035 (USD Billion)
      7. BY INDUSTRY, 2025-2035 (USD Billion)
    3. US MARKET SIZE ESTIMATES; FORECAST
      1. BY TYPE, 2025-2035 (USD Billion)
      2. BY PURPOSE, 2025-2035 (USD Billion)
      3. BY EXPENDITURE, 2025-2035 (USD Billion)
      4. BY AGE GROUP, 2025-2035 (USD Billion)
      5. BY TRAVELER, 2025-2035 (USD Billion)
      6. BY SERVICE, 2025-2035 (USD Billion)
      7. BY INDUSTRY, 2025-2035 (USD Billion)
    4. Canada MARKET SIZE ESTIMATES; FORECAST
      1. BY TYPE, 2025-2035 (USD Billion)
      2. BY PURPOSE, 2025-2035 (USD Billion)
      3. BY EXPENDITURE, 2025-2035 (USD Billion)
      4. BY AGE GROUP, 2025-2035 (USD Billion)
      5. BY TRAVELER, 2025-2035 (USD Billion)
      6. BY SERVICE, 2025-2035 (USD Billion)
      7. BY INDUSTRY, 2025-2035 (USD Billion)
    5. Europe MARKET SIZE ESTIMATES; FORECAST
      1. BY TYPE, 2025-2035 (USD Billion)
      2. BY PURPOSE, 2025-2035 (USD Billion)
      3. BY EXPENDITURE, 2025-2035 (USD Billion)
      4. BY AGE GROUP, 2025-2035 (USD Billion)
      5. BY TRAVELER, 2025-2035 (USD Billion)
      6. BY SERVICE, 2025-2035 (USD Billion)
      7. BY INDUSTRY, 2025-2035 (USD Billion)
    6. Germany MARKET SIZE ESTIMATES; FORECAST
      1. BY TYPE, 2025-2035 (USD Billion)
      2. BY PURPOSE, 2025-2035 (USD Billion)
      3. BY EXPENDITURE, 2025-2035 (USD Billion)
      4. BY AGE GROUP, 2025-2035 (USD Billion)
      5. BY TRAVELER, 2025-2035 (USD Billion)
      6. BY SERVICE, 2025-2035 (USD Billion)
      7. BY INDUSTRY, 2025-2035 (USD Billion)
    7. UK MARKET SIZE ESTIMATES; FORECAST
      1. BY TYPE, 2025-2035 (USD Billion)
      2. BY PURPOSE, 2025-2035 (USD Billion)
      3. BY EXPENDITURE, 2025-2035 (USD Billion)
      4. BY AGE GROUP, 2025-2035 (USD Billion)
      5. BY TRAVELER, 2025-2035 (USD Billion)
      6. BY SERVICE, 2025-2035 (USD Billion)
      7. BY INDUSTRY, 2025-2035 (USD Billion)
    8. France MARKET SIZE ESTIMATES; FORECAST
      1. BY TYPE, 2025-2035 (USD Billion)
      2. BY PURPOSE, 2025-2035 (USD Billion)
      3. BY EXPENDITURE, 2025-2035 (USD Billion)
      4. BY AGE GROUP, 2025-2035 (USD Billion)
      5. BY TRAVELER, 2025-2035 (USD Billion)
      6. BY SERVICE, 2025-2035 (USD Billion)
      7. BY INDUSTRY, 2025-2035 (USD Billion)
    9. Russia MARKET SIZE ESTIMATES; FORECAST
      1. BY TYPE, 2025-2035 (USD Billion)
      2. BY PURPOSE, 2025-2035 (USD Billion)
      3. BY EXPENDITURE, 2025-2035 (USD Billion)
      4. BY AGE GROUP, 2025-2035 (USD Billion)
      5. BY TRAVELER, 2025-2035 (USD Billion)
      6. BY SERVICE, 2025-2035 (USD Billion)
      7. BY INDUSTRY, 2025-2035 (USD Billion)
    10. Italy MARKET SIZE ESTIMATES; FORECAST
      1. BY TYPE, 2025-2035 (USD Billion)
      2. BY PURPOSE, 2025-2035 (USD Billion)
      3. BY EXPENDITURE, 2025-2035 (USD Billion)
      4. BY AGE GROUP, 2025-2035 (USD Billion)
      5. BY TRAVELER, 2025-2035 (USD Billion)
      6. BY SERVICE, 2025-2035 (USD Billion)
      7. BY INDUSTRY, 2025-2035 (USD Billion)
    11. Spain MARKET SIZE ESTIMATES; FORECAST
      1. BY TYPE, 2025-2035 (USD Billion)
      2. BY PURPOSE, 2025-2035 (USD Billion)
      3. BY EXPENDITURE, 2025-2035 (USD Billion)
      4. BY AGE GROUP, 2025-2035 (USD Billion)
      5. BY TRAVELER, 2025-2035 (USD Billion)
      6. BY SERVICE, 2025-2035 (USD Billion)
      7. BY INDUSTRY, 2025-2035 (USD Billion)
    12. Rest of Europe MARKET SIZE ESTIMATES; FORECAST
      1. BY TYPE, 2025-2035 (USD Billion)
      2. BY PURPOSE, 2025-2035 (USD Billion)
      3. BY EXPENDITURE, 2025-2035 (USD Billion)
      4. BY AGE GROUP, 2025-2035 (USD Billion)
      5. BY TRAVELER, 2025-2035 (USD Billion)
      6. BY SERVICE, 2025-2035 (USD Billion)
      7. BY INDUSTRY, 2025-2035 (USD Billion)
    13. APAC MARKET SIZE ESTIMATES; FORECAST
      1. BY TYPE, 2025-2035 (USD Billion)
      2. BY PURPOSE, 2025-2035 (USD Billion)
      3. BY EXPENDITURE, 2025-2035 (USD Billion)
      4. BY AGE GROUP, 2025-2035 (USD Billion)
      5. BY TRAVELER, 2025-2035 (USD Billion)
      6. BY SERVICE, 2025-2035 (USD Billion)
      7. BY INDUSTRY, 2025-2035 (USD Billion)
    14. China MARKET SIZE ESTIMATES; FORECAST
      1. BY TYPE, 2025-2035 (USD Billion)
      2. BY PURPOSE, 2025-2035 (USD Billion)
      3. BY EXPENDITURE, 2025-2035 (USD Billion)
      4. BY AGE GROUP, 2025-2035 (USD Billion)
      5. BY TRAVELER, 2025-2035 (USD Billion)
      6. BY SERVICE, 2025-2035 (USD Billion)
      7. BY INDUSTRY, 2025-2035 (USD Billion)
    15. India MARKET SIZE ESTIMATES; FORECAST
      1. BY TYPE, 2025-2035 (USD Billion)
      2. BY PURPOSE, 2025-2035 (USD Billion)
      3. BY EXPENDITURE, 2025-2035 (USD Billion)
      4. BY AGE GROUP, 2025-2035 (USD Billion)
      5. BY TRAVELER, 2025-2035 (USD Billion)
      6. BY SERVICE, 2025-2035 (USD Billion)
      7. BY INDUSTRY, 2025-2035 (USD Billion)
    16. Japan MARKET SIZE ESTIMATES; FORECAST
      1. BY TYPE, 2025-2035 (USD Billion)
      2. BY PURPOSE, 2025-2035 (USD Billion)
      3. BY EXPENDITURE, 2025-2035 (USD Billion)
      4. BY AGE GROUP, 2025-2035 (USD Billion)
      5. BY TRAVELER, 2025-2035 (USD Billion)
      6. BY SERVICE, 2025-2035 (USD Billion)
      7. BY INDUSTRY, 2025-2035 (USD Billion)
    17. South Korea MARKET SIZE ESTIMATES; FORECAST
      1. BY TYPE, 2025-2035 (USD Billion)
      2. BY PURPOSE, 2025-2035 (USD Billion)
      3. BY EXPENDITURE, 2025-2035 (USD Billion)
      4. BY AGE GROUP, 2025-2035 (USD Billion)
      5. BY TRAVELER, 2025-2035 (USD Billion)
      6. BY SERVICE, 2025-2035 (USD Billion)
      7. BY INDUSTRY, 2025-2035 (USD Billion)
    18. Malaysia MARKET SIZE ESTIMATES; FORECAST
      1. BY TYPE, 2025-2035 (USD Billion)
      2. BY PURPOSE, 2025-2035 (USD Billion)
      3. BY EXPENDITURE, 2025-2035 (USD Billion)
      4. BY AGE GROUP, 2025-2035 (USD Billion)
      5. BY TRAVELER, 2025-2035 (USD Billion)
      6. BY SERVICE, 2025-2035 (USD Billion)
      7. BY INDUSTRY, 2025-2035 (USD Billion)
    19. Thailand MARKET SIZE ESTIMATES; FORECAST
      1. BY TYPE, 2025-2035 (USD Billion)
      2. BY PURPOSE, 2025-2035 (USD Billion)
      3. BY EXPENDITURE, 2025-2035 (USD Billion)
      4. BY AGE GROUP, 2025-2035 (USD Billion)
      5. BY TRAVELER, 2025-2035 (USD Billion)
      6. BY SERVICE, 2025-2035 (USD Billion)
      7. BY INDUSTRY, 2025-2035 (USD Billion)
    20. Indonesia MARKET SIZE ESTIMATES; FORECAST
      1. BY TYPE, 2025-2035 (USD Billion)
      2. BY PURPOSE, 2025-2035 (USD Billion)
      3. BY EXPENDITURE, 2025-2035 (USD Billion)
      4. BY AGE GROUP, 2025-2035 (USD Billion)
      5. BY TRAVELER, 2025-2035 (USD Billion)
      6. BY SERVICE, 2025-2035 (USD Billion)
      7. BY INDUSTRY, 2025-2035 (USD Billion)
    21. Rest of APAC MARKET SIZE ESTIMATES; FORECAST
      1. BY TYPE, 2025-2035 (USD Billion)
      2. BY PURPOSE, 2025-2035 (USD Billion)
      3. BY EXPENDITURE, 2025-2035 (USD Billion)
      4. BY AGE GROUP, 2025-2035 (USD Billion)
      5. BY TRAVELER, 2025-2035 (USD Billion)
      6. BY SERVICE, 2025-2035 (USD Billion)
      7. BY INDUSTRY, 2025-2035 (USD Billion)
    22. South America MARKET SIZE ESTIMATES; FORECAST
      1. BY TYPE, 2025-2035 (USD Billion)
      2. BY PURPOSE, 2025-2035 (USD Billion)
      3. BY EXPENDITURE, 2025-2035 (USD Billion)
      4. BY AGE GROUP, 2025-2035 (USD Billion)
      5. BY TRAVELER, 2025-2035 (USD Billion)
      6. BY SERVICE, 2025-2035 (USD Billion)
      7. BY INDUSTRY, 2025-2035 (USD Billion)
    23. Brazil MARKET SIZE ESTIMATES; FORECAST
      1. BY TYPE, 2025-2035 (USD Billion)
      2. BY PURPOSE, 2025-2035 (USD Billion)
      3. BY EXPENDITURE, 2025-2035 (USD Billion)
      4. BY AGE GROUP, 2025-2035 (USD Billion)
      5. BY TRAVELER, 2025-2035 (USD Billion)
      6. BY SERVICE, 2025-2035 (USD Billion)
      7. BY INDUSTRY, 2025-2035 (USD Billion)
    24. Mexico MARKET SIZE ESTIMATES; FORECAST
      1. BY TYPE, 2025-2035 (USD Billion)
      2. BY PURPOSE, 2025-2035 (USD Billion)
      3. BY EXPENDITURE, 2025-2035 (USD Billion)
      4. BY AGE GROUP, 2025-2035 (USD Billion)
      5. BY TRAVELER, 2025-2035 (USD Billion)
      6. BY SERVICE, 2025-2035 (USD Billion)
      7. BY INDUSTRY, 2025-2035 (USD Billion)
    25. Argentina MARKET SIZE ESTIMATES; FORECAST
      1. BY TYPE, 2025-2035 (USD Billion)
      2. BY PURPOSE, 2025-2035 (USD Billion)
      3. BY EXPENDITURE, 2025-2035 (USD Billion)
      4. BY AGE GROUP, 2025-2035 (USD Billion)
      5. BY TRAVELER, 2025-2035 (USD Billion)
      6. BY SERVICE, 2025-2035 (USD Billion)
      7. BY INDUSTRY, 2025-2035 (USD Billion)
    26. Rest of South America MARKET SIZE ESTIMATES; FORECAST
      1. BY TYPE, 2025-2035 (USD Billion)
      2. BY PURPOSE, 2025-2035 (USD Billion)
      3. BY EXPENDITURE, 2025-2035 (USD Billion)
      4. BY AGE GROUP, 2025-2035 (USD Billion)
      5. BY TRAVELER, 2025-2035 (USD Billion)
      6. BY SERVICE, 2025-2035 (USD Billion)
      7. BY INDUSTRY, 2025-2035 (USD Billion)
    27. MEA MARKET SIZE ESTIMATES; FORECAST
      1. BY TYPE, 2025-2035 (USD Billion)
      2. BY PURPOSE, 2025-2035 (USD Billion)
      3. BY EXPENDITURE, 2025-2035 (USD Billion)
      4. BY AGE GROUP, 2025-2035 (USD Billion)
      5. BY TRAVELER, 2025-2035 (USD Billion)
      6. BY SERVICE, 2025-2035 (USD Billion)
      7. BY INDUSTRY, 2025-2035 (USD Billion)
    28. GCC Countries MARKET SIZE ESTIMATES; FORECAST
      1. BY TYPE, 2025-2035 (USD Billion)
      2. BY PURPOSE, 2025-2035 (USD Billion)
      3. BY EXPENDITURE, 2025-2035 (USD Billion)
      4. BY AGE GROUP, 2025-2035 (USD Billion)
      5. BY TRAVELER, 2025-2035 (USD Billion)
      6. BY SERVICE, 2025-2035 (USD Billion)
      7. BY INDUSTRY, 2025-2035 (USD Billion)
    29. South Africa MARKET SIZE ESTIMATES; FORECAST
      1. BY TYPE, 2025-2035 (USD Billion)
      2. BY PURPOSE, 2025-2035 (USD Billion)
      3. BY EXPENDITURE, 2025-2035 (USD Billion)
      4. BY AGE GROUP, 2025-2035 (USD Billion)
      5. BY TRAVELER, 2025-2035 (USD Billion)
      6. BY SERVICE, 2025-2035 (USD Billion)
      7. BY INDUSTRY, 2025-2035 (USD Billion)
    30. Rest of MEA MARKET SIZE ESTIMATES; FORECAST
      1. BY TYPE, 2025-2035 (USD Billion)
      2. BY PURPOSE, 2025-2035 (USD Billion)
      3. BY EXPENDITURE, 2025-2035 (USD Billion)
      4. BY AGE GROUP, 2025-2035 (USD Billion)
      5. BY TRAVELER, 2025-2035 (USD Billion)
      6. BY SERVICE, 2025-2035 (USD Billion)
      7. BY INDUSTRY, 2025-2035 (USD Billion)
    31. PRODUCT LAUNCH/PRODUCT DEVELOPMENT/APPROVAL
    32. ACQUISITION/PARTNERSHIP

Business Travel Market Segmentation

Business Travel Type Outlook (USD Billion, 2018-2032)

  • Managed Business Travel
  • Unmanaged Business Travel

Business Travel Purpose Outlook (USD Billion, 2018-2032)

  • Marketing
  • Internal Meetings
  • Trade Shows
  • Product Launch
  • Others

Business Travel Expenditure Outlook (USD Billion, 2018-2032)

  • Marketing Travel Fare
  • Lodging
  • Dining
  • Others

Business Travel Age Group Outlook (USD Billion, 2018-2032)

  • Travelers Below 40 Years
  • Travelers Above 40 Years

Business Travel Traveller Outlook (USD Billion, 2018-2032)

  • Group Travel
  • Solo Travel
  • Service

Business Travel Service Outlook (USD Billion, 2018-2032)

  • Food and Lodging
  • Recreation Activity

Business Travel Industry Outlook (USD Billion, 2018-2032)

  • Government
  • Corporate

Business Travel Regional Outlook (USD Billion, 2018-2032)

  • North America Outlook (USD Billion, 2018-2032)

    • North America Business Travel by Type
      • Managed North America Business Travel By
      • Unmanaged North America Business Travel By
    • North America Business Travel by Purpose
      • Marketing
      • Internal Meetings
      • Trade Shows
      • Product Launch
      • Others
    • North America Business Travel by Expenditure
      • Marketing Travel Fare
      • Lodging
      • Dining
      • Others
    • North America Business Travel by Age Group
      • Travelers Below 40 Years
      • Travelers Above 40 Years
    • North America Business Travel by Traveler
      • Group Travel
      • Solo Travel
      • Service
    • North America Business Travel by Service
      • Food and Lodging
      • Recreation Activity
    • North America Business Travel by Industry
      • Government
      • Corporate
    • US Outlook (USD Billion, 2018-2032)

    • US Business Travel by Type
      • Managed US Business Travel By
      • Unmanaged US Business Travel By
    • US Business Travel by Purpose
      • Marketing
      • Internal Meetings
      • Trade Shows
      • Product Launch
      • Others
    • US Business Travel by Expenditure
      • Marketing Travel Fare
      • Lodging
      • Dining
      • Others
    • US Business Travel by Age Group
      • Travelers Below 40 Years
      • Travelers Above 40 Years
    • US Business Travel by Traveler
      • Group Travel
      • Solo Travel
      • Service
    • US Business Travel by Service
      • Food and Lodging
      • Recreation Activity
    • US Business Travel by Industry
      • Government
      • Corporate
    • Canada Outlook (USD Billion, 2018-2032)

    • Canada Business Travel by Type
      • Managed Canada Business Travel By
      • Unmanaged Canada Business Travel By
    • Canada Business Travel by Purpose
      • Marketing
      • Internal Meetings
      • Trade Shows
      • Product Launch
      • Others
    • Canada Business Travel by Expenditure
      • Marketing Travel Fare
      • Lodging
      • Dining
      • Others
    • Canada Business Travel by Age Group
      • Travelers Below 40 Years
      • Travelers Above 40 Years
    • Canada Business Travel by Traveler
      • Group Travel
      • Solo Travel
      • Service
    • Canada Business Travel by Service
      • Food and Lodging
      • Recreation Activity
    • Canada Business Travel by Industry
      • Government
      • Corporate
  • Europe Outlook (USD Billion, 2018-2032)

    • Europe Business Travel by Type
      • Managed Europe Business Travel By
      • Unmanaged Europe Business Travel By
    • Europe Business Travel by Purpose
      • Marketing
      • Internal Meetings
      • Trade Shows
      • Product Launch
      • Others
    • Europe Business Travel by Expenditure
      • Marketing Travel Fare
      • Lodging
      • Dining
      • Others
    • Europe Business Travel by Age Group
      • Travelers Below 40 Years
      • Travelers Above 40 Years
    • Europe Business Travel by Traveler
      • Group Travel
      • Solo Travel
      • Service
    • Europe Business Travel by Service
      • Food and Lodging
      • Recreation Activity
    • Europe Business Travel by Industry
      • Government
      • Corporate
    • Germany Outlook (USD Billion, 2018-2032)

    • Germany Business Travel by Type
      • Managed Germany Business Travel By
      • Unmanaged Germany Business Travel By
    • Germany Business Travel by Purpose
      • Marketing
      • Internal Meetings
      • Trade Shows
      • Product Launch
      • Others
    • Germany Business Travel by Expenditure
      • Marketing Travel Fare
      • Lodging
      • Dining
      • Others
    • Germany Business Travel by Age Group
      • Travelers Below 40 Years
      • Travelers Above 40 Years
    • Germany Business Travel by Traveler
      • Group Travel
      • Solo Travel
      • Service
    • Germany Business Travel by Service
      • Food and Lodging
      • Recreation Activity
    • Germany Business Travel by Industry
      • Government
      • Corporate
    • France Outlook (USD Billion, 2018-2032)

    • France Business Travel by Type
      • Managed France Business Travel By
      • Unmanaged France Business Travel By
    • France Business Travel by Purpose
      • Marketing
      • Internal Meetings
      • Trade Shows
      • Product Launch
      • Others
    • France Business Travel by Expenditure
      • Marketing Travel Fare
      • Lodging
      • Dining
      • Others
    • France Business Travel by Age Group
      • Travelers Below 40 Years
      • Travelers Above 40 Years
    • France Business Travel by Traveler
      • Group Travel
      • Solo Travel
      • Service
    • France Business Travel by Service
      • Food and Lodging
      • Recreation Activity
    • France Business Travel by Industry
      • Government
      • Corporate
    • UK Outlook (USD Billion, 2018-2032)

    • UK Business Travel by Type
      • Managed UK Business Travel By
      • Unmanaged UK Business Travel By
    • UK Business Travel by Purpose
      • Marketing
      • Internal Meetings
      • Trade Shows
      • Product Launch
      • Others
    • UK Business Travel by Expenditure
      • Marketing Travel Fare
      • Lodging
      • Dining
      • Others
    • UK Business Travel by Age Group
      • Travelers Below 40 Years
      • Travelers Above 40 Years
    • UK Business Travel by Traveler
      • Group Travel
      • Solo Travel
      • Service
    • UK Business Travel by Service
      • Food and Lodging
      • Recreation Activity
    • UK Business Travel by Industry
      • Government
      • Corporate
    • Italy Outlook (USD Billion, 2018-2032)

    • Italy Business Travel by Type
      • Managed Italy Business Travel By
      • Unmanaged Italy Business Travel By
    • Italy Business Travel by Purpose
      • Marketing
      • Internal Meetings
      • Trade Shows
      • Product Launch
      • Others
    • Italy Business Travel by Expenditure
      • Marketing Travel Fare
      • Lodging
      • Dining
      • Others
    • Italy Business Travel by Age Group
      • Travelers Below 40 Years
      • Travelers Above 40 Years
    • Italy Business Travel by Traveler
      • Group Travel
      • Solo Travel
      • Service
    • Italy Business Travel by Service
      • Food and Lodging
      • Recreation Activity
    • Italy Business Travel by Industry
      • Government
      • Corporate
    • Spain Outlook (USD Billion, 2018-2032)

    • Spain Business Travel by Type
      • Managed Spain Business Travel By
      • Unmanaged Spain Business Travel By
    • Spain Business Travel by Purpose
      • Marketing
      • Internal Meetings
      • Trade Shows
      • Product Launch
      • Others
    • Spain Business Travel by Expenditure
      • Marketing Travel Fare
      • Lodging
      • Dining
      • Others
    • Spain Business Travel by Age Group
      • Travelers Below 40 Years
      • Travelers Above 40 Years
    • Spain Business Travel by Traveler
      • Group Travel
      • Solo Travel
      • Service
    • Spain Business Travel by Service
      • Food and Lodging
      • Recreation Activity
    • Spain Business Travel by Industry
      • Government
      • Corporate
    • Rest Of Europe Outlook (USD Billion, 2018-2032)

    • Rest of Europe Business Travel by Type
      • Managed Rest of Europe Business Travel By
      • Unmanaged Rest of Europe Business Travel By
    • Rest of Europe Business Travel by Purpose
      • Marketing
      • Internal Meetings
      • Trade Shows
      • Product Launch
      • Others
    • Rest of Europe Business Travel by Expenditure
      • Marketing Travel Fare
      • Lodging
      • Dining
      • Others
    • Rest of Europe Business Travel by Age Group
      • Travelers Below 40 Years
      • Travelers Above 40 Years
    • Rest of Europe Business Travel by Traveler
      • Group Travel
      • Solo Travel
      • Service
    • Rest of Europe Business Travel by Service
      • Food and Lodging
      • Recreation Activity
    • Rest of Europe Business Travel by Industry
      • Government
      • Corporate
  • Asia-Pacific Outlook (USD Billion, 2018-2032)

    • Asia Pacific Business Travel by Type
      • Managed Asia Pacific Business Travel By
      • Unmanaged Asia Pacific Business Travel By
    • Asia Pacific Business Travel by Purpose
      • Marketing
      • Internal Meetings
      • Trade Shows
      • Product Launch
      • Others
    • Asia Pacific Business Travel by Expenditure
      • Marketing Travel Fare
      • Lodging
      • Dining
      • Others
    • Asia Pacific Business Travel by Age Group
      • Travelers Below 40 Years
      • Travelers Above 40 Years
    • Asia Pacific Business Travel by Traveler
      • Group Travel
      • Solo Travel
      • Service
    • Asia Pacific Business Travel by Service
      • Food and Lodging
      • Recreation Activity
    • Asia Pacific Business Travel by Industry
      • Government
      • Corporate
    • China Outlook (USD Billion, 2018-2032)

    • China Business Travel by Type
      • Managed China Business Travel By
      • Unmanaged China Business Travel By
    • China Business Travel by Purpose
      • Marketing
      • Internal Meetings
      • Trade Shows
      • Product Launch
      • Others
    • China Business Travel by Expenditure
      • Marketing Travel Fare
      • Lodging
      • Dining
      • Others
    • China Business Travel by Age Group
      • Travelers Below 40 Years
      • Travelers Above 40 Years
    • China Business Travel by Traveler
      • Group Travel
      • Solo Travel
      • Service
    • China Business Travel by Service
      • Food and Lodging
      • Recreation Activity
    • China Business Travel by Industry
      • Government
      • Corporate
    • Japan Outlook (USD Billion, 2018-2032)

    • Japan Business Travel by Type
      • Managed Japan Business Travel By
      • Unmanaged Japan Business Travel By
    • Japan Business Travel by Purpose
      • Marketing
      • Internal Meetings
      • Trade Shows
      • Product Launch
      • Others
    • Japan Business Travel by Expenditure
      • Marketing Travel Fare
      • Lodging
      • Dining
      • Others
    • Japan Business Travel by Age Group
      • Travelers Below 40 Years
      • Travelers Above 40 Years
    • Japan Business Travel by Traveler
      • Group Travel
      • Solo Travel
      • Service
    • Japan Business Travel by Service
      • Food and Lodging
      • Recreation Activity
    • Japan Business Travel by Industry
      • Government
      • Corporate
    • India Outlook (USD Billion, 2018-2032)

    • India Business Travel by Type
      • Managed India Business Travel By
      • Unmanaged India Business Travel By
    • India Business Travel by Purpose
      • Marketing
      • Internal Meetings
      • Trade Shows
      • Product Launch
      • Others
    • India Business Travel by Expenditure
      • Marketing Travel Fare
      • Lodging
      • Dining
      • Others
    • India Business Travel by Age Group
      • Travelers Below 40 Years
      • Travelers Above 40 Years
    • India Business Travel by Traveler
      • Group Travel
      • Solo Travel
      • Service
    • India Business Travel by Service
      • Food and Lodging
      • Recreation Activity
    • India Business Travel by Industry
      • Government
      • Corporate
    • Australia Outlook (USD Billion, 2018-2032)

    • Australia Business Travel by Type
      • Managed Australia Business Travel By
      • Unmanaged Australia Business Travel By
    • Australia Business Travel by Purpose
      • Marketing
      • Internal Meetings
      • Trade Shows
      • Product Launch
      • Others
    • Australia Business Travel by Expenditure
      • Marketing Travel Fare
      • Lodging
      • Dining
      • Others
    • Australia Business Travel by Age Group
      • Travelers Below 40 Years
      • Travelers Above 40 Years
    • Australia Business Travel by Traveler
      • Group Travel
      • Solo Travel
      • Service
    • Australia Business Travel by Service
      • Food and Lodging
      • Recreation Activity
    • Australia Business Travel by Industry
      • Government
      • Corporate
    • Rest of Asia-Pacific Outlook (USD Billion, 2018-2032)

    • Rest of Asia Pacific Business Travel by Type
      • Managed Rest of Asia Pacific Business Travel By
      • Unmanaged Rest of Asia Pacific Business Travel By
    • Rest of Asia Pacific Business Travel by Purpose
      • Marketing
      • Internal Meetings
      • Trade Shows
      • Product Launch
      • Others
    • Rest of Asia Pacific Business Travel by Expenditure
      • Marketing Travel Fare
      • Lodging
      • Dining
      • Others
    • Rest of Asia Pacific Business Travel by Age Group
      • Travelers Below 40 Years
      • Travelers Above 40 Years
    • Rest of Asia Pacific Business Travel by Traveler
      • Group Travel
      • Solo Travel
      • Service
    • Rest of Asia Pacific Business Travel by Service
      • Food and Lodging
      • Recreation Activity
    • Rest of Asia Pacific Business Travel by Industry
      • Government
      • Corporate
  • Rest of the World Outlook (USD Billion, 2018-2032)

    • Rest of the World Business Travel by Type
      • Managed Rest of the World Business Travel By
      • Unmanaged Rest of the World Business Travel By
    • Rest of the World Business Travel by Purpose
      • Marketing
      • Internal Meetings
      • Trade Shows
      • Product Launch
      • Others
    • Rest of the World Business Travel by Expenditure
      • Marketing Travel Fare
      • Lodging
      • Dining
      • Others
    • Rest of the World Business Travel by Age Group
      • Travelers Below 40 Years
      • Travelers Above 40 Years
    • Rest of the World Business Travel by Traveler
      • Group Travel
      • Solo Travel
      • Service
    • Rest of the World Business Travel by Service
      • Food and Lodging
      • Recreation Activity
    • Rest of the World Business Travel by Industry
      • Government
      • Corporate
    • Middle East Outlook (USD Billion, 2018-2032)

    • Middle East Business Travel by Type
      • Managed Middle East Business Travel By
      • Unmanaged Middle East Business Travel By
    • Middle East Business Travel by Purpose
      • Marketing
      • Internal Meetings
      • Trade Shows
      • Product Launch
      • Others
    • Middle East Business Travel by Expenditure
      • Marketing Travel Fare
      • Lodging
      • Dining
      • Others
    • Middle East Business Travel by Age Group
      • Travelers Below 40 Years
      • Travelers Above 40 Years
    • Middle East Business Travel by Traveler
      • Group Travel
      • Solo Travel
      • Service
    • Middle East Business Travel by Service
      • Food and Lodging
      • Recreation Activity
    • Middle East Business Travel by Industry
      • Government
      • Corporate
    • Africa Outlook (USD Billion, 2018-2032)

    • Africa Business Travel by Type
      • Managed Africa Business Travel By
      • Unmanaged Africa Business Travel By
    • Africa Business Travel by Purpose
      • Marketing
      • Internal Meetings
      • Trade Shows
      • Product Launch
      • Others
    • Africa Business Travel by Expenditure
      • Marketing Travel Fare
      • Lodging
      • Dining
      • Others
    • Africa Business Travel by Age Group
      • Travelers Below 40 Years
      • Travelers Above 40 Years
    • Africa Business Travel by Traveler
      • Group Travel
      • Solo Travel
      • Service
    • Africa Business Travel by Service
      • Food and Lodging
      • Recreation Activity
    • Africa Business Travel by Industry
      • Government
      • Corporate
    • Latin America Outlook (USD Billion, 2018-2032)

    • Latin America Business Travel by Type
      • Managed Latin America Business Travel By
      • Unmanaged Latin America Business Travel By
    • Latin America Business Travel by Purpose
      • Marketing
      • Internal Meetings
      • Trade Shows
      • Product Launch
      • Others
    • Latin America Business Travel by Expenditure
      • Marketing Travel Fare
      • Lodging
      • Dining
      • Others
    • Latin America Business Travel by Age Group
      • Travelers Below 40 Years
      • Travelers Above 40 Years
    • Latin America Business Travel by Traveler
      • Group Travel
      • Solo Travel
      • Service
    • Latin America Business Travel by Service
      • Food and Lodging
      • Recreation Activity
    • Latin America Business Travel by Industry
      • Government
      • Corporate
Infographic

Free Sample Request

Kindly complete the form below to receive a free sample of this Report

Get Free Sample

Customer Strories

“I am very pleased with how market segments have been defined in a relevant way for my purposes (such as "Portable Freezers & refrigerators" and "last-mile"). In general the report is well structured. Thanks very much for your efforts.”

Victoria Milne

Founder

Compare Licence

×
Features License Type
Single User Multiuser License Enterprise User
Price $4,950 $5,950 $7,250
Maximum User Access Limit 1 User Upto 10 Users Unrestricted Access Throughout the Organization
Free Customization
Direct Access to Analyst
Deliverable Format
Platform Access
Discount on Next Purchase 10% 15% 15%
Printable Versions