• Cat-intel
  • MedIntelliX
  • Resources
  • About Us
  • Hero Background
    English
    Chinese
    French
    Japanese
    Korean
    German
    Spanish

    Calcium Nitrate Market Share

    ID: MRFR/CnM/1099-HCR
    131 Pages
    Anshula Mandaokar
    October 2025

    Calcium Nitrate Market Research Report Information by process (Limestone, Phosphate Rock, Ammonium Nitrate), Application (Water Treatment, Fertilizers, Concrete Manufacturing, Explosives and Others) and Region (North America, Latin America, Europe, Asia Pacific, and the Middle East & Africa) —Forecast till 2035

    Share:
    Download PDF ×

    We do not share your information with anyone. However, we may send you emails based on your report interest from time to time. You may contact us at any time to opt-out.

    Calcium Nitrate Market Infographic
    $ 4,950.0
    $ 5,950.0
    $ 7,250.0

    Market Share

    Calcium Nitrate Market Share Analysis

    The Calcium Nitrate Market, a vital fertilizer and agricultural industry, uses many market share positioning strategies. A strong presence in a competitive setting is achieved using these approaches. This simple technique emphasizes calcium nitrate's vital role in agricultural and industrial processes and its many applications. This market's players emphasize calcium nitrate's calcium and nitrogen content, making it a good fertilizer for horticulture and greenhouse crops. These companies may attract a broad spectrum of consumers and win a substantial market share by positioning themselves as primary suppliers of this crucial chemical. New developments and technological advances affect market share in the Calcium Nitrate sector. Businesses spend much on R&D to increase calcium nitrate-based fertilizer quality, solubility, and efficacy. Innovations may include formulating calcium nitrate, improving production techniques, or finding new industrial applications for it. When companies stay ahead of technical innovation, they meet customers' evolving needs and lead in the delivery of cutting-edge solutions, increasing their market share. Another key strategy is to partner with agricultural cooperatives, horticultural companies, and pesticide makers. Partnerships allow firms to share resources, acquire complementary talents, and overcome challenges in creating and implementing calcium nitrate solutions. These agreements promote industry standards and provide market leaders a forum to influence market direction. Joint initiatives help companies gain a competitive edge and increase market share. Sustainability and environmental practices are crucial to Calcium Nitrate market share. Sustainable sourcing, production, and nutrient management solutions attract environmentally conscious corporations and farmers. This aligns with global efforts to promote sustainable agriculture. It also promotes enterprises as ethical industry leaders, increasing market share. Marketing and communication of calcium nitrate's benefits are crucial to market share. Businesses that can successfully convey their products' advantages, such as improved plant nutrition, agricultural yields, and environmental impact, may stand out in a competitive market. A strong brand identity that emphasizes reliability, flexibility, and sustainability builds customer trust and loyalty, which increases market share. Market share positioning tactics in the Calcium Nitrate market include regional expansion and product diversification. Companies are exploring opportunities in various agricultural disciplines and regions to capitalize on the rising demand for calcium nitrate fertilizers. They include establishing a strong presence in high-adoption areas and entering new markets with a focus on greenhouse farming and specialty crops. Companies may reach a broad range of consumers and adapt to market trends by proactively expanding their market reach. This helps them gain market share via initiatives.

    Market Summary

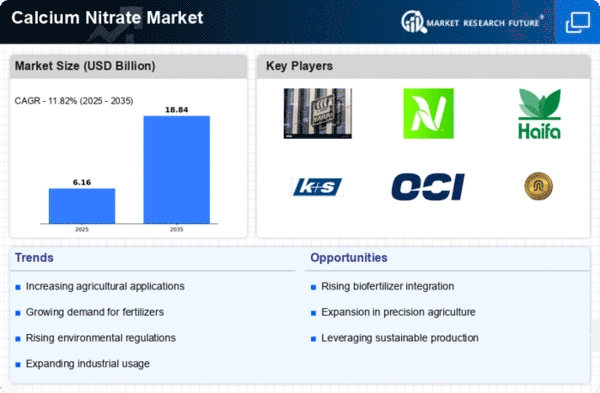
    The global calcium nitrate market is projected to grow from 5.31 USD billion in 2024 to 9.39 USD billion by 2035.

    Key Market Trends & Highlights

    Calcium Nitrate Key Trends and Highlights

    • The market is expected to experience a compound annual growth rate (CAGR) of 5.32 percent from 2025 to 2035.
    • By 2035, the market valuation is anticipated to reach 9.39 USD billion, indicating robust growth.
    • In 2024, the market is valued at 5.31 USD billion, reflecting a strong foundation for future expansion.
    • Growing adoption of calcium nitrate in agriculture due to its effectiveness as a fertilizer is a major market driver.

    Market Size & Forecast

    2024 Market Size 5.31 (USD Billion)
    2035 Market Size 9.39 (USD Billion)
    CAGR (2025-2035) 5.32%
    Largest Regional Market Share in 2024 latin_america)

    Major Players

    GFS Chemicals Inc, Rural Liquid Fertilizers (RLF), Sterling Chemicals & Alcohols Limited, Blue Line Corporation, Prathista Industries Limited, Haifa Chemicals Ltd, Nutrien Ltd, Yara International ASA, Swiss Formulations India, Uralchem Holding PLC

    Market Trends

    The global calcium nitrate market appears to be experiencing a robust demand driven by its essential role in agricultural fertilizers and environmental applications, suggesting a potential for sustained growth in the coming years.

    U.S. Geological Survey

    Calcium Nitrate Market Market Drivers

    Market Growth Projections

    The Global Calcium Nitrate Market Industry is poised for substantial growth, with projections indicating a market value of 9.39 USD Billion by 2035. This growth trajectory reflects the increasing adoption of calcium nitrate across various sectors, particularly agriculture and construction. The anticipated CAGR of 5.32% from 2025 to 2035 suggests a robust demand for calcium nitrate as industries recognize its benefits. Market dynamics, including rising agricultural productivity and infrastructure development, are likely to contribute to this upward trend. The industry's ability to adapt to changing market conditions will be crucial in sustaining this growth.

    Infrastructure Development

    Infrastructure development plays a pivotal role in propelling the Global Calcium Nitrate Market Industry forward. Calcium nitrate is utilized in various construction applications, including soil stabilization and as a component in concrete mixtures. As countries invest in infrastructure projects to bolster economic growth, the demand for calcium nitrate is likely to increase. The construction sector's recovery and expansion contribute to the market's growth trajectory. With the market projected to grow at a CAGR of 5.32% from 2025 to 2035, the ongoing infrastructure initiatives worldwide are expected to significantly influence calcium nitrate consumption.

    Rising Demand in Agriculture

    The Global Calcium Nitrate Market Industry experiences a notable surge in demand driven by its essential role as a fertilizer in agriculture. Calcium nitrate is recognized for enhancing crop yield and quality, particularly in high-value crops such as fruits and vegetables. As the global population continues to grow, the need for efficient agricultural practices becomes increasingly critical. In 2024, the market is projected to reach 5.31 USD Billion, reflecting the agricultural sector's reliance on calcium nitrate to meet food production demands. This trend is expected to persist, with the market anticipated to expand further as sustainable farming practices gain traction.

    Market Diversification and Applications

    The Global Calcium Nitrate Market Industry is characterized by diversification in applications beyond agriculture. Calcium nitrate is increasingly used in various sectors, including wastewater treatment, food preservation, and the production of calcium-based products. This diversification opens new avenues for growth, as industries seek effective solutions for their specific needs. The versatility of calcium nitrate enhances its market appeal, allowing it to penetrate various sectors. As the market evolves, the potential for new applications may further stimulate demand, contributing to the overall growth trajectory of the industry.

    Technological Advancements in Production

    Technological advancements in the production of calcium nitrate are shaping the Global Calcium Nitrate Market Industry. Innovations in manufacturing processes enhance efficiency and reduce production costs, making calcium nitrate more accessible to farmers and industries. These advancements may include improved methods for synthesizing calcium nitrate from ammonia and nitric acid, which can lead to higher purity levels and better performance in agricultural applications. As production becomes more streamlined, the market is expected to benefit from increased supply and competitive pricing, further driving growth. The anticipated market growth to 9.39 USD Billion by 2035 underscores the impact of these technological developments.

    Environmental Regulations and Sustainability

    The Global Calcium Nitrate Market Industry is influenced by stringent environmental regulations promoting sustainable practices. Calcium nitrate serves as an environmentally friendly fertilizer, reducing the risk of soil degradation and water pollution compared to traditional fertilizers. As governments worldwide implement policies aimed at reducing chemical runoff and promoting sustainable agriculture, the demand for calcium nitrate is likely to rise. This shift towards eco-friendly agricultural inputs aligns with global sustainability goals, potentially leading to increased market penetration. The industry's adaptation to these regulations may result in a more favorable market environment for calcium nitrate.

    Market Segment Insights

    Regional Insights

    Key Companies in the Calcium Nitrate Market market include

    Industry Developments

    In January 2024, Yara announced its intentions to add additional production units in the United States which will help cover the increasing demand for calcium nitrate fertilizers. The company aims to boost its footprint in the North American region through this initiative.

    During February 2024, Nutrien focused on entering into new partnerships as well as acquisitions to strengthen its position in the market. The Canadian company entered into a consortium agreement with a local Chinese firm to improve its production and distribution capacity within the Asia-Pacific region.

    In August 2022, Russia's Acron Group, a manufacturer of mineral fertilizers, commissioned a granulated calcium nitrate production unit with a capacity of 100,000 tpa at its Veliky Novgorod facility.

    In April 2022, Casale made it public that it had acquired Green Granulation, for which Green Granulation's purpose of business is designing and assembling urea and Ammonium Nitrate (AN) and Calcium Ammonium Nitrate (CAN) granulating units. This acquisition is greatly needed as it will consolidate Casale in the market.

    April 2021 marked the announcement of three more products by FBSciences, of which YaraLiva calcium nitrate fertilizers can be used, to add up to their previously introduced three products. These include ZiCAN, BorCAN, and ManCAN Soil. Also, FBSciences, a biostimulant and biopesticides company with a distinct outlook in crop nutrition, has therefore incorporated a few more products, including CopCAN PhotoCAN and FlexCAN CN-compatible soils, after the success of the expansion of the three products in the line-up, into the range.

    On the 18th of March, 2023, the EU put its stamp in €70m investment grant towards North Macedonia as well as the European Investment Bank. The construction of a wastewater treatment facility at Skopje was one of the reasons for the issuing of the grant. Other components, such as the construction of the facility itself, were also part of the funding, so indeed, these were the greatest EU grants ever offered by Macedonia.

    Future Outlook

    Calcium Nitrate Market Future Outlook

    The Global Calcium Nitrate Market is projected to grow at a 5.32% CAGR from 2024 to 2035, driven by increasing agricultural demand, urbanization, and sustainable practices.

    New opportunities lie in:

    • Develop innovative calcium nitrate formulations for precision agriculture.
    • Expand distribution networks in emerging markets to capture new customer segments.
    • Invest in research for eco-friendly production methods to enhance sustainability.

    By 2035, the market is expected to exhibit robust growth, reflecting evolving agricultural practices and environmental considerations.

    Market Segmentation

    Market Dynamics

    • Drivers
    • Challenges
    • Opportunities
    • Restraints 
    • Cumulative growth Analysis

    Report Overview

    • Recent Developments of calcium nitrate market Forecast
    • Competitive landscape analysis
    • The regional analysis of calcium nitrate market 
    • Market segmentation overview
    • Value chain analysis for the calcium nitrate market forecast Report.
    • Explanation upon the Market Dynamics
    • Analysis based upon COVID 19
    • Market overview highlights the global recognition of the calcium nitrate market overview

    Segment Overview

    • By Application 
    • By methods
    • By Region

    Major Market Players

    • Uralchem Holding PLC (Russia)
    • Swiss Formulations India (India)
    • Yara International ASA (Norway)
    • Nutrien Ltd (Canada)
    • Prathista Industries Limited (India)Haifa Chemicals Ltd (Israel)
    • Blue Line Corporation
    • Sterling Chemicals & Alcohols Limited (India)
    • Rural Liquid Fertilizers (RLF) (Australia)
    • GFS Chemicals Inc (The US)

    Report Scope

    Attribute/Metric Details
      Market Size   2030: USD 7.5 Billion
      CAGR   4.6% (2022-2030)
      Base Year   2021
      Forecast Period   2022-2030
      Historical Data   2019 & 2020
      Forecast Units    Value (USD Billion)
      Report Coverage   Revenue Forecast, Competitive Landscape, Growth Factors, and Trends
      Segments Covered   Process, Application
      Geographies Covered   North America, Europe, Asia-Pacific, and Rest of the World (RoW)
      Key Vendors   GFS Chemicals Inc (The US), Rural Liquid Fertilizers (RLF) (Australia), Haifa Chemicals Ltd (Israel), Nutrien Ltd (Canada), Prathista Industries Limited (India), Sterling Chemicals & Alcohols Limited (India), Yara International ASA (Norway), Swiss Formulations India (India), Uralchem Holding PLC (Russia), Blue Line Corporation (India) Among others.
      Key Market Opportunities   New product launches and R&D Amongst major key Players
      Key Market Drivers ·  Increasing demand from agro-chemicals ·  The rapid growth of the water and wastewater treatment chemicals ·  The rising global population

    Market Highlights

    Author

    Anshula Mandaokar
    Team Lead - Research

    She holds an experience of about 6+ years in market research and business consulting, working under the spectrum of information communication technology, telecommunications and semiconductor domains. aarti conceptualizes and implements a scalable business strategy and provides strategic leadership to the clients. her expertise lies in market estimation, competitive intelligence, pipeline analysis, customer assessment, etc.

    Leave a Comment

    Latest Comments

    John Doe
    john@example.com

    This is a great article! Really helped me understand the topic better.

    Posted on July 23, 2025, 10:15 AM
    Jane Smith
    jane@domain.com

    Thanks for sharing this. I’ve bookmarked it for later reference.

    Posted on July 22, 2025, 7:45 PM

    FAQs

    What valuation would the calcium nitrate market achieve by 2030?

    The calcium nitrate market would outperform, worth USD 7.5 billion by 2030.

    Which industry to have a significant effect on the calcium nitrate market development?

    The food and horticulture industry is set to rouse development for the calcium nitrate market.

    Which is the main territorial market of the calcium nitrate market?

    The Asia Pacific district is the main calcium nitrate market.

    1. Table of Contents
    2. 1    Executive Summary    
    3. 2    Market Introduction    
      1.     Market Definition    
      2.     Scope of the Study    
    4.     2.2.1      Research Objectives
      1.      Assumptions & Limitations        
      2.        Markets Structure    
      3.     Key Takeaways        
    5. 3    Market Research Methodology    
      1.     Research Process    
      2.     Primary Research    
      3.     Secondary Research
      4.        Market Size Estimation
      5.     Forecast Model    
    6.           Market Dynamics of Global Calcium Nitrate Market    
      1.     Introduction    
      2.     Drivers    
      3.     Restraints     
      4.     Opportunities
      5.     Challenges 
      6.     Trends/Technology    
    7. 5    Market Factor Analysis    of Global Calcium Nitrate Market    
      1.     Supply Chain Analysis 
        1.     Raw Material Suppliers     
        2.     Manufacturers/Producers     
        3.     Distributors/Retailers/Wholesalers/E-Commerce
        4.     End User     
      2.        Porter’s Five Forces Analysis    
        1.     Threat of New Entrants    
        2.     Bargaining Power of Buyers    
        3.     Bargaining Power of Suppliers    
        4.     Threat of Substitutes    
        5.     Intensity of Competitive Rivalry
      3.     Pricing Analysis
    8.     Global Calcium Nitrate Market, by Process
      1.     Introduction
      2.     Limestone
    9.              6.2.1   Market Estimates & Forecast, 2020−2027
      1.   Market Estimates & Forecast, by Region, 2020−2027
      2.     Phosphate Rock
    10.              6.3.1   Market Estimates & Forecast, 2020−2027
      1.   Market Estimates & Forecast, by Region, 2020−2027
      2.     Ammonium Nitrate
    11.              6.4.1   Market Estimates & Forecast, 2020−2027
      1.   Market Estimates & Forecast, by Region, 2020−2027
    12.           
    13.     Global Calcium Nitrate Market, by Application
      1.     Introduction
      2.     Water Treatment
        1.   Market Estimates & Forecast, 2020−2027
        2.   Market Estimates & Forecast, by Region, 2020−2027
      3.     Fertilizers
      4.   Market Estimates & Forecast, 2020−2027
        1.   Market Estimates & Forecast, by Region, 2020−2027
      5.     Concrete Manufacturing
        1.   Market Estimates & Forecast, 2020−2027
        2.   Market Estimates & Forecast, by Region, 2020−2027
      6.     Explosives
        1.   Market Estimates & Forecast, 2020−2027
        2.   Market Estimates & Forecast, by Region, 2020−2027
      7.     Others
        1.   Market Estimates & Forecast, 2020−2027
        2.   Market Estimates & Forecast, by Region, 2020−2027
    14.     Global Calcium Nitrate Market, by Region
      1.     Introduction
      2.     North America
    15.                           8.2.1   Market Estimates & Forecast, 2020−2027
    16.                           8.2.2   Market Estimates & Forecast, by Process, 2020−2027
    17.                           8.2.3   Market Estimates & Forecast, by Application, 2020−2027
    18.                           8.2.4   US
    19.                                      8.2.4.1   Market Estimates & Forecast, 2020−2027
    20.                                      8.2.4.2   Market Estimates & Forecast, by Process, 2020−2027
    21.                                      8.2.4.3   Market Estimates & Forecast, Application, 2020−2027
    22.                          8.2.5    Canada
    23.                                      8.2.5.1   Market Estimates & Forecast, 2020−2027
    24.                                      8.2.5.2   Market Estimates & Forecast, by Process, 2020−2027
    25.                                      8.2.5.3   Market Estimates & Forecast, by Application, 2020−2027
      1.       Europe
    26.                          8.1   Market Estimates & Forecast, 2020−2027
    27.                          8.3.2   Market Estimates & Forecast, by Process, 2020−2027
    28.                          8.3.3   Market Estimates & Forecast, by Application, 2020−2027
    29.                          8.3.4    Germany
    30.                                       8.3.4.1   Market Estimates & Forecast, 2020−2027
    31.                                       8.3.4.2   Market Estimates & Forecast, by Process, 2020−2027
    32.                                       8.3.4.3   Market Estimates & Forecast, by Application, 2020−2027
    33.                          8.3.5     France
    34.                                       8.3.5.1   Market Estimates & Forecast, 2020−2027
    35.                                       8.3.5.2   Market Estimates & Forecast, by Process, 2020−2027
    36.                                       8.3.5.3   Market Estimates & Forecast, by Application, 2020−2027
    37.                          8.3.6     Italy
    38.                                       8.3.6.1   Market Estimates & Forecast, 2020−2027
    39.                                       8.3.6.2   Market Estimates & Forecast, by Process, 2020−2027
    40.                                       8.3.6.3   Market Estimates & Forecast, by Application, 2020−2027
    41.                          8.3.7     Spain
    42.                                       8.3.7.1   Market Estimates & Forecast, 2020−2027
    43.                                       8.3.7.2   Market Estimates & Forecast, by Process,2020−2027
    44.                                       8.3.7.3   Market Estimates & Forecast, by Application, 2020−2027
    45.                          8.3.8     UK
    46.                                       8.3.8.1   Market Estimates & Forecast, 2020−2027
    47.                                       8.3.8.2   Market Estimates & Forecast, by Process,2020−2027
    48.                                       8.3.8.3   Market Estimates & Forecast, by Application, 2020−2027
    49.                          8.3.9     Russia
    50.                                       8.3.9.1   Market Estimates & Forecast, 2020−2027
    51.                                       8.3.9.2   Market Estimates & Forecast, by Process,2020−2027
    52.                                       8.3.9.3   Market Estimates & Forecast, by Application, 2020−2027
    53.                          8.10   Poland
    54.                                       8.10.1   Market Estimates & Forecast, 2020−2027
    55.                                       8.10.2   Market Estimates & Forecast, by Process, 2020−2027
    56.                                       8.10.3   Market Estimates & Forecast, by Application, 2020−2027
    57.                          8.11    Rest of Europe
    58.                                        8.11.1   Market Estimates & Forecast, 2020−2027
    59.                                        8.11.2   Market Estimates & Forecast, by Process, 2020−2027
    60.                                        8.11.3   Market Estimates & Forecast, by Application, 2020−2027
      1.     Asia-Pacific
    61.                           8.4.1   Market Estimates & Forecast, 2020−2027
    62.                           8.4.2   Market Estimates & Forecast, by Process, 2020−2027
    63.                           8.4.3   Market Estimates & Forecast, by Application, 2020−2027
    64.                           8.4.4   China
    65.                                       8.4.4.1     Market Estimates & Forecast, 2020−2027
    66.                                       8.4.4.2     Market Estimates & Forecast, by Process, 2020−2027
    67.                                       8.4.4.3    Market Estimates & Forecast, by Application, 2020−2027
    68.                           8.4.5    India
    69.                                        8.4.5.1   Market Estimates & Forecast, 2020−2027
    70.                                        8.4.5.2   Market Estimates & Forecast, by Process, 2020−2027
    71.                                        8.4.5.3   Market Estimates & Forecast, by Application, 2020−2027
    72.                           8.4.6    Japan
    73.                                        8.4.6.1   Market Estimates & Forecast, 2020−2027
    74.                                        8.4.6.2   Market Estimates & Forecast, by Process, 2020−2027
    75.                                        8.4.6.3   Market Estimates & Forecast, by Application, 2020−2027
    76.                           8.4.7    Australia & New Zealand
    77.                                        8.4.7.1   Market Estimates & Forecast, 2020−2027
    78.                                        8.4.7.2   Market Estimates & Forecast, by Process, 2020−2027
    79.                                        8.4.7.3   Market Estimates & Forecast, by Application, 2020−2027
    80.                           8.4.8     Rest of Asia-Pacific
    81.                                        8.4.8.1   Market Estimates & Forecast, 2020−2027
    82.                                        8.4.8.2   Market Estimates & Forecast, by Process, 2020−2027
    83.                                        8.4.8.3   Market Estimates & Forecast, by Application, 2020−2027
    84.              8.5    Middle East & Africa 
    85.                           8.5.1   Market Estimates & Forecast, 2020−2027
    86.                           8.5.2   Market Estimates & Forecast, by Process, 2020−2027
    87.                           8.5.3   Market Estimates & Forecast, by Application, 2020−2027
    88.                           8.5.4   GCC
    89.                                      8.5.4.1   Market Estimates & Forecast, 2020−2027
    90.                                      8.5.4.2   Market Estimates & Forecast, by Process, 2020−2027
    91.                                      8.5.4.3   Market Estimates & Forecast, by Application, 2020−2027
    92.                           8.5.5   Israel
    93.                                       8.5.5.1   Market Estimates & Forecast, 2020−2027
    94.                                       8.5.5.2   Market Estimates & Forecast, by Process, 2020−2027
    95.                                       8.5.5.3   Market Estimates & Forecast, by Application, 2020−2027
    96.                            8.5.6   North Africa 
    97.                                       8.5.6.1   Market Estimates & Forecast, 2020−2027
    98.                                       8.5.6.2   Market Estimates & Forecast, by Process, 2020−2027
    99.                                       8.5.6.3   Market Estimates & Forecast, by Application, 2020−2027
    100.                            8.5.7   Turkey
    101.                                       8.5.7.1   Market Estimates & Forecast, 2020−2027
    102.                                       8.5.7.2   Market Estimates & Forecast, by Process, 2020−2027
    103.                                       8.5.7.3   Market Estimates & Forecast, by Application, 2020−2027
    104.                           8.5.8   Rest of Middle East & Africa 
    105.                                       8.5.8.1   Market Estimates & Forecast, 2020−2027
    106.                                       8.5.8.2   Market Estimates & Forecast, by Process, 2020−2027
    107.                                       8.5.8.3   Market Estimates & Forecast, by Application, 2020−2027
      1.     Latin America
    108.                           8.6.1   Market Estimates & Forecast, 2020−2027
    109.                           8.6.2   Market Estimates & Forecast, by Process, 2020−2027
    110.                           8.6.3   Market Estimates & Forecast, by Application, 2020−2027
    111.                           8.6.4    Brazil 
    112.                                       8.6.4.1   Market Estimates & Forecast, 2020−2027
    113.                                       8.6.4.2   Market Estimates & Forecast, by Process, 2020−2027
    114.                                       8.6.4.3   Market Estimates & Forecast, by Application, 2020−2027
    115.                            8.6.5   Argentina 
    116.                                       8.6.5.1   Market Estimates & Forecast, 2020−2027
    117.                                       8.6.5.2   Market Estimates & Forecast, by Process, 2020−2027
    118.                                       8.6.5.3   Market Estimates & Forecast, by Application, 2020−2027
    119.                            8.6.6   Mexico 
    120.                                       8.6.6.1   Market Estimates & Forecast, 2020−2027
    121.                                       8.6.6.2   Market Estimates & Forecast, by Process, 2020−2027
    122.                                       8.6.6.3   Market Estimates & Forecast, by Application, 2020−2027
    123.                            8.6.7   Rest of Latin America 
    124.                                       8.6.7.1   Market Estimates & Forecast, 2020−2027
    125.                                       8.6.7.2   Market Estimates & Forecast, by Process, 2020−2027
    126.                                       8.6.7.3   Market Estimates & Forecast, by Application, 2020−2027
    127.     Company Landscape
    128.     9.1    Introduction
    129.     9.2    Market Strategy
      1.       Key Development Analysis (Expansion/Merger & Acquisitions/Joint Venture/New Product   Development/Agreement/Investment)
    130.     Company Profiles    
      1.     GFS Chemicals Inc
    131.              10.1.1       Company Overview
      1.        Financial Updates    
        1.        Product/Business Segment Overview 
        2.        Key Developments 
        3.        SWOT Analysis
        4.        Strategy
    132.  10.2    Rural Liquid Fertilizers
      1.        Company Overview
        1.        Financial Updates    
        2.        Product/Business Segment Overview 
        3.        Key Developments 
        4.        SWOT Analysis
        5.        Strategy
      2.     Haifa Chemicals Ltd
    133.              10.1       Company Overview
      1.        Financial Updates    
        1.        Product/Business Segment Overview 
        2.        Key Developments 
        3.        SWOT Analysis
        4.        Strategy
      2.     Nutrien Ltd
    134.              10.4.1       Company Overview
      1.        Financial Updates    
        1.        Product/Business Segment Overview 
        2.        Key Developments 
        3.        SWOT Analysis
        4.        Strategy
      2.     Prathista Industries Limited
    135.              10.5.1       Company Overview
      1.        Financial Updates    
        1.        Product/Business Segment Overview 
        2.        Key Developments 
        3.        SWOT Analysis
        4.        Strategy
      2.     Sterling Chemicals & Alcohols Limited      
        1.        Company Overview
        2.        Financial Updates    
        3.        Product/Business Segment Overview 
        4.        Key Developments 
        5.        SWOT Analysis
        6.        Strategy
      3.     Yara International ASA
        1.        Company Overview
        2.        Financial Updates    
        3.        Product/Business Segment Overview 
        4.        Key Developments 
        5.        SWOT Analysis
        6.        Strategy
      4.     Swiss Formulations India
        1.        Company Overview
        2.        Financial Updates   
        3.        Product/Business Segment Overview 
        4.        Key Developments 
        5.        SWOT Analysis
        6.        Strategy
    136.     10.9    Uralchem Holding PLC
    137.                    10.9.1       Company Overview
      1.        Financial Updates    
        1.        Product/Business Segment Overview 
        2.        Key Developments 
        3.        SWOT Analysis
        4.        Strategy
      2.     Blue Line Corporation
    138.              10.10.1       Company Overview
      1.        Financial Updates    
        1.        Product/Business Segment Overview 
        2.        Key Developments 
        3.        SWOT Analysis
        4.        Strategy
    139.     Conclusion
    140. List of Tables and Figures
      1. LIST OF TABLES     
      2. Table 1    Global Calcium Nitrate Market: by Region, 2020−2027
      3. Table 2    North America: Calcium Nitrate Market, by Country, 2020−2027
      4. Table 3    Europe: Calcium Nitrate Market, by Country, 2020−2027
      5. Table 4    Asia-Pacific: Calcium Nitrate Market. by Country, 2020−2027
      6. Table 5    Middle East & Africa: Calcium Nitrate Market, by Country, 2020−2027
      7. Table 6    Latin America: Calcium Nitrate Market, by Country, 2020−2027
      8. Table 7    Global Calcium Nitrate Process Market, by Region, 2020−2027
      9. Table 8    North America: Calcium Nitrate Process Market, by Country, 2020−2027
      10. Table 9    Europe: Calcium Nitrate Process Market, by Country, 2020−2027 Table10    Asia-Pacific: Calcium Nitrate Process Market, by Country, 2020−2027 Table11    Middle East & Africa: Calcium Nitrate Process Market, by Country, 2020−2027 Table12    Latin America: Calcium Nitrate Process Market, by Country, 2020−2027 Table13    Global Calcium Nitrate Application Market, by Regions, 2020−2027 Table14    North America: Calcium Nitrate Application Market, by Country, 2020−2027 Table15    Europe: Calcium Nitrate Application Market, by Country, 2020−2027 Table16    Asia-Pacific: Calcium Nitrate Application Market, by Country, 2020−2027 Table17    Middle East & Africa: Calcium Nitrate Application Market, by Country, 2020−2027 Table18    Latin America: Calcium Nitrate by Application Market, by Country, 2020-2023  Table19    Global Process Market, by Region, 2020−2027 Table20    Global Application Market, by Region, 2020−2027 Table21    North America: Calcium Nitrate Market, by Country, 2020−2027  Table22    North America: Calcium Nitrate Market, by Process, 2020−2027 Table23    North America: Calcium Nitrate Market, by Application, 2020−2027  Table24    Europe: Calcium Nitrate Market, by Country, 2020−2027 Table25    Europe: Calcium Nitrate Market, by Process, 2020−2027  Table26    Europe: Calcium Nitrate Market, by Application, 2020−2027   Table27    Asia-Pacific: Calcium Nitrate Market, by Country, 2020−2027   Table28    Asia-Pacific: Calcium Nitrate Market, by Process, 2020−2027 Table29    Asia-Pacific: Calcium Nitrate Market, by Application, 2020−2027   Table30    Middle East & Africa: Calcium Nitrate Market, by Country, 2020−2027 Table31    Middle East & Africa: Calcium Nitrate Market, by Process, 2020−2027   Table32    Middle East & Africa: Calcium Nitrate Market, by Application, 2020−2027  Table3.3    Latin America: Calcium Nitrate Market, by Country, 2020−2027   Table34    Latin America: Calcium Nitrate Market, by Process, 2020−2027 Table35    Latin America: Calcium Nitrate Market, by Application, 2020−2027   LIST OF FIGURES
      11. FIGURE 1     Global Calcium Nitrate Market Segmentation
      12. FIGURE 2     Forecast Research Methodology
      13. FIGURE 3     Five Forces Analysis of Global Calcium Nitrate Market
      14. FIGURE 4     Value Chain of Global Calcium Nitrate Market
      15. FIGURE 5     Global Calcium Nitrate Market, 2020−2027, by Country, 2020
      16. FIGURE 6    Share of Global Calcium Nitrate Market, by Country, 2020−2027
      17. FIGURE 7    Global Calcium Nitrate Market Size, by Process, 2020
      18. FIGURE 8    Share of Global Calcium Nitrate Market, by Process, 2020−2027
      19. FIGURE 9    Global Calcium Nitrate Market Size, by Application, 2020 FIGURE10   Share of Global Calcium Nitrate Market, by Application, 2020−2027

    Calcium Nitrate Market Segmentation

    Market Segmentation Overview

    • Detailed segmentation data will be available in the full report
    • Comprehensive analysis by multiple parameters
    • Regional and country-level breakdowns
    • Market size forecasts by segment
    Infographic

    Free Sample Request

    Kindly complete the form below to receive a free sample of this Report

    Get Free Sample

    Customer Strories

    “I am very pleased with how market segments have been defined in a relevant way for my purposes (such as "Portable Freezers & refrigerators" and "last-mile"). In general the report is well structured. Thanks very much for your efforts.”

    Victoria Milne

    Founder
    Case Study
    Chemicals and Materials