×
Hero Background
English
Chinese
French
Japanese
Korean
German
Spanish

Coal Tar Pitch Market Size

ID: MRFR/CnM/9980-CR
118 Pages
Chitranshi Jaiswal
May 2025

Coal Tar Pitch Market Research Report Information by Grade (Aluminum Grade, Graphite Grade and Special Grade), By Application (Aluminium Smelting, Graphite Electrodes, Roofing, Carbon Fiber, Refractories and Other) and Region (North America, Europe, Asia-Pacific, Middle East & Africa, and South America) - Forecast till 2035

Share:
Download PDF ×

We do not share your information with anyone. However, we may send you emails based on your report interest from time to time. You may contact us at any time to opt-out.

Coal Tar Pitch Market Infographic
Purchase Options

Coal Tar Pitch Size

Coal Tar Pitch Market Growth Projections and Opportunities

The coal tar pitch market is influenced by several key factors that shape its growth and dynamics. One significant driver is the demand for coal tar pitch in the aluminum smelting industry. Coal tar pitch is a crucial raw material used in the production of carbon anodes, which are essential components in the electrolytic process of aluminum production. As global demand for aluminum continues to rise, particularly in industries such as automotive, construction, and packaging, there is a growing need for coal tar pitch to manufacture high-quality carbon anodes, driving market growth.

Additionally, infrastructure development projects and construction activities contribute to the demand for coal tar pitch. Coal tar pitch is used in the construction industry as a binder and waterproofing agent in the production of asphalt and roofing materials. With rapid urbanization and industrialization in emerging economies, there is a significant demand for infrastructure development, driving the need for coal tar pitch in road construction, roofing applications, and waterproofing solutions, thereby fueling market growth.

Moreover, the growing demand for specialty chemicals and high-performance materials influences the coal tar pitch market. Coal tar pitch is used as a precursor in the production of various specialty chemicals, including carbon fibers, electrodes, and coatings. These specialty chemicals find applications in industries such as aerospace, defense, electronics, and automotive, where high-performance materials are required. As industries continue to innovate and demand advanced materials with superior properties, the demand for coal tar pitch as a raw material for specialty chemical production grows, driving market demand.

Furthermore, regulatory compliance and environmental concerns impact the coal tar pitch market. Environmental regulations restrict the use of certain chemicals and emissions from industrial processes, including coal tar distillation. Manufacturers must adhere to stringent environmental regulations and invest in pollution control technologies to minimize environmental impact and ensure compliance with regulatory requirements. Additionally, increasing awareness of environmental sustainability drives market demand for alternative raw materials and cleaner production methods, influencing the dynamics of the coal tar pitch market.

Additionally, the availability and cost of raw materials such as coal tar, naphthalene, and other aromatic compounds influence the coal tar pitch market. Fluctuations in coal prices, supply chain disruptions, and changes in demand from other industries can impact production costs and profitability for coal tar pitch manufacturers. Companies must carefully monitor raw material markets, optimize procurement processes, and implement strategies to mitigate risks and maintain a competitive advantage in the market.

Moreover, technological advancements and innovations in coal tar distillation processes drive market growth by improving efficiency, yield, and product quality. Manufacturers are investing in research and development to develop advanced distillation technologies, catalysts, and process optimization techniques to enhance the production of coal tar pitch. Additionally, innovations in carbonization and graphitization processes enable the production of high-quality carbon materials from coal tar pitch, expanding its application possibilities and driving market demand.

Furthermore, the competitive landscape and market dynamics play a significant role in shaping the coal tar pitch market. Intense competition among key players prompts manufacturers to focus on product differentiation, innovation, and operational excellence to gain a competitive edge. Strategic partnerships, mergers, and acquisitions are common strategies adopted by companies to expand their market presence, diversify their product portfolios, and enhance their competitive positioning in the market.
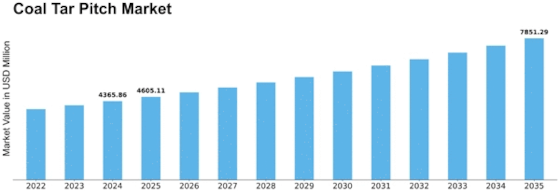
 

Coal Tar Pitch Market Size Graph
Author
Chitranshi Jaiswal
Research Analyst Level I

In her 3 years of experience in the market research field, she has handled critical cross-domain projects. She has an in-depth knowledge of market estimation & analysis, problem-solving, primary as well as secondary research, and team management.She holds an engineering degree and is an MBA professional from a well-known university, capable of evaluating the market and competitive conditions. An exceptional strategist with excellent communication skills and a passion for delivering cutting-edge & practical insights for the market. Proficient in multi-tasking, and can successfully deal with competing demands, while maintaining complete confidentiality. Generated business through active client and project development, networking, and high-quality responses. Her knowledge and skills have helped in making solid business decisions, securing funding from investors, and avoiding business failures.

Leave a Comment

FAQs

What is the current valuation of the Coal Tar Pitch Market as of 2024?

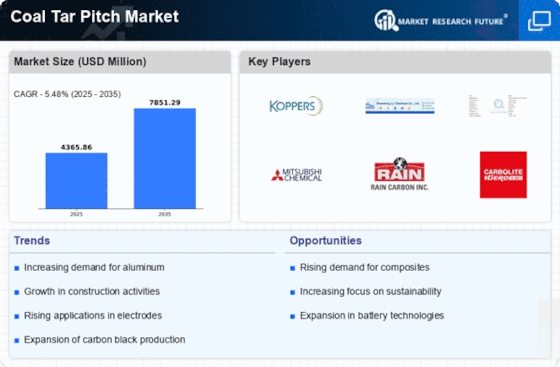
The Coal Tar Pitch Market was valued at approximately 4365.86 USD Million in 2024.

What is the projected market valuation for the Coal Tar Pitch Market in 2035?

The market is projected to reach a valuation of around 7851.29 USD Million by 2035.

What is the expected CAGR for the Coal Tar Pitch Market during the forecast period 2025 - 2035?

The expected CAGR for the Coal Tar Pitch Market during the forecast period 2025 - 2035 is 5.48%.

Which companies are considered key players in the Coal Tar Pitch Market?

Key players in the market include Koppers Inc, Shandong Batai Chemical Co Ltd, Jiangsu Jincheng Chemical Co Ltd, Mitsubishi Chemical Corporation, Rain Carbon Inc, Carbolite Gero GmbH, Himadri Speciality Chemical Ltd, and Daihatsu Chemical Co Ltd.

What are the main segments of the Coal Tar Pitch Market based on grade?

The main segments based on grade include Aluminum Grade, Graphite Grade, Special Grade, and Three Phase, with valuations ranging from 800.0 to 3151.29 USD Million.

Market Summary

As per MRFR analysis, the Coal Tar Pitch Market Size was estimated at 4365.86 USD Million in 2024. The Coal Tar Pitch industry is projected to grow from 4605.11 in 2025 to 7851.29 by 2035, exhibiting a compound annual growth rate (CAGR) of 5.48 during the forecast period 2025 - 2035.

Key Market Trends & Highlights

The Coal Tar Pitch Market is poised for growth driven by sustainability and technological advancements.

  • North America remains the largest market for coal tar pitch, primarily due to its extensive aluminum industry.
  • Asia-Pacific is emerging as the fastest-growing region, fueled by rapid infrastructure development and urbanization.
  • The aluminum grade segment dominates the market, while the graphite grade segment is witnessing the highest growth rates.
  • Rising demand from the aluminum industry and regulatory support for sustainable practices are key drivers propelling market expansion.

Market Size & Forecast

2024 Market Size 4365.86 (USD Million)
2035 Market Size 7851.29 (USD Million)
CAGR (2025 - 2035) 5.48%
Largest Regional Market Share in 2024 Asia Pacific

Major Players

<p>Koppers Inc (US), Shandong Batai Chemical Co Ltd (CN), Jiangsu Jincheng Chemical Co Ltd (CN), Mitsubishi Chemical Corporation (JP), Rain Carbon Inc (US), Carbolite Gero GmbH (DE), Himadri Speciality Chemical Ltd (IN), Daihatsu Chemical Co Ltd (JP)</p>

Market Trends

The Coal Tar Pitch Market is currently experiencing a dynamic phase characterized by evolving applications and increasing demand across various industries. This material, derived from the carbonization of coal, serves as a crucial component in the production of aluminum, electrodes, and roofing materials. The market appears to be influenced by a growing emphasis on sustainable practices, prompting manufacturers to explore eco-friendly alternatives and innovative production methods. As industries seek to reduce their carbon footprint, the Coal Tar Pitch Market may witness a shift towards more sustainable sourcing and processing techniques, potentially reshaping the competitive landscape. Moreover, the global push for infrastructure development and urbanization is likely to bolster the demand for coal tar pitch in construction and related sectors. The material's unique properties, such as its durability and resistance to weathering, make it an attractive choice for various applications. However, challenges related to environmental regulations and health concerns surrounding coal tar pitch production could pose hurdles for market participants. Stakeholders in the Coal Tar Pitch Market must navigate these complexities while capitalizing on emerging opportunities to ensure sustained growth and innovation in the coming years.

Sustainability Initiatives

The Coal Tar Pitch Market is increasingly influenced by sustainability initiatives, as stakeholders seek to minimize environmental impact. This trend may lead to the development of greener production methods and alternative materials, potentially reshaping the market landscape.

Infrastructure Development

Ongoing infrastructure development projects worldwide are likely to drive demand for coal tar pitch. Its properties make it suitable for various applications in construction, suggesting a robust growth trajectory in this sector.

Technological Advancements

Technological advancements in production processes could enhance the efficiency and quality of coal tar pitch. Innovations may lead to improved product characteristics, thereby expanding its applications across different industries.

Coal Tar Pitch Market Market Drivers

Expansion of Construction Activities

The Coal Tar Pitch Market is significantly influenced by the expansion of construction activities across various regions. As urbanization accelerates, the demand for construction materials and infrastructure development rises, leading to an increased requirement for coal tar pitch. This material is utilized in the production of roofing, paving, and other construction applications, making it a vital component in the construction sector. Recent data indicates that the construction industry is projected to grow at a compound annual growth rate of around 5% over the next few years. This growth is expected to drive the demand for coal tar pitch, as it plays a crucial role in enhancing the durability and performance of construction materials. Consequently, the expansion of construction activities is likely to serve as a significant driver for the coal tar pitch market.

Rising Demand from Aluminum Industry

The Coal Tar Pitch Market experiences a notable surge in demand primarily driven by the aluminum sector. As aluminum production relies heavily on coal tar pitch as a binder in the production of anodes, the growth of the aluminum industry directly influences the coal tar pitch market. In recent years, the aluminum production has seen a steady increase, with estimates suggesting a growth rate of approximately 4% annually. This trend indicates a robust demand for coal tar pitch, as it is essential for the efficient functioning of aluminum smelting processes. Furthermore, the increasing applications of aluminum in various sectors, including automotive and construction, further bolster the coal tar pitch market. As the aluminum industry continues to expand, the coal tar pitch market is likely to benefit significantly from this upward trajectory.

Technological Innovations in Production

Technological advancements in the production processes of coal tar pitch are emerging as a key driver for the Coal Tar Pitch Market. Innovations aimed at improving the efficiency and sustainability of coal tar pitch production are gaining traction. For instance, the implementation of advanced distillation techniques and the use of alternative feedstocks are being explored to enhance yield and reduce environmental impact. These innovations not only improve the quality of coal tar pitch but also align with the growing emphasis on sustainable practices within the industry. As companies adopt these technologies, the overall production capacity of coal tar pitch is expected to increase, potentially leading to a more competitive market landscape. This focus on technological innovations is likely to play a pivotal role in shaping the future of the coal tar pitch market.

Increasing Applications in Carbon Products

The Coal Tar Pitch Market is witnessing a diversification of applications, particularly in the production of carbon products. Coal tar pitch serves as a critical raw material in the manufacturing of carbon electrodes, which are essential for various industrial processes, including steel production and aluminum smelting. The demand for carbon products is on the rise, driven by the increasing need for energy-efficient solutions in industrial applications. Recent estimates suggest that the carbon products market is expected to grow at a rate of approximately 6% annually. This growth is likely to enhance the demand for coal tar pitch, as manufacturers seek high-quality raw materials to meet the evolving needs of the carbon products sector. Consequently, the increasing applications of coal tar pitch in carbon products are poised to be a significant driver for the market.

Regulatory Support for Sustainable Practices

The Coal Tar Pitch Market is increasingly influenced by regulatory frameworks that promote sustainable practices. Governments and regulatory bodies are implementing policies aimed at reducing carbon emissions and encouraging the use of environmentally friendly materials. These regulations often create a favorable environment for the coal tar pitch market, as companies are incentivized to adopt sustainable production methods. Additionally, the push for sustainability is leading to increased research and development efforts focused on improving the environmental performance of coal tar pitch. As companies align their operations with regulatory requirements, the demand for sustainably produced coal tar pitch is likely to rise. This regulatory support for sustainable practices is expected to serve as a crucial driver for the coal tar pitch market, shaping its future trajectory.

Market Segment Insights

By Grade: Aluminum Grade (Largest) vs. Graphite Grade (Fastest-Growing)

<p>The Coal Tar Pitch Market is characterized by its diverse grades, with Aluminum Grade holding the largest market share. This segment is primarily driven by its extensive use in aluminum production and other industrial applications. Graphite Grade, while smaller in market size, is witnessing a rapid increase in demand due to its applications in the battery industry and other emerging technologies, positioning it as a key player in the growth of the market.</p>

<p>Aluminum Grade (Dominant) vs. Special Grade (Emerging)</p>

<p>Aluminum Grade is the dominant player in the Coal Tar Pitch Market, driven by its high purity and performance in various applications, primarily within the aluminum sector. It benefits from established production techniques and a consistent demand from industries requiring high-quality pitch for anodes in aluminum smelting. On the other hand, Special Grade is an emerging segment, known for its tailored properties suitable for niche applications in specialty products and unique industrial processes. While still in the growth phase, Special Grade is gradually carving out its market share by offering innovative solutions that cater to specific customer needs, thus enhancing its significance in the overall market landscape.</p>

By Application: Aluminium Smelting (Largest) vs. Graphite Electrodes (Fastest-Growing)

<p>In the Coal Tar Pitch Market, the application segment exhibits diverse characteristics, with Aluminium Smelting holding the largest share. Following closely behind are Graphite Electrodes, which have been rapidly gaining traction in recent years due to the increasing demand for electric arc furnace steel production and rechargeable batteries. Other significant applications include Roofing, Carbon Fiber, and Refractories, though they hold comparatively smaller shares in market distribution. Collectively, these segments demonstrate the versatility of coal tar pitch, driven by changing industrial needs and technological advancements. The growth trends within the application segment of the Coal Tar Pitch Market highlight the remarkable rise of Graphite Electrodes as the fastest-growing category. Factors propelling this growth include the surging global focus on electric vehicles and carbon-neutral technologies, which require advanced materials like graphite. Additionally, Aluminium Smelting remains a traditional stalwart in this market, but emerging applications such as Carbon Fiber and specialty Roofing solutions indicate a shifting landscape, where innovation and sustainability are increasingly prevalent drivers.</p>

<p>Aluminium Smelting (Dominant) vs. Roofing (Emerging)</p>

<p>The Aluminium Smelting application is the dominant force in the Coal Tar Pitch Market, leveraging its critical role in the production of high-quality aluminum metal. Its established presence is complemented by its compatibility with other materials and processes, making it a preferred choice for manufacturers. On the other hand, Roofing applications are emerging as significant players, driven by the increasing demand for energy-efficient roofing solutions and sustainable construction practices. While Aluminium Smelting ensures steady demand, Roofing applications are evolving, adopting innovative materials and technologies that enhance thermal performance and sustainability. The synergy between these two segments underscores a broader trend towards addressing environmental concerns and optimizing performance in industrial applications.</p>

Get more detailed insights about Coal Tar Pitch Market Research Report- Forecast to 2035

Regional Insights

North America : Energy Sector Leader

North America is witnessing robust growth in the coal tar pitch market, driven by increasing demand from the aluminum and graphite industries. The region holds approximately 40% of the global market share, making it the largest market. Regulatory support for sustainable practices and advancements in production technologies are further propelling growth. The U.S. is the primary contributor, followed by Canada, which is also expanding its production capabilities. The competitive landscape is dominated by key players such as Koppers Inc and Rain Carbon Inc, which are leveraging innovative technologies to enhance production efficiency. The presence of established companies ensures a stable supply chain, while ongoing investments in R&D are expected to foster new applications for coal tar pitch. This dynamic environment positions North America as a critical hub for market development.

Europe : Regulatory Framework Influence

Europe is emerging as a significant player in the coal tar pitch market, accounting for approximately 30% of the global share. The region's growth is primarily driven by stringent environmental regulations and a shift towards sustainable industrial practices. Countries like Germany and France are leading the charge, with policies that encourage the use of eco-friendly materials and processes, thus enhancing demand for coal tar pitch in various applications. The competitive landscape features prominent companies such as Carbolite Gero GmbH and Himadri Speciality Chemical Ltd, which are focusing on innovation and sustainability. The presence of these key players, along with supportive government initiatives, is fostering a conducive environment for market expansion. As Europe continues to prioritize sustainability, the coal tar pitch market is expected to thrive, aligning with broader environmental goals.

Asia-Pacific : Emerging Market Potential

Asia-Pacific is rapidly becoming a powerhouse in the coal tar pitch market, holding around 25% of the global share. The region's growth is fueled by increasing industrialization, particularly in countries like China and India, where demand for aluminum and carbon products is surging. Government initiatives aimed at boosting manufacturing capabilities and infrastructure development are also significant growth drivers, creating a favorable market environment. China is the largest market in the region, with companies like Shandong Batai Chemical Co Ltd and Jiangsu Jincheng Chemical Co Ltd leading the way. The competitive landscape is characterized by a mix of established players and emerging companies, all vying for market share. As the region continues to industrialize, the coal tar pitch market is expected to expand significantly, supported by ongoing investments in technology and production efficiency.

Middle East and Africa : Resource-Rich Opportunities

The Middle East and Africa region is witnessing a gradual increase in the coal tar pitch market, currently holding about 5% of the global share. The growth is primarily driven by the region's rich natural resources and increasing investments in the aluminum and construction sectors. Countries like South Africa and the UAE are focusing on enhancing their industrial capabilities, which is expected to boost demand for coal tar pitch in the coming years. The competitive landscape is still developing, with a few key players beginning to establish their presence. Local companies are exploring partnerships with international firms to enhance production and distribution capabilities. As the region continues to invest in infrastructure and industrial growth, the coal tar pitch market is poised for gradual expansion, aligning with broader economic development goals.

Key Players and Competitive Insights

Many global, regional, and local vendors characterize the Coal Tar Pitch Market. The market is highly competitive, with all the players competing to gain market share. Intense competition, rapid advances in technology, frequent changes in government policies, and environmental regulations are key factors that confront market growth. The vendors compete based on cost, product quality, reliability, and government regulations. Vendors must provide cost-efficient, high-quality products to survive and succeed in an intensely competitive market.

The major players in the market 3 M Company, Rain Carbon Inc., Mitsubishi Chemical Carbon Fiber and Composites (MCCFC), Himadri Speciality Chemical Ltd., DEZA A.S., Nippon Steel & Sumikin Chemical Co., China Steel Chemical Corporation (CSCC) are among others. The Coal Tar Pitch Market is a consolidated market due to increasing competition, acquisitions, mergers and other strategic market developments and decisions to improve operational effectiveness.

Key Companies in the Coal Tar Pitch Market market include

Industry Developments

Future Outlook

Coal Tar Pitch Market Future Outlook

<p>The Coal Tar Pitch Market is projected to grow at a 5.48% CAGR from 2024 to 2035, driven by increasing demand in aluminum production and road construction.</p>

New opportunities lie in:

  • <p>Expansion into emerging markets with high infrastructure needs.</p>
  • <p>Development of eco-friendly coal tar pitch alternatives.</p>
  • <p>Investment in advanced production technologies to enhance efficiency.</p>

<p>By 2035, the market is expected to solidify its position as a key player in industrial applications.</p>

Market Segmentation

Coal Tar Pitch Market Grade Outlook

  • Aluminum Grade
  • Graphite Grade
  • Special Grade
  • Three Phase

Coal Tar Pitch Market Application Outlook

  • Aluminium Smelting
  • Graphite Electrodes
  • Roofing
  • Carbon Fiber
  • Refractories
  • Other

Report Scope

MARKET SIZE 20244365.86(USD Million)
MARKET SIZE 20254605.11(USD Million)
MARKET SIZE 20357851.29(USD Million)
COMPOUND ANNUAL GROWTH RATE (CAGR)5.48% (2024 - 2035)
REPORT COVERAGERevenue Forecast, Competitive Landscape, Growth Factors, and Trends
BASE YEAR2024
Market Forecast Period2025 - 2035
Historical Data2019 - 2024
Market Forecast UnitsUSD Million
Key Companies ProfiledMarket analysis in progress
Segments CoveredMarket segmentation analysis in progress
Key Market OpportunitiesGrowing demand for sustainable materials in the Coal Tar Pitch Market presents significant opportunities for innovation.
Key Market DynamicsRising demand for lightweight materials drives innovation and competition in the Coal Tar Pitch Market.
Countries CoveredNorth America, Europe, APAC, South America, MEA

FAQs

What is the current valuation of the Coal Tar Pitch Market as of 2024?

The Coal Tar Pitch Market was valued at approximately 4365.86 USD Million in 2024.

What is the projected market valuation for the Coal Tar Pitch Market in 2035?

The market is projected to reach a valuation of around 7851.29 USD Million by 2035.

What is the expected CAGR for the Coal Tar Pitch Market during the forecast period 2025 - 2035?

The expected CAGR for the Coal Tar Pitch Market during the forecast period 2025 - 2035 is 5.48%.

Which companies are considered key players in the Coal Tar Pitch Market?

Key players in the market include Koppers Inc, Shandong Batai Chemical Co Ltd, Jiangsu Jincheng Chemical Co Ltd, Mitsubishi Chemical Corporation, Rain Carbon Inc, Carbolite Gero GmbH, Himadri Speciality Chemical Ltd, and Daihatsu Chemical Co Ltd.

What are the main segments of the Coal Tar Pitch Market based on grade?

The main segments based on grade include Aluminum Grade, Graphite Grade, Special Grade, and Three Phase, with valuations ranging from 800.0 to 3151.29 USD Million.

  1. SECTION I: EXECUTIVE SUMMARY AND KEY HIGHLIGHTS
    1. EXECUTIVE SUMMARY
      1. Market Overview
      2. Key Findings
      3. Market Segmentation
      4. Competitive Landscape
      5. Challenges and Opportunities
      6. Future Outlook
  2. SECTION II: SCOPING, METHODOLOGY AND MARKET STRUCTURE
    1. MARKET INTRODUCTION
      1. Definition
      2. Scope of the study
    2. RESEARCH METHODOLOGY
      1. Overview
      2. Data Mining
      3. Secondary Research
      4. Primary Research
      5. Forecasting Model
      6. Market Size Estimation
      7. Data Triangulation
      8. Validation
  3. SECTION III: QUALITATIVE ANALYSIS
    1. MARKET DYNAMICS
      1. Overview
      2. Drivers
      3. Restraints
      4. Opportunities
    2. MARKET FACTOR ANALYSIS
      1. Value chain Analysis
      2. Porter's Five Forces Analysis
      3. COVID-19 Impact Analysis
  4. SECTION IV: QUANTITATIVE ANALYSIS
    1. Chemicals and Materials, BY Grade (USD Million)
      1. Aluminum Grade
      2. Graphite Grade
      3. Special Grade
      4. Three Phase
    2. Chemicals and Materials, BY Application (USD Million)
      1. Aluminium Smelting
      2. Graphite Electrodes
      3. Roofing
      4. Carbon Fiber
      5. Refractories
      6. Other
    3. Chemicals and Materials, BY Region (USD Million)
      1. North America
      2. Europe
      3. APAC
      4. South America
      5. MEA
  5. SECTION V: COMPETITIVE ANALYSIS
    1. Competitive Landscape
      1. Overview
      2. Competitive Analysis
      3. Market share Analysis
      4. Major Growth Strategy in the Chemicals and Materials
      5. Competitive Benchmarking
      6. Leading Players in Terms of Number of Developments in the Chemicals and Materials
      7. Key developments and growth strategies
      8. Major Players Financial Matrix
    2. Company Profiles
      1. Koppers Inc (US)
      2. Shandong Batai Chemical Co Ltd (CN)
      3. Jiangsu Jincheng Chemical Co Ltd (CN)
      4. Mitsubishi Chemical Corporation (JP)
      5. Rain Carbon Inc (US)
      6. Carbolite Gero GmbH (DE)
      7. Himadri Speciality Chemical Ltd (IN)
      8. Daihatsu Chemical Co Ltd (JP)
    3. Appendix
      1. References
      2. Related Reports
  6. LIST OF FIGURES
    1. MARKET SYNOPSIS
    2. NORTH AMERICA MARKET ANALYSIS
    3. US MARKET ANALYSIS BY GRADE
    4. US MARKET ANALYSIS BY APPLICATION
    5. CANADA MARKET ANALYSIS BY GRADE
    6. CANADA MARKET ANALYSIS BY APPLICATION
    7. EUROPE MARKET ANALYSIS
    8. GERMANY MARKET ANALYSIS BY GRADE
    9. GERMANY MARKET ANALYSIS BY APPLICATION
    10. UK MARKET ANALYSIS BY GRADE
    11. UK MARKET ANALYSIS BY APPLICATION
    12. FRANCE MARKET ANALYSIS BY GRADE
    13. FRANCE MARKET ANALYSIS BY APPLICATION
    14. RUSSIA MARKET ANALYSIS BY GRADE
    15. RUSSIA MARKET ANALYSIS BY APPLICATION
    16. ITALY MARKET ANALYSIS BY GRADE
    17. ITALY MARKET ANALYSIS BY APPLICATION
    18. SPAIN MARKET ANALYSIS BY GRADE
    19. SPAIN MARKET ANALYSIS BY APPLICATION
    20. REST OF EUROPE MARKET ANALYSIS BY GRADE
    21. REST OF EUROPE MARKET ANALYSIS BY APPLICATION
    22. APAC MARKET ANALYSIS
    23. CHINA MARKET ANALYSIS BY GRADE
    24. CHINA MARKET ANALYSIS BY APPLICATION
    25. INDIA MARKET ANALYSIS BY GRADE
    26. INDIA MARKET ANALYSIS BY APPLICATION
    27. JAPAN MARKET ANALYSIS BY GRADE
    28. JAPAN MARKET ANALYSIS BY APPLICATION
    29. SOUTH KOREA MARKET ANALYSIS BY GRADE
    30. SOUTH KOREA MARKET ANALYSIS BY APPLICATION
    31. MALAYSIA MARKET ANALYSIS BY GRADE
    32. MALAYSIA MARKET ANALYSIS BY APPLICATION
    33. THAILAND MARKET ANALYSIS BY GRADE
    34. THAILAND MARKET ANALYSIS BY APPLICATION
    35. INDONESIA MARKET ANALYSIS BY GRADE
    36. INDONESIA MARKET ANALYSIS BY APPLICATION
    37. REST OF APAC MARKET ANALYSIS BY GRADE
    38. REST OF APAC MARKET ANALYSIS BY APPLICATION
    39. SOUTH AMERICA MARKET ANALYSIS
    40. BRAZIL MARKET ANALYSIS BY GRADE
    41. BRAZIL MARKET ANALYSIS BY APPLICATION
    42. MEXICO MARKET ANALYSIS BY GRADE
    43. MEXICO MARKET ANALYSIS BY APPLICATION
    44. ARGENTINA MARKET ANALYSIS BY GRADE
    45. ARGENTINA MARKET ANALYSIS BY APPLICATION
    46. REST OF SOUTH AMERICA MARKET ANALYSIS BY GRADE
    47. REST OF SOUTH AMERICA MARKET ANALYSIS BY APPLICATION
    48. MEA MARKET ANALYSIS
    49. GCC COUNTRIES MARKET ANALYSIS BY GRADE
    50. GCC COUNTRIES MARKET ANALYSIS BY APPLICATION
    51. SOUTH AFRICA MARKET ANALYSIS BY GRADE
    52. SOUTH AFRICA MARKET ANALYSIS BY APPLICATION
    53. REST OF MEA MARKET ANALYSIS BY GRADE
    54. REST OF MEA MARKET ANALYSIS BY APPLICATION
    55. KEY BUYING CRITERIA OF CHEMICALS AND MATERIALS
    56. RESEARCH PROCESS OF MRFR
    57. DRO ANALYSIS OF CHEMICALS AND MATERIALS
    58. DRIVERS IMPACT ANALYSIS: CHEMICALS AND MATERIALS
    59. RESTRAINTS IMPACT ANALYSIS: CHEMICALS AND MATERIALS
    60. SUPPLY / VALUE CHAIN: CHEMICALS AND MATERIALS
    61. CHEMICALS AND MATERIALS, BY GRADE, 2024 (% SHARE)
    62. CHEMICALS AND MATERIALS, BY GRADE, 2024 TO 2035 (USD Million)
    63. CHEMICALS AND MATERIALS, BY APPLICATION, 2024 (% SHARE)
    64. CHEMICALS AND MATERIALS, BY APPLICATION, 2024 TO 2035 (USD Million)
    65. BENCHMARKING OF MAJOR COMPETITORS
  7. LIST OF TABLES
    1. LIST OF ASSUMPTIONS
    2. North America MARKET SIZE ESTIMATES; FORECAST
      1. BY GRADE, 2025-2035 (USD Million)
      2. BY APPLICATION, 2025-2035 (USD Million)
    3. US MARKET SIZE ESTIMATES; FORECAST
      1. BY GRADE, 2025-2035 (USD Million)
      2. BY APPLICATION, 2025-2035 (USD Million)
    4. Canada MARKET SIZE ESTIMATES; FORECAST
      1. BY GRADE, 2025-2035 (USD Million)
      2. BY APPLICATION, 2025-2035 (USD Million)
    5. Europe MARKET SIZE ESTIMATES; FORECAST
      1. BY GRADE, 2025-2035 (USD Million)
      2. BY APPLICATION, 2025-2035 (USD Million)
    6. Germany MARKET SIZE ESTIMATES; FORECAST
      1. BY GRADE, 2025-2035 (USD Million)
      2. BY APPLICATION, 2025-2035 (USD Million)
    7. UK MARKET SIZE ESTIMATES; FORECAST
      1. BY GRADE, 2025-2035 (USD Million)
      2. BY APPLICATION, 2025-2035 (USD Million)
    8. France MARKET SIZE ESTIMATES; FORECAST
      1. BY GRADE, 2025-2035 (USD Million)
      2. BY APPLICATION, 2025-2035 (USD Million)
    9. Russia MARKET SIZE ESTIMATES; FORECAST
      1. BY GRADE, 2025-2035 (USD Million)
      2. BY APPLICATION, 2025-2035 (USD Million)
    10. Italy MARKET SIZE ESTIMATES; FORECAST
      1. BY GRADE, 2025-2035 (USD Million)
      2. BY APPLICATION, 2025-2035 (USD Million)
    11. Spain MARKET SIZE ESTIMATES; FORECAST
      1. BY GRADE, 2025-2035 (USD Million)
      2. BY APPLICATION, 2025-2035 (USD Million)
    12. Rest of Europe MARKET SIZE ESTIMATES; FORECAST
      1. BY GRADE, 2025-2035 (USD Million)
      2. BY APPLICATION, 2025-2035 (USD Million)
    13. APAC MARKET SIZE ESTIMATES; FORECAST
      1. BY GRADE, 2025-2035 (USD Million)
      2. BY APPLICATION, 2025-2035 (USD Million)
    14. China MARKET SIZE ESTIMATES; FORECAST
      1. BY GRADE, 2025-2035 (USD Million)
      2. BY APPLICATION, 2025-2035 (USD Million)
    15. India MARKET SIZE ESTIMATES; FORECAST
      1. BY GRADE, 2025-2035 (USD Million)
      2. BY APPLICATION, 2025-2035 (USD Million)
    16. Japan MARKET SIZE ESTIMATES; FORECAST
      1. BY GRADE, 2025-2035 (USD Million)
      2. BY APPLICATION, 2025-2035 (USD Million)
    17. South Korea MARKET SIZE ESTIMATES; FORECAST
      1. BY GRADE, 2025-2035 (USD Million)
      2. BY APPLICATION, 2025-2035 (USD Million)
    18. Malaysia MARKET SIZE ESTIMATES; FORECAST
      1. BY GRADE, 2025-2035 (USD Million)
      2. BY APPLICATION, 2025-2035 (USD Million)
    19. Thailand MARKET SIZE ESTIMATES; FORECAST
      1. BY GRADE, 2025-2035 (USD Million)
      2. BY APPLICATION, 2025-2035 (USD Million)
    20. Indonesia MARKET SIZE ESTIMATES; FORECAST
      1. BY GRADE, 2025-2035 (USD Million)
      2. BY APPLICATION, 2025-2035 (USD Million)
    21. Rest of APAC MARKET SIZE ESTIMATES; FORECAST
      1. BY GRADE, 2025-2035 (USD Million)
      2. BY APPLICATION, 2025-2035 (USD Million)
    22. South America MARKET SIZE ESTIMATES; FORECAST
      1. BY GRADE, 2025-2035 (USD Million)
      2. BY APPLICATION, 2025-2035 (USD Million)
    23. Brazil MARKET SIZE ESTIMATES; FORECAST
      1. BY GRADE, 2025-2035 (USD Million)
      2. BY APPLICATION, 2025-2035 (USD Million)
    24. Mexico MARKET SIZE ESTIMATES; FORECAST
      1. BY GRADE, 2025-2035 (USD Million)
      2. BY APPLICATION, 2025-2035 (USD Million)
    25. Argentina MARKET SIZE ESTIMATES; FORECAST
      1. BY GRADE, 2025-2035 (USD Million)
      2. BY APPLICATION, 2025-2035 (USD Million)
    26. Rest of South America MARKET SIZE ESTIMATES; FORECAST
      1. BY GRADE, 2025-2035 (USD Million)
      2. BY APPLICATION, 2025-2035 (USD Million)
    27. MEA MARKET SIZE ESTIMATES; FORECAST
      1. BY GRADE, 2025-2035 (USD Million)
      2. BY APPLICATION, 2025-2035 (USD Million)
    28. GCC Countries MARKET SIZE ESTIMATES; FORECAST
      1. BY GRADE, 2025-2035 (USD Million)
      2. BY APPLICATION, 2025-2035 (USD Million)
    29. South Africa MARKET SIZE ESTIMATES; FORECAST
      1. BY GRADE, 2025-2035 (USD Million)
      2. BY APPLICATION, 2025-2035 (USD Million)
    30. Rest of MEA MARKET SIZE ESTIMATES; FORECAST
      1. BY GRADE, 2025-2035 (USD Million)
      2. BY APPLICATION, 2025-2035 (USD Million)
    31. PRODUCT LAUNCH/PRODUCT DEVELOPMENT/APPROVAL
    32. ACQUISITION/PARTNERSHIP

Global Outlook (USD Million, 2019-2035)

Global Coal Tar Pitch, By Grade (USD Million, 2019-2035)

  • Aluminium Grade
  • Graphite Grade
  • Special Grade

Global Coal Tar Pitch, By Application (USD Million, 2019-2035)

  • Aluminium Smelting
  • Graphite Electrodes
  • Roofing
  • Carbon Fiber
  • Refractories

North America Outlook (USD Million, 2019-2035)

North America Coal Tar Pitch, By Grade (USD Million, 2019-2035)

  • Aluminium Grade
  • Graphite Grade
  • Special Grade

North America Coal Tar Pitch, By Application (USD Million, 2019-2035)

  • Aluminium Smelting
  • Graphite Electrodes
  • Roofing
  • Carbon Fiber
  • Refractories

US Outlook (USD Million, 2019-2035)

US Coal Tar Pitch, By Grade (USD Million, 2019-2035)

  • Aluminium Grade
  • Graphite Grade
  • Special Grade

US Coal Tar Pitch, By Application (USD Million, 2019-2035)

  • Aluminium Smelting
  • Graphite Electrodes
  • Roofing
  • Carbon Fiber
  • Refractories

Canada Outlook (USD Million, 2019-2035)

Canada Coal Tar Pitch, By Grade (USD Million, 2019-2035)

  • Aluminium Grade
  • Graphite Grade
  • Special Grade

Canada Coal Tar Pitch, By Application (USD Million, 2019-2035)

  • Aluminium Smelting
  • Graphite Electrodes
  • Roofing
  • Carbon Fiber
  • Refractories

Mexico Outlook (USD Million, 2019-2035)

Mexico Coal Tar Pitch, By Grade (USD Million, 2019-2035)

  • Aluminium Grade
  • Graphite Grade
  • Special Grade

Mexico Coal Tar Pitch, By Application (USD Million, 2019-2035)

  • Aluminium Smelting
  • Graphite Electrodes
  • Roofing
  • Carbon Fiber
  • Refractories

Europe Outlook (USD Million, 2019-2035)

Europe Coal Tar Pitch, By Grade (USD Million, 2019-2035)

  • Aluminium Grade
  • Graphite Grade
  • Special Grade

Europe Coal Tar Pitch, By Application (USD Million, 2019-2035)

  • Aluminium Smelting
  • Graphite Electrodes
  • Roofing
  • Carbon Fiber
  • Refractories

Germany Outlook (USD Million, 2019-2035)

Germany Coal Tar Pitch, By Grade (USD Million, 2019-2035)

  • Aluminium Grade
  • Graphite Grade
  • Special Grade

Germany Coal Tar Pitch, By Application (USD Million, 2019-2035)

  • Aluminium Smelting
  • Graphite Electrodes
  • Roofing
  • Carbon Fiber
  • Refractories

UK Outlook (USD Million, 2019-2035)

UK Coal Tar Pitch, By Grade (USD Million, 2019-2035)

  • Aluminium Grade
  • Graphite Grade
  • Special Grade

UK Coal Tar Pitch, By Application (USD Million, 2019-2035)

  • Aluminium Smelting
  • Graphite Electrodes
  • Roofing
  • Carbon Fiber
  • Refractories

France Outlook (USD Million, 2019-2035)

France Coal Tar Pitch, By Grade (USD Million, 2019-2035)

  • Aluminium Grade
  • Graphite Grade
  • Special Grade

France Coal Tar Pitch, By Application (USD Million, 2019-2035)

  • Aluminium Smelting
  • Graphite Electrodes
  • Roofing
  • Carbon Fiber
  • Refractories

Italy Outlook (USD Million, 2019-2035)

Italy Coal Tar Pitch, By Grade (USD Million, 2019-2035)

  • Aluminium Grade
  • Graphite Grade
  • Special Grade

Italy Coal Tar Pitch, By Application (USD Million, 2019-2035)

  • Aluminium Smelting
  • Graphite Electrodes
  • Roofing
  • Carbon Fiber
  • Refractories

Spain Outlook (USD Million, 2019-2035)

Spain Coal Tar Pitch, By Grade (USD Million, 2019-2035)

  • Aluminium Grade
  • Graphite Grade
  • Special Grade

Spain Coal Tar Pitch, By Application (USD Million, 2019-2035)

  • Aluminium Smelting
  • Graphite Electrodes
  • Roofing
  • Carbon Fiber
  • Refractories

Rest of Europe Outlook (USD Million, 2019-2035)

Rest of Europe Coal Tar Pitch, By Grade (USD Million, 2019-2035)

  • Aluminium Grade
  • Graphite Grade
  • Special Grade
  • Rest of Europe Coal Tar Pitch, By Application (USD Million, 2019-2035)
  • Aluminium Smelting
  • Graphite Electrodes
  • Roofing
  • Carbon Fiber
  • Refractories

Asia-Pacific Outlook (USD Million, 2019-2035)

Asia-Pacific Coal Tar Pitch, By Grade (USD Million, 2019-2035)

  • Aluminium Grade
  • Graphite Grade
  • Special Grade

Asia-Pacific Coal Tar Pitch, By Application (USD Million, 2019-2035)

  • Aluminium Smelting
  • Graphite Electrodes
  • Roofing
  • Carbon Fiber
  • Refractories

Japan Outlook (USD Million, 2019-2035)

Japan Coal Tar Pitch, By Grade (USD Million, 2019-2035)

  • Aluminium Grade
  • Graphite Grade
  • Special Grade

Japan Coal Tar Pitch, By Application (USD Million, 2019-2035)

  • Aluminium Smelting
  • Graphite Electrodes
  • Roofing
  • Carbon Fiber
  • Refractories

China Outlook (USD Million, 2019-2035)

China Coal Tar Pitch, By Grade (USD Million, 2019-2035)

  • Aluminium Grade
  • Graphite Grade
  • Special Grade

China Coal Tar Pitch, By Application (USD Million, 2019-2035)

  • Aluminium Smelting
  • Graphite Electrodes
  • Roofing
  • Carbon Fiber
  • Refractories

India Outlook (USD Million, 2019-2035)

India Coal Tar Pitch, By Grade (USD Million, 2019-2035)

  • Aluminium Grade
  • Graphite Grade
  • Special Grade

India Coal Tar Pitch, By Application (USD Million, 2019-2035)

  • Aluminium Smelting
  • Graphite Electrodes
  • Roofing
  • Carbon Fiber
  • Refractories

Australia Outlook (USD Million, 2019-2035)

Australia Coal Tar Pitch, By Grade (USD Million, 2019-2035)

  • Aluminium Grade
  • Graphite Grade
  • Special Grade

Australia Coal Tar Pitch, By Application (USD Million, 2019-2035)

  • Aluminium Smelting
  • Graphite Electrodes
  • Roofing
  • Carbon Fiber
  • Refractories

Rest of Asia-Pacific Outlook (USD Million, 2019-2035)

Rest of Asia-Pacific Coal Tar Pitch, By Grade (USD Million, 2019-2035)

  • Aluminium Grade
  • Graphite Grade
  • Special Grade

Rest of Asia-Pacific Coal Tar Pitch, By Application (USD Million, 2019-2035)

  • Aluminium Smelting
  • Graphite Electrodes
  • Roofing
  • Carbon Fiber
  • Refractories

South America Outlook (USD Million, 2019-2035)

South America Coal Tar Pitch, By Grade (USD Million, 2019-2035)

  • Aluminium Grade
  • Graphite Grade
  • Special Grade

South America Coal Tar Pitch, By Application (USD Million, 2019-2035)

  • Aluminium Smelting
  • Graphite Electrodes
  • Roofing
  • Carbon Fiber
  • Refractories

Brazil Outlook (USD Million, 2019-2035)

Brazil Coal Tar Pitch, By Grade (USD Million, 2019-2035)

  • Aluminium Grade
  • Graphite Grade
  • Special Grade

Brazil Coal Tar Pitch, By Application (USD Million, 2019-2035)

  • Aluminium Smelting
  • Graphite Electrodes
  • Roofing
  • Carbon Fiber
  • Refractories

Colombia Outlook (USD Million, 2019-2035)

Colombia Coal Tar Pitch, By Grade (USD Million, 2019-2035)

  • Aluminium Grade
  • Graphite Grade
  • Special Grade

Colombia Coal Tar Pitch, By Application (USD Million, 2019-2035)

  • Aluminium Smelting
  • Graphite Electrodes
  • Roofing
  • Carbon Fiber
  • Refractories

Rest of South America Outlook (USD Million, 2019-2035)

Rest of South America Coal Tar Pitch, By Grade (USD Million, 2019-2035)

  • Aluminium Grade
  • Graphite Grade
  • Special Grade

Rest of South America Coal Tar Pitch, By Application (USD Million, 2019-2035)

  • Aluminium Smelting
  • Graphite Electrodes
  • Roofing
  • Carbon Fiber
  • Refractories

Middle East & Africa Outlook (USD Million, 2019-2035)

Middle East & Africa Coal Tar Pitch, By Grade (USD Million, 2019-2035)

  • Aluminium Grade
  • Graphite Grade
  • Special Grade

Middle East & Africa Coal Tar Pitch, By Application (USD Million, 2019-2035)

  • Aluminium Smelting
  • Graphite Electrodes
  • Roofing
  • Carbon Fiber
  • Refractories

South Africa Outlook (USD Million, 2019-2035)

South Africa Coal Tar Pitch, By Grade (USD Million, 2019-2035)

  • Aluminium Grade
  • Graphite Grade
  • Special Grade

South Africa Coal Tar Pitch, By Application (USD Million, 2019-2035)

  • Aluminium Smelting
  • Graphite Electrodes
  • Roofing
  • Carbon Fiber
  • Refractories

GCC Countries Outlook (USD Million, 2019-2035)

GCC Countries Coal Tar Pitch, By Grade (USD Million, 2019-2035)

  • Aluminium Grade
  • Graphite Grade
  • Special Grade

GCC Countries Coal Tar Pitch, By Application (USD Million, 2019-2035)

  • Aluminium Smelting
  • Graphite Electrodes
  • Roofing
  • Carbon Fiber
  • Refractories

Rest of Middle East & Africa Outlook (USD Million, 2019-2035)

Rest of Middle East & Africa Coal Tar Pitch, By Grade (USD Million, 2019-2035)

  • Aluminium Grade
  • Graphite Grade
  • Special Grade

Rest of Middle East & Africa Coal Tar Pitch, By Application (USD Million, 2019-2035)

Aluminium Smelting

Graphite Electrodes

Roofing

Carbon Fiber

Refractories

Infographic

Free Sample Request

Kindly complete the form below to receive a free sample of this Report

Get Free Sample

Customer Strories

“I am very pleased with how market segments have been defined in a relevant way for my purposes (such as "Portable Freezers & refrigerators" and "last-mile"). In general the report is well structured. Thanks very much for your efforts.”

Victoria Milne

Founder

Compare Licence

×
Features License Type
Single User Multiuser License Enterprise User
Price $4,950 $5,950 $7,250
Maximum User Access Limit 1 User Upto 10 Users Unrestricted Access Throughout the Organization
Free Customization
Direct Access to Analyst
Deliverable Format
Platform Access
Discount on Next Purchase 10% 15% 15%
Printable Versions