×
Hero Background
English
Chinese
French
Japanese
Korean
German
Spanish

Commodity Plastic Market Share

ID: MRFR/CnM/2054-CR
190 Pages
Anshula Mandaokar
April 2017

Commodity Plastic Market Research Report Information By Type (Polyethylene, Polypropylene, Polyethylene Terephthalate, Polystyrene, and Others), By Application (Packaging, Consumer Goods, Electronics, Automotive, Textile, Pharmaceuticals, and Others) And By Region (North America, Europe, Asia-Pacific, And Rest Of The World) –Market Forecast Till 2035.

Share:
Download PDF ×

We do not share your information with anyone. However, we may send you emails based on your report interest from time to time. You may contact us at any time to opt-out.

Commodity Plastic Market Infographic
Purchase Options

Market Share

Commodity Plastic Market Share Analysis

In the highly competitive commodity plastic market, companies utilize a variety of strategies to establish and enhance their market share. These strategies encompass technological innovation, strategic partnerships, geographical expansion, pricing tactics, sustainability initiatives, and robust marketing endeavors. Each of these elements plays a crucial role in enabling companies to differentiate themselves, attract customers, and gain a competitive edge in the commodity plastic segment.

Technological innovation stands as a cornerstone strategy in the commodity plastic market. Companies invest in research and development to develop new plastic formulations, manufacturing processes, and applications. Innovations may involve the creation of plastics with improved strength, flexibility, recyclability, or biodegradability, as well as the development of novel additives and compounds to enhance performance. By offering innovative solutions that meet evolving customer needs and regulatory requirements, companies can differentiate their products, attract new customers, and gain market share.

Strategic partnerships and collaborations are essential for companies seeking to strengthen their market position in the commodity plastic industry. Companies form alliances with raw material suppliers, manufacturers, recyclers, and end-users to create value chains and supply networks. Collaborative efforts enable companies to access new markets, leverage complementary expertise and resources, and drive product development and innovation. Moreover, partnerships with key players across the value chain enhance brand visibility, credibility, and market reach, driving growth and market share expansion.

Geographical expansion serves as a strategic imperative for companies aiming to capitalize on growth opportunities in the global commodity plastic market. Establishing a presence in key regions, particularly emerging markets with growing industrialization and urbanization, enables companies to access new customers and distribution channels. Localized production facilities and distribution networks enhance supply chain efficiency, reduce transportation costs, and improve responsiveness to local market demands. By strategically expanding their footprint, companies can strengthen their market position, increase brand awareness, and capture market share in diverse geographic regions.

Pricing strategies play a critical role in shaping market share dynamics within the commodity plastic industry. Companies adopt competitive pricing tactics to attract price-sensitive customers and gain a foothold in the market. This may involve offering discounts, bulk pricing, or value-added services to incentivize purchase and foster brand loyalty. However, pricing strategies must be balanced with considerations of production costs, market demand, and competitive dynamics to ensure sustainable profitability. Companies often employ dynamic pricing models and strategic pricing adjustments to optimize revenue and market share performance.

Sustainability initiatives are gaining prominence as a strategic imperative for companies operating in the commodity plastic market. With increasing consumer awareness of environmental issues and regulatory pressure to reduce plastic waste, there is growing demand for sustainable plastic alternatives and recycling solutions. Companies invest in sustainable sourcing, production, and recycling technologies to minimize environmental impact and meet consumer expectations. By aligning with sustainability goals and addressing consumer preferences for eco-friendly products, companies can enhance brand reputation, attract environmentally conscious consumers, and gain a competitive advantage in the market.

Effective marketing and brand positioning are crucial for companies seeking to differentiate themselves and gain market share in the commodity plastic industry. Companies leverage targeted marketing campaigns, digital channels, and product labeling to communicate the quality, performance, and sustainability attributes of their plastic products. Building a strong brand identity based on reliability, innovation, and environmental responsibility helps companies stand out in a crowded market and resonate with consumers. Moreover, strategic branding initiatives enable companies to command premium pricing, strengthen customer loyalty, and reinforce market leadership position.

Customer service excellence is paramount in driving market share growth and sustaining long-term success in the commodity plastic market. Companies prioritize customer-centric practices, including responsive communication, product quality assurance, and prompt resolution of inquiries or complaints. By consistently exceeding customer expectations and delivering superior value, companies can foster brand loyalty, generate positive word-of-mouth referrals, and gain market share traction. Furthermore, proactive engagement with customers enables companies to gather valuable feedback, identify emerging trends, and adapt their strategies to evolving consumer preferences and market dynamics.

Author
Anshula Mandaokar
Team Lead - Research

Anshula Mandaokar holds an academic degree in Chemical Engineering and has been contributing to the field for more than 5 years. She has expertise in Market Research and Business Consulting and serves as a Team Lead for a reputed Market Research firm under the Chemicals and Materials domain spectrum. She has worked on multiple projects, generating explicit results in a quick turnaround time. Her understanding of data interpretation justifies her role as a leader.

Leave a Comment

FAQs

How much is the Commodity Plastic market?

Commodity Plastic Market was valued at USD 565.99 Billion in 2024

What is the growth rate of the Commodity Plastic market?

Commodity Plastic Market is projected to grow at a CAGR of 5.49% during the forecast period, 2025-2035

Which Region holds the largest market share in the Commodity Plastic market?

North America holds the largest share of the Commodity Plastic market.

Who are the key players in the Commodity Plastic market?

The key players in the Commodity Plastic market are Westlake Chemical, Exxon Mobil, Qatar Petroleum, LG Chem, Qenos Pty, The Dow Chemical Company, Nova Chemicals, SABIC, Hanwha Chemical, LyondellBasell, Reliance Industries, Sinopec, and Chevron Phillips Chemical.

Which Type led the Commodity Plastic market?

Polyethylene Terephthalate dominated the Commodity Plastic market in 2024.

Which Application holds the largest market share in the Commodity Plastic market?

Packaging had the largest share of the Commodity Plastic market.

Market Summary

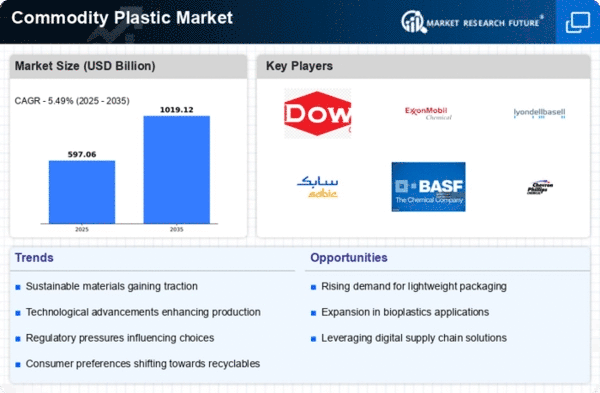
The Global Commodity Plastic Market is projected to grow from 565.99 USD Billion in 2024 to 1019.12 USD Billion by 2035, indicating robust expansion.

Key Market Trends & Highlights

Commodity Plastic Market Key Trends and Highlights

  • The market is expected to experience a compound annual growth rate (CAGR) of 5.49 percent from 2025 to 2035.
  • By 2035, the market valuation is anticipated to reach 1019.0 USD Billion, reflecting a substantial increase from the base year.
  • in 2024, the market is valued at 565.99 USD Billion, showcasing the current scale of the commodity plastic industry.
  • Growing adoption of sustainable materials due to increasing environmental regulations is a major market driver.

Market Size & Forecast

2024 Market Size 565.99 (USD Billion)
2035 Market Size 1019.12 (USD Billion)
CAGR (2025-2035) 5.49%
Largest Regional Market Share in 2024 latin_america)

Major Players

Westlake Chemical, Exxon Mobil, Qatar Petroleum, LG Chem, Qenos Pty, The Dow Chemical Company, Nova Chemicals, SABIC, Hanwha Chemical, LyondellBasell, Reliance Industries, Sinopec, Chevron Phillips Chemical

Market Trends

Growing requirements for both food and packaging containers are driving the market growth.

Commodity Plastic Market Market Drivers

Rising Demand for Sustainable Packaging

The Global Commodity Plastic Market Industry experiences a notable surge in demand for sustainable packaging solutions. As consumers increasingly prioritize eco-friendly products, companies are adapting their packaging strategies to incorporate biodegradable and recyclable materials. This shift not only aligns with environmental goals but also meets regulatory pressures for reduced plastic waste. For instance, major brands are committing to using recycled plastics, which could potentially drive the market's value to 566.0 USD Billion in 2024. This trend reflects a broader movement towards sustainability, indicating that the industry is evolving to meet both consumer preferences and legislative requirements.

Market Segment Insights

Commodity Plastic Market Type Insights

The Commodity Plastic Market segmentation, based on Type, includes

, Polypropylene, Polyethylene Terephthalate, Polystyrene, and Others. Polyethylene Terephthalate (PET) dominated the market, accounting for 58.9% of market revenue (USD 295 billion) in 2022. The plastics used in consumer goods and beverages are PET approved. They are high quality and are more robust. Numerous manufacturers use these plastics for packaging popular foods and soft beverages. The majority of these bottles made of PET are FDA-certified.

Commodity Plastic Market Application Insights

The Commodity Plastic Market segmentation, based on Application, includes Packaging, Consumer Goods, Electronics, Automotive,

, Pharmaceuticals, and Others. The Packaging category generated the highest revenue of about 49% in 2022. E-commerce's development has accelerated the growth of the packaging sector. Marketing products must draw in customers. The market for common plastics is driven mostly by expanding plastic packaging. The automobile category is expected to grow significantly during the projected timeframe.

Get more detailed insights about Commodity Plastic Market Research Report - Global Forecast till 2035

Regional Insights

By Region, the study provides market insights into North America, Europe, Asia-Pacific, and the Rest of the World. The Asia-Pacific area will dominate this market, owing to the increased use of commodity plastics in the packaging industry. In addition, Population growth and a rise in the demand for packaged meals are key factors for Commodity plastics to be in higher demand as the packaging, healthcare, and pharmaceutical sectors grow. Further, the major countries studied in the market report are The U.S., Canada, German, France, the UK, Italy, Spain, China, Japan, India, Australia, South Korea, and Brazil.

Europe's Commodity Plastic Market accounts for the second-largest market share due to the government's adoption to recycle plastic packaging, which is expected to decrease the use of plastics. Further, the German Commodity Plastic Market dominated the market share, and the UK Commodity Plastic Market is expected to reduce plastic at a significant rate in the European Region. The North American Commodity Plastic Market is expected to grow significantly during the projected period. An increasing focus on sophisticated packaging materials and a rise in the consumption of renewable packaging materials primarily drive revenue growth in this Region.

Moreover, China’s Commodity Plastic Market held the largest market share, and the Indian Commodity Plastic Market is expected to grow rapidly in the Asia-Pacific region. For instance, the largest manufacturer of industrial plastics in India is Reliance Industries which processes 1.16 metric tons of polyethylene and 2.7 metric tons of polypropylene annually. The only manufacturer of polyethylene with a low density in India is Reliance.

Key Players and Competitive Insights

Leading market players are investing heavily in research and development to increase production, which will help the Commodity Plastic Market grow further. Market participants are also undertaking a strategic approach to expand and strengthen their footprint, with important market developments including new product lines, partnerships, mergers and acquisitions, Capital expenditure, and strategic alliances with other organizations. The Plastic commodity industry must offer cost-effective and sustainable solutions to expand and survive in a fragmented market climate.

Manufacturing locally to minimize expenses at the operational level is one of the key business tactics used by organizations in the Commodity Plastic industry to benefit customers and capture untapped markets. In the nick of time, the Commodity Plastic industry has offered significant advantages to the packaging sector.

Major players in the Commodity Plastic Market, including Westlake Chemical, Exxon Mobil, Qatar Petroleum, LG Chem, Qenos Pty, The Dow Chemical Company, Nova Chemicals, SABIC, Hanwha Chemical, LyondellBasell, Reliance Industries, Sinopec, Chevron Phillips Chemical., are attempting to capture the majority of the market share by investing in research and development operations to produce sustainable and affordable options. Achiko AG offers innovative diagnostic products. The company offers a virtual healthcare passport for Covid-19 and develops and produces aptamer-based examinations and testing products for various pathogenic disorders and therapeutic reasons. Achiko serves worldwide customers.

In October 2021, they provided a status report on its production and production plans for AptameX, a proprietary, inexpensive, rapid Covid-19 test for diagnosis integrated into its system, Teman Sehat ("Health Buddy"). Most of the reagents, including the aptamer antibodies and the colloidal gold solution, along with a number of UV-visible Spectrophotometers, originate from Taiwan (UVS). As Achiko responds to requests from other nations, the present company structure will be replicated using locally produced plastics and installation. At the same time, reagent manufacturing will continue in Taiwan.

The initial version of the item is composed of mass-produced plastics, but a superior model built of custom polymers will be unveiled soon after. A Japanese chemical corporation with a expansion strategy is Mitsui Chemicals. It is listed on the Japanese stock exchange Nikkei and has business operations in the USA, China, Southeast Asia, the European Union, and Japan. It belongs to the Mitsui group and serves as one of the top chemical firms in Japan. The company offers a variety of goods and services to improve people's daily lives, including functional polymeric and performance materials.

In December 2020, Mitsui Chemicals revealed that its laboratory is now in Gujarat, India. The panels are tested under Indian standards by the Bureau of Indian Standards. With assistance in technology from the Berlin, Germany-based PI Photovoltaik-Institut Berlin AG, Mitsui Chemicals India started its laboratory in December of the previous year.

Key Companies in the Commodity Plastic Market market include

Industry Developments

  • Q2 2024: LyondellBasell and Genox Recycling Announce Joint Venture to Build Mechanical Plastics Recycling Facility in China LyondellBasell announced a joint venture with Genox Recycling to establish a new mechanical plastics recycling facility in Zhaoqing, Guangdong Province, China, aiming to expand circular economy capabilities in Asia.[4]

Future Outlook

Commodity Plastic Market Future Outlook

The Commodity Plastic Market is projected to grow at a 5.49% CAGR from 2025 to 2035, driven by sustainability initiatives, technological advancements, and increasing demand across various industries.

New opportunities lie in:

  • Invest in biodegradable plastic innovations to capture eco-conscious consumer segments.
  • Develop advanced recycling technologies to enhance material recovery and reduce waste.
  • Expand into emerging markets with tailored product offerings to meet local demands.

By 2035, the Commodity Plastic Market is expected to achieve substantial growth, reflecting evolving consumer preferences and regulatory landscapes.

Market Segmentation

Commodity Plastic Type Outlook

  • Polyethylene
  • Polypropylene
  • Polyethylene Terephthalate
  • Polystyrene
  • Others

Commodity Plastic Application Outlook

  • Packaging
  • Consumer Goods
  • Electronics
  • Automotive
  • Textile
  • Pharmaceuticals
  • Others

Report Scope

Attribute/Metric Details
Market Size 2024 USD 565.99 billion
Market Size 2035 1019.12 (Value (USD Billion))
Compound Annual Growth Rate (CAGR) 5.49% (2025 - 2035)
Base Year 2024
Market Forecast Period 2025 - 2035
Historical Data 2018- 2022
Market Forecast Units Value (USD Billion)
Report Coverage Revenue Forecast, Market Competitive Landscape, Growth Factors, and Trends
Segments Covered Type, Application, and Region
Geographies Covered North America, Europe, Asia Pacific, and the Rest of the World
Countries Covered The U.S., Canada, German, France, UK, Italy, Spain, China, Japan, India, Australia, South Korea, and Brazil
Key Companies Profiled  Westlake Chemical, Exxon Mobil, Qatar Petroleum, LG Chem, Qenos Pty, The Dow Chemical Company, Nova Chemicals, SABIC, Hanwha Chemical, LyondellBasell, Reliance Industries, Sinopec, and Chevron Phillips Chemical.
Key Market Opportunities The expanding requirement for food and packaging containers such as bottles, cartons, and trays.
Key Market Dynamics Expansion of automobile production and the rise in demand for light vehicles like EVs.
Market Size 2025 597.07 (Value (USD Billion))

FAQs

How much is the Commodity Plastic market?

Commodity Plastic Market was valued at USD 565.99 Billion in 2024

What is the growth rate of the Commodity Plastic market?

Commodity Plastic Market is projected to grow at a CAGR of 5.49% during the forecast period, 2025-2035

Which Region holds the largest market share in the Commodity Plastic market?

North America holds the largest share of the Commodity Plastic market.

Who are the key players in the Commodity Plastic market?

The key players in the Commodity Plastic market are Westlake Chemical, Exxon Mobil, Qatar Petroleum, LG Chem, Qenos Pty, The Dow Chemical Company, Nova Chemicals, SABIC, Hanwha Chemical, LyondellBasell, Reliance Industries, Sinopec, and Chevron Phillips Chemical.

Which Type led the Commodity Plastic market?

Polyethylene Terephthalate dominated the Commodity Plastic market in 2024.

Which Application holds the largest market share in the Commodity Plastic market?

Packaging had the largest share of the Commodity Plastic market.

  1. Report Prologue
  2. Market Introduction
    1. Definition
  3. 2.2 Scope of the Study
  4. 2.3 Research Objective
  5. 2.4 Assumptions & Limitations
  6. 2.4.1 Assumptions
  7. 2.4.2 Limitations
  8. 2.5 Market Structure
  9. 3 Research
    1. Methodology
    2. Research Process
  10. 3.2 Primary Research
  11. 3.3 Secondary Research
  12. 3.4 Market Size Estimation 17
  13. Market Dynamics
    1. Growth Drivers 20
      1. Wide
      2. Growing Asia-Pacific Market 21
      3. Increasing Demand from FMCG and Plastic Packaging Industries 22
    2. Range of Applications 21
    3. Restraints 22
      1. Economic Cycle 23
      2. Stringent
      3. Increasing Demand - Supply Gap 23
    4. Environmental Regulations on Non-Biodegradable Plastic Residues Challenging Market
    5. Growth 23
    6. Trends
      1. Emerging Economies 24
    7. and Opportunities 24
  14. Market
    1. Factor Analysis
    2. Value Chain Analysis 25
      1. Raw Material
      2. Commodity Plastic Manufacturers 25
      3. End Users 26
    3. Suppliers 25
    4. Distributor/Supplier 26
    5. Porter''s 5
      1. Threat from New Entrants 27
      2. Threat of Rivalry 28
    6. Forces Analysis 26
    7. Bargaining Power of Buyers 27 5.2.3 Bargaining Power of Supplier 27
    8. Threat from Substitutes 28
  15. Global
  16. Commodity Plastic Market, By Type 6.1 Introduction 29
    1. Polyethylene
    2. Polypropylene 37
    3. Polyvinyl Chloride 43
    4. Polyethylene Terephthalate 49
    5. Polystyrene 55
    6. Others Types 61
  17. Global Commodity Plastic Market, By Application
    1. Introduction 67
    2. Packaging 69
    3. Consumer
    4. Goods 75
    5. Electronics 81
    6. Automotive 87
    7. Textile 93
    8. Pharmaceuticals 98
    9. Others 104
  18. Global Commodity Plastic Market, By Region
    1. Introduction 110
    2. North America 113
      1. United States 117
      2. Canada 119
    3. Europe 122
      1. Germany 125
      2. United Kingdom 128
      3. France 131
      4. Italy
      5. Rest of Europe 136
    4. Asia-Pacific 139
      1. China 142
      2. Japan 145
      3. India 147
      4. Rest of Asia-Pacific 150
    5. Rest of the World (RoW) 153
      1. Latin America 156
      2. Middle East & Africa 159
  19. Competitive Landscape
    1. Introduction: Key Players 162
    2. Major Developments 163
      1. Major Developments, 2023-2032163
  20. Key Market Players
    1. BASF SE 166
      1. Company
      2. Product/Business Segment Overview 166
      3. Key Developments 167
      4. Company Overview 168
      5. PRODUCT/BUSINESS SEGMENT OVERVIEW 168
      6. Financial Updates
      7. Key Developments 173
    2. Overview 166
    3. Financial Updates 167
    4. The Dow Chemicals Company 168
    5. SABIC 174
      1. Company Overview 174
      2. Product/Business Segment Overview
      3. Financial Updates 175
      4. Key Developments 175
    6. Arkema SA 176
      1. Company Overview 176
      2. Product/Business Segment Overview 176
      3. Financials
      4. Key Developments 178
    7. Updates 177
    8. Mitsui Chemicals
      1. Company Overview 179
      2. Product/Business Segment
      3. Financial Updates 180
      4. Key Developments
    9. Overview 179
    10. LG Chemicals 182
      1. Company Overview 182
      2. Product/Business Segment Overview 182
      3. Financial
      4. Key Developments 183
    11. Updates 183
    12. Mitsubishi
      1. Company Overview 184
      2. Product/Business Segment Overview 185
      3. Financial Updates
      4. Key Developments 186
    13. Chemicals Holdings Corporation 184
  21. Conclusion
  22. List of Tables TABLE 1 GLOBAL COMMODITY PLASTIC MARKET, BY TYPE, 2023-2032(USD
    1. BILLION) 31
  23. GLOBAL COMMODITY PLASTIC MARKET, BY TYPE, 2023-2032(MMT)
  24. GLOBAL POLYETHYLENE MARKET FOR COMMODITY PLASTIC, BY REGIONS
    1. (2023-2032) (USD BILLION) 33
  25. GLOBAL POLYETHYLENE MARKET FOR COMMODITY
    1. PLASTIC, BY REGIONS (2023-2032) (MMT) 33
  26. NORTH AMERICA POLYETHYLENE
  27. MARKET FOR COMMODITY PLASTIC, BY REGIONS (2023-2032) (USD BILLION) 34
    1. TABLE
  28. NORTH AMERICA POLYETHYLENE MARKET FOR COMMODITY PLASTIC, BY REGIONS (2023-2032)
    1. (MMT) 34
  29. EUROPE POLYETHYLENE MARKET FOR COMMODITY PLASTIC, BY
    1. REGIONS (2023-2032) (USD BILLION) 35
  30. EUROPE POLYETHYLENE MARKET
    1. FOR COMMODITY PLASTIC, BY REGIONS (2023-2032) (MMT) 36
    2. TABLE 9
  31. ASIA-PACIFIC POLYETHYLENE MARKET FOR COMMODITY PLASTIC, BY REGIONS (2023-2032) (USD
    1. BILLION) 36
  32. ASIA-PACIFIC POLYETHYLENE MARKET FOR COMMODITY PLASTIC,
    1. BY REGIONS (2023-2032) (MMT) 37
  33. ROW POLYETHYLENE MARKET FOR
    1. COMMODITY PLASTIC, BY REGIONS (2023-2032) (USD BILLION) 37
    2. TABLE
  34. ROW POLYETHYLENE MARKET FOR COMMODITY PLASTIC, BY REGIONS (2023-2032) (MMT) 38
  35. GLOBAL POLYPROPYLENE MARKET FOR COMMODITY PLASTIC, BY REGIONS (2023-2032)
    1. (USD BILLION) 39
  36. GLOBAL POLYPROPYLENE MARKET FOR COMMODITY
    1. PLASTIC, BY REGIONS (2023-2032) (MMT) 40
  37. NORTH AMERICA POLYPROPYLENE
  38. MARKET FOR COMMODITY PLASTIC, BY REGIONS (2023-2032) (USD BILLION) 40
    1. TABLE
  39. NORTH AMERICA POLYPROPYLENE MARKET FOR COMMODITY PLASTIC, BY REGIONS (2023-2032)
    1. (MMT) 41
  40. EUROPE POLYPROPYLENE MARKET FOR COMMODITY PLASTIC,
    1. BY REGIONS (2023-2032) (USD MILLION) 41
  41. EUROPE POLYPROPYLENE
  42. MARKET FOR COMMODITY PLASTIC, BY REGIONS (2023-2032) (MMT) 42
    1. TABLE 19
  43. ASIA-PACIFIC POLYPROPYLENE MARKET FOR COMMODITY PLASTIC, BY REGIONS (2023-2032)
    1. (USD BILLION) 42
  44. ASIA-PACIFIC POLYPROPYLENE MARKET FOR
    1. COMMODITY PLASTIC, BY REGIONS (2023-2032) (MMT) 43
  45. ROW
  46. POLYPROPYLENE MARKET FOR COMMODITY PLASTIC, BY REGIONS (2023-2032) (USD BILLION)
  47. ROW POLYPROPYLENE MARKET FOR COMMODITY PLASTIC, BY REGIONS
    1. (2023-2032) (MMT) 44
  48. GLOBAL POLYVINYL CHLORIDE MARKET FOR COMMODITY
    1. PLASTIC, BY REGIONS (2023-2032) (USD BILLION) 45
  49. GLOBAL
  50. POLYVINYL CHLORIDE MARKET FOR COMMODITY PLASTIC, BY REGIONS (2023-2032) (MMT) 46
  51. NORTH AMERICA POLYVINYL CHLORIDE MARKET FOR COMMODITY PLASTIC,
    1. BY REGIONS (2023-2032) (USD BILLION) 46
  52. NORTH AMERICA POLYVINYL
  53. CHLORIDE MARKET FOR COMMODITY PLASTIC, BY REGIONS (2023-2032) (MMT) 47
  54. EUROPE POLYVINYL CHLORIDE MARKET FOR COMMODITY PLASTIC, BY REGIONS
    1. (2023-2032) (USD MILLION) 47
  55. EUROPE POLYVINYL CHLORIDE
  56. MARKET FOR COMMODITY PLASTIC, BY REGIONS (2023-2032) (MMT) 48
    1. TABLE
  57. ASIA-PACIFIC POLYVINYL CHLORIDE MARKET FOR COMMODITY PLASTIC, BY REGIONS (2023-2032)
    1. (USD BILLION) 48
  58. ASIA-PACIFIC POLYVINYL CHLORIDE MARKET FOR
    1. COMMODITY PLASTIC, BY REGIONS (2023-2032) (MMT) 49
  59. ROW POLYVINYL
  60. CHLORIDE MARKET FOR COMMODITY PLASTIC, BY REGIONS (2023-2032) (USD BILLION) 49
  61. ROW POLYVINYL CHLORIDE MARKET FOR COMMODITY PLASTIC, BY REGIONS
    1. (2023-2032) (MMT) 50
  62. GLOBAL POLYETHYLENE TEREPHTHALATE MARKET
    1. FOR COMMODITY PLASTIC, BY REGIONS (2023-2032) (USD BILLION) 51
    2. TABLE
  63. GLOBAL POLYETHYLENE TEREPHTHALATE MARKET FOR COMMODITY PLASTIC, BY REGIONS (2023-2032)
    1. (MMT) 52
  64. NORTH AMERICA POLYETHYLENE TEREPHTHALATE MARKET FOR
    1. COMMODITY PLASTIC, BY REGIONS (2023-2032) (USD BILLION) 52
  65. NORTH
  66. AMERICA POLYETHYLENE TEREPHTHALATE MARKET FOR COMMODITY PLASTIC, BY REGIONS (2023-2032)
    1. (MMT) 53
  67. EUROPE POLYETHYLENE TEREPHTHALATE MARKET FOR COMMODITY
    1. PLASTIC, BY REGIONS (2023-2032) (USD BILLION) 53
  68. EUROPE
  69. POLYETHYLENE TEREPHTHALATE MARKET FOR COMMODITY PLASTIC, BY REGIONS (2023-2032)
    1. (MMT) 54
  70. ASIA-PACIFIC POLYETHYLENE TEREPHTHALATE MARKET FOR
    1. COMMODITY PLASTIC, BY REGIONS (2023-2032) (USD BILLION) 54
  71. ASIA-PACIFIC
  72. POLYETHYLENE TEREPHTHALATE MARKET FOR COMMODITY PLASTIC, BY REGIONS (2023-2032)
    1. (MMT) 55
  73. ROW POLYETHYLENE TEREPHTHALATE MARKET FOR COMMODITY
    1. PLASTIC, BY REGIONS (2023-2032) (USD BILLION) 55
  74. ROW POLYETHYLENE
  75. TEREPHTHALATE MARKET FOR COMMODITY PLASTIC, BY REGIONS (2023-2032) (MMT) 56
  76. GLOBAL POLYSTYRENE MARKET FOR COMMODITY PLASTIC, BY REGIONS (2023-2032)
    1. (USD BILLION) 57
  77. GLOBAL POLYSTYRENE MARKET FOR COMMODITY
    1. PLASTIC, BY REGIONS (2023-2032) (MMT) 58
  78. NORTH AMERICA POLYSTYRENE
  79. MARKET FOR COMMODITY PLASTIC, BY REGIONS (2023-2032) (USD BILLION) 58
    1. TABLE
  80. NORTH AMERICA POLYSTYRENE MARKET FOR COMMODITY PLASTIC, BY REGIONS (2023-2032)
    1. (MMT) 59
  81. EUROPE POLYSTYRENE MARKET FOR COMMODITY PLASTIC, BY
    1. REGIONS (2023-2032) (USD BILLION) 59
  82. EUROPE POLYSTYRENE MARKET
    1. FOR COMMODITY PLASTIC, BY REGIONS (2023-2032) (MMT) 60
  83. ASIA-PACIFIC
  84. POLYSTYRENE MARKET FOR COMMODITY PLASTIC, BY REGIONS (2023-2032) (USD BILLION) 60
  85. ASIA-PACIFIC POLYSTYRENE MARKET FOR COMMODITY PLASTIC, BY REGIONS
    1. (2023-2032) (MMT) 61
  86. ROW POLYSTYRENE MARKET FOR COMMODITY
    1. PLASTIC, BY REGIONS (2023-2032) (USD BILLION) 61
  87. ROW POLYSTYRENE
  88. MARKET FOR COMMODITY PLASTIC, BY REGIONS (2023-2032) (MMT) 62
    1. TABLE 53
  89. GLOBAL OTHER TYPES MARKET FOR COMMODITY PLASTIC, BY REGIONS (2023-2032) (USD BILLION)
  90. GLOBAL OTHER TYPES MARKET FOR COMMODITY PLASTIC, BY REGIONS
    1. (2023-2032) (MMT) 63
  91. NORTH AMERICA OTHER TYPES MARKET
    1. FOR COMMODITY PLASTIC, BY REGIONS (2023-2032) (USD BILLION) 64
    2. TABLE
  92. NORTH AMERICA OTHER TYPES MARKET FOR COMMODITY PLASTIC, BY REGIONS (2023-2032)
    1. (MMT) 64
  93. EUROPE OTHER TYPES MARKET FOR COMMODITY PLASTIC, BY
    1. REGIONS (2023-2032) (USD BILLION) 65
  94. EUROPE OTHER TYPES MARKET
    1. FOR COMMODITY PLASTIC, BY REGIONS (2023-2032) (MMT) 65
  95. ASIA-PACIFIC
  96. OTHER TYPES MARKET FOR COMMODITY PLASTIC, BY REGIONS (2023-2032) (USD BILLION) 66
  97. ASIA-PACIFIC OTHER TYPES MARKET FOR COMMODITY PLASTIC, BY REGIONS
    1. (2023-2032) (MMT) 66
  98. ROW OTHER TYPES MARKET FOR COMMODITY PLASTIC,
    1. BY REGIONS (2023-2032) (USD BILLION) 67
  99. ROW OTHER TYPES
  100. MARKET FOR COMMODITY PLASTIC, BY REGIONS (2023-2032) (MMT) 67
    1. TABLE 63
  101. GLOBAL COMMODITY PLASTIC MARKET, BY APPLICATION (2023-2032) (USD BILLION) 68
  102. GLOBAL COMMODITY PLASTIC MARKET, BY APPLICATION (2023-2032) (MMT)
  103. GLOBAL PACKAGING MARKET FOR COMMODITY PLASTIC, BY REGIONS
    1. (2023-2032) (USD BILLION) 71
  104. GLOBAL PACKAGING MARKET FOR COMMODITY
    1. PLASTIC, BY REGIONS (2023-2032) (MMT) 71
  105. NORTH AMERICA PACKAGING
  106. MARKET FOR COMMODITY PLASTIC, BY REGIONS (2023-2032) (USD BILLION) 72
    1. TABLE
  107. NORTH AMERICA PACKAGING MARKET FOR COMMODITY PLASTIC, BY REGIONS (2023-2032)
    1. (MMT) 72
  108. EUROPE PACKAGING MARKET FOR COMMODITY PLASTIC, BY REGIONS
    1. (2023-2032) (USD BILLION) 73
  109. EUROPE PACKAGING MARKET FOR COMMODITY
    1. PLASTIC, BY REGIONS (2023-2032) (MMT) 74
  110. ASIA-PACIFIC PACKAGING
  111. MARKET FOR COMMODITY PLASTIC, BY REGIONS (2023-2032) (USD BILLION) 74
    1. TABLE
  112. ASIA-PACIFIC PACKAGING MARKET FOR COMMODITY PLASTIC, BY REGIONS (2023-2032) (MMT)
  113. ROW PACKAGING MARKET FOR COMMODITY PLASTIC, BY REGIONS
    1. (2023-2032) (USD BILLION) 75
  114. ROW PACKAGING MARKET FOR COMMODITY
    1. PLASTIC, BY REGIONS (2023-2032) (MMT) 76
  115. GLOBAL CONSUMER GOODS
  116. MARKET FOR COMMODITY PLASTIC, BY REGIONS (2023-2032) (USD BILLION) 77
    1. TABLE
  117. GLOBAL CONSUMER GOODS MARKET FOR COMMODITY PLASTIC, BY REGIONS (2023-2032) (MMT)
  118. NORTH AMERICA CONSUMER GOODS MARKET FOR COMMODITY PLASTIC,
    1. BY REGIONS (2023-2032) (USD BILLION) 78
  119. NORTH AMERICA CONSUMER
  120. GOODS MARKET FOR COMMODITY PLASTIC, BY REGIONS (2023-2032) (MMT) 79
    1. TABLE
  121. EUROPE CONSUMER GOODS MARKET FOR COMMODITY PLASTIC, BY REGIONS (2023-2032) (USD
    1. BILLION) 79
  122. EUROPE CONSUMER GOODS MARKET FOR COMMODITY PLASTIC,
    1. BY REGIONS (2023-2032) (MMT) 80
  123. ASIA-PACIFIC CONSUMER GOODS
  124. MARKET FOR COMMODITY PLASTIC, BY REGIONS (2023-2032) (USD BILLION) 80
    1. TABLE
  125. ASIA-PACIFIC CONSUMER GOODS MARKET FOR COMMODITY PLASTIC, BY REGIONS (2023-2032)
    1. (MMT) 81
  126. ROW CONSUMER GOODS MARKET FOR COMMODITY PLASTIC, BY
    1. REGIONS (2023-2032) (USD BILLION) 81
  127. ROW CONSUMER GOODS MARKET
    1. FOR COMMODITY PLASTIC, BY REGIONS (2023-2032) (MMT) 82
  128. GLOBAL
  129. ELECTRONICS MARKET FOR COMMODITY PLASTIC, BY REGIONS (2023-2032) (USD BILLION) 83
  130. GLOBAL ELECTRONICS MARKET FOR COMMODITY PLASTIC, BY REGIONS (2023-2032)
    1. (MMT) 84
  131. NORTH AMERICA ELECTRONICS MARKET FOR COMMODITY PLASTIC,
    1. BY REGIONS (2023-2032) (USD BILLION) 84
  132. NORTH AMERICA ELECTRONICS
  133. MARKET FOR COMMODITY PLASTIC, BY REGIONS (2023-2032) (MMT) 85
    1. TABLE 89
  134. EUROPE ELECTRONICS MARKET FOR COMMODITY PLASTIC, BY REGIONS (2023-2032) (USD BILLION)
  135. EUROPE ELECTRONICS MARKET FOR COMMODITY PLASTIC, BY REGIONS
    1. (2023-2032) (MMT) 86
  136. ASIA-PACIFIC ELECTRONICS MARKET FOR COMMODITY
    1. PLASTIC, BY REGIONS (2023-2032) (USD BILLION) 86
  137. ASIA-PACIFIC
  138. ELECTRONICS MARKET FOR COMMODITY PLASTIC, BY REGIONS (2023-2032) (MMT) 87
  139. ROW ELECTRONICS MARKET FOR COMMODITY PLASTIC, BY REGIONS (2023-2032)
    1. (USD BILLION) 87
  140. ROW ELECTRONICS MARKET FOR COMMODITY PLASTIC,
    1. BY REGIONS (2023-2032) (MMT) 88
  141. GLOBAL AUTOMOTIVE MARKET FOR
    1. COMMODITY PLASTIC, BY REGIONS (2023-2032) (USD BILLION) 89
  142. GLOBAL
  143. AUTOMOTIVE MARKET FOR COMMODITY PLASTIC, BY REGIONS (2023-2032) (MMT) 89
  144. NORTH AMERICA AUTOMOTIVE MARKET FOR COMMODITY PLASTIC, BY REGIONS (2023-2032)
    1. (USD BILLION) 90
  145. NORTH AMERICA AUTOMOTIVE MARKET FOR COMMODITY
    1. PLASTIC, BY REGIONS (2023-2032) (MMT) 90
  146. EUROPE AUTOMOTIVE MARKET
    1. FOR COMMODITY PLASTIC, BY REGIONS (2023-2032) (USD BILLION) 91
    2. TABLE
  147. EUROPE AUTOMOTIVE MARKET FOR COMMODITY PLASTIC, BY REGIONS (2023-2032) (MMT)
  148. ASIA-PACIFIC AUTOMOTIVE MARKET FOR COMMODITY PLASTIC, BY
    1. REGIONS (2023-2032) (USD BILLION) 92
  149. ASIA-PACIFIC AUTOMOTIVE
  150. MARKET FOR COMMODITY PLASTIC, BY REGIONS (2023-2032) (MMT) 92
    1. TABLE 103
  151. ROW AUTOMOTIVE MARKET FOR COMMODITY PLASTIC, BY REGIONS (2023-2032) (USD BILLION)
  152. ROW AUTOMOTIVE MARKET FOR COMMODITY PLASTIC, BY REGIONS
    1. (2023-2032) (MMT) 93
  153. GLOBAL TEXTILE MARKET FOR COMMODITY PLASTIC,
    1. BY REGIONS (2023-2032) (USD BILLION) 94
  154. GLOBAL TEXTILE MARKET
    1. FOR COMMODITY PLASTIC, BY REGIONS (2023-2032) (MMT) 95
  155. NORTH
  156. AMERICA TEXTILE MARKET FOR COMMODITY PLASTIC, BY REGIONS (2023-2032) (USD BILLION)
  157. NORTH AMERICA TEXTILE MARKET FOR COMMODITY PLASTIC, BY REGIONS
    1. (2023-2032) (MMT) 96
  158. EUROPE TEXTILE MARKET FOR COMMODITY PLASTIC,
    1. BY REGIONS (2023-2032) (USD BILLION) 96
  159. EUROPE TEXTILE MARKET
    1. FOR COMMODITY PLASTIC, BY REGIONS (2023-2032) (MMT) 97
  160. ASIA-PACIFIC
  161. TEXTILE MARKET FOR COMMODITY PLASTIC, BY REGIONS (2023-2032) (USD BILLION) 97
  162. ASIA-PACIFIC TEXTILE MARKET FOR COMMODITY PLASTIC, BY REGIONS
    1. (2023-2032) (MMT) 98
  163. ROW TEXTILE MARKET FOR COMMODITY PLASTIC,
    1. BY REGIONS (2023-2032) (USD BILLION) 98
  164. ROW TEXTILE MARKET
    1. FOR COMMODITY PLASTIC, BY REGIONS (2023-2032) (MMT) 99
  165. GLOBAL
  166. PHARMACEUTICALS MARKET FOR COMMODITY PLASTIC, BY REGIONS (2023-2032) (USD BILLION)
  167. GLOBAL PHARMACEUTICALS MARKET FOR COMMODITY PLASTIC, BY
    1. REGIONS (2023-2032) (MMT) 100
  168. NORTH AMERICA PHARMACEUTICALS
  169. MARKET FOR COMMODITY PLASTIC, BY REGIONS (2023-2032) (USD BILLION) 101
  170. NORTH AMERICA PHARMACEUTICALS MARKET FOR COMMODITY PLASTIC, BY REGIONS
    1. (2023-2032) (MMT) 101
  171. EUROPE PHARMACEUTICALS MARKET FOR
    1. COMMODITY PLASTIC, BY REGIONS (2023-2032) (USD BILLION) 102
    2. TABLE 120
  172. EUROPE PHARMACEUTICALS MARKET FOR COMMODITY PLASTIC, BY REGIONS (2023-2032) (MMT)
  173. ASIA-PACIFIC PHARMACEUTICALS MARKET FOR COMMODITY PLASTIC,
    1. BY REGIONS (2023-2032) (USD BILLION) 102
  174. ASIA-PACIFIC PHARMACEUTICALS
  175. MARKET FOR COMMODITY PLASTIC, BY REGIONS (2023-2032) (MMT) 103
    1. TABLE
  176. ROW PHARMACEUTICALS MARKET FOR COMMODITY PLASTIC, BY REGIONS (2023-2032) (USD
    1. BILLION) 104
  177. ROW PHARMACEUTICALS MARKET FOR COMMODITY PLASTIC,
    1. BY REGIONS (2023-2032) (MMT) 104
  178. GLOBAL OTHER APPLICATIONS
  179. MARKET FOR COMMODITY PLASTIC, BY REGIONS (2023-2032) (USD BILLION) 105
  180. GLOBAL OTHER APPLICATIONS MARKET FOR COMMODITY PLASTIC, BY REGIONS (2023-2032)
    1. (MMT) 106
  181. NORTH AMERICA OTHER APPLICATIONS MARKET FOR COMMODITY
    1. PLASTIC, BY REGIONS (2023-2032) (USD BILLION) 106
  182. NORTH AMERICA
  183. OTHER APPLICATIONS MARKET FOR COMMODITY PLASTIC, BY REGIONS (2023-2032) (MMT) 107
  184. EUROPE OTHER APPLICATIONS MARKET FOR COMMODITY PLASTIC, BY REGIONS
    1. (2023-2032) (USD BILLION) 107
  185. EUROPE OTHER APPLICATIONS MARKET
    1. FOR COMMODITY PLASTIC, BY REGIONS (2023-2032) (MMT) 108
  186. ASIA-PACIFIC
  187. OTHER APPLICATIONS MARKET FOR COMMODITY PLASTIC, BY REGIONS (2023-2032) (USD BILLION)
  188. ASIA-PACIFIC OTHER APPLICATIONS MARKET FOR COMMODITY PLASTIC,
    1. BY REGIONS (2023-2032) (MMT) 109
  189. ROW OTHER APPLICATIONS MARKET
    1. FOR COMMODITY PLASTIC, BY REGIONS (2023-2032) (USD BILLION) 109
    2. TABLE
  190. ROW OTHER APPLICATIONS MARKET FOR COMMODITY PLASTIC, BY REGIONS (2023-2032)
    1. (MMT) 110
  191. GLOBAL COMMODITY PLASTIC MARKET, BY REGION 2023-2032(USD
    1. BILLION) 111
  192. GLOBAL COMMODITY PLASTIC MARKET, BY REGION, 2023-2032(MMT)
  193. GLOBAL COMMODITY PLASTIC MARKET, BY TYPE, 2023-2032(USD
    1. BILLION) 112
  194. GLOBAL COMMODITY PLASTIC MARKET, BY TYPE, 2023-2032(MMT)
  195. GLOBAL COMMODITY PLASTIC MARKET, BY APPLICATION, 2023-2032(USD
    1. BILLION) 113
  196. GLOBAL COMMODITY PLASTIC MARKET, BY APPLICATION,
  197. NORTH AMERICA COMMODITY PLASTIC MARKET,
    1. BY COUNTRY, 2023-2032(USD BILLION) 114
  198. NORTH AMERICA COMMODITY
  199. PLASTIC MARKET, BY COUNTRY, 2023-2032(MMT) 115
  200. NORTH AMERICA
  201. COMMODITY PLASTIC MARKET, BY TYPE, 2023-2032(USD BILLION) 115
    1. TABLE 144
  202. NORTH AMERICA COMMODITY PLASTIC MARKET, BY TYPE, 2023-2032(MMT) 116
    1. TABLE
  203. NORTH AMERICA COMMODITY PLASTIC MARKET, BY APPLICATION, 2023-2032(USD BILLION)
  204. NORTH AMERICA COMMODITY PLASTIC MARKET, BY APPLICATION,
  205. US COMMODITY PLASTIC MARKET, BY TYPE, 2023-2032(USD
    1. BILLION) 118
  206. US COMMODITY PLASTIC MARKET, BY TYPE, 2023-2032(MMT)
  207. US COMMODITY PLASTIC MARKET, BY APPLICATION, 2023-2032(USD
    1. BILLION) 119
  208. US COMMODITY PLASTIC MARKET, BY APPLICATION, 2023-2032(MMT)
  209. CANADA COMMODITY PLASTIC MARKET, BY TYPE, 2023-2032(USD
    1. BILLION) 120
  210. CANADA COMMODITY PLASTIC MARKET, BY TYPE, 2023-2032(MMT)
  211. CANADA COMMODITY PLASTIC MARKET, BY APPLICATION, 2023-2032(USD
    1. BILLION) 122
  212. CANADA COMMODITY PLASTIC MARKET, BY APPLICATION,
  213. EUROPE COMMODITY PLASTIC MARKET, BY COUNTRY,
  214. EUROPE COMMODITY PLASTIC MARKET,
    1. BY COUNTRY, 2023-2032(MMT) 123
  215. EUROPE COMMODITY PLASTIC MARKET,
    1. BY TYPE, 2023-2032(USD BILLION) 124
  216. EUROPE COMMODITY
  217. PLASTIC MARKET, BY TYPE, 2023-2032(MMT) 124
  218. EUROPE COMMODITY
  219. PLASTIC MARKET, BY APPLICATION, 2023-2032(USD BILLION) 125
    1. TABLE 160
  220. EUROPE COMMODITY PLASTIC MARKET, BY APPLICATION, 2023-2032(MMT) 126
    1. TABLE
  221. GERMANY COMMODITY PLASTIC MARKET, BY TYPE, 2023-2032(USD BILLION) 126
  222. GERMANY COMMODITY PLASTIC MARKET, BY TYPE, 2023-2032(MMT) 127
  223. GERMANY COMMODITY PLASTIC MARKET, BY APPLICATION, 2023-2032(USD BILLION)128
  224. GERMANY COMMODITY PLASTIC MARKET, BY APPLICATION, 2023-2032(MMT)
  225. UK COMMODITY PLASTIC MARKET, BY TYPE, 2023-2032(USD BILLION)
  226. UK COMMODITY PLASTIC MARKET, BY TYPE, 2023-2032(MMT)
  227. UK COMMODITY PLASTIC MARKET, BY APPLICATION, 2023-2032(USD
    1. BILLION) 130
  228. UK COMMODITY PLASTIC MARKET, BY APPLICATION,
  229. FRANCE COMMODITY PLASTIC MARKET, BY
    1. TYPE, 2023-2032(USD BILLION) 132
  230. FRANCE COMMODITY PLASTIC
  231. MARKET, BY TYPE, 2023-2032(MMT) 132
  232. FRANCE COMMODITY
  233. PLASTIC MARKET, BY APPLICATION, 2023-2032(USD BILLION) 133
    1. TABLE 172
  234. FRANCE COMMODITY PLASTIC MARKET, BY APPLICATION, 2023-2032(MMT) 134
    1. TABLE
  235. ITALY COMMODITY PLASTIC MARKET, BY TYPE, 2023-2032(USD BILLION) 134
  236. ITALY COMMODITY PLASTIC MARKET, BY TYPE, 2023-2032(MMT) 135
  237. ITALY COMMODITY PLASTIC MARKET, BY APPLICATION, 2023-2032(USD
    1. BILLION) 136
  238. ITALY COMMODITY PLASTIC MARKET, BY APPLICATION,
  239. REST OF EUROPE COMMODITY PLASTIC MARKET,
    1. BY TYPE, 2023-2032(USD BILLION) 137
  240. REST OF EUROPE COMMODITY
  241. PLASTIC MARKET, BY TYPE, 2023-2032(MMT) 138
  242. REST OF EUROPE
  243. COMMODITY PLASTIC MARKET, BY APPLICATION, 2023-2032(USD BILLION) 138
    1. TABLE
  244. REST OF EUROPE COMMODITY PLASTIC MARKET, BY APPLICATION, 2023-2032(MMT) 139
  245. ASIA-PACIFIC COMMODITY PLASTIC MARKET, BY COUNTRY, 2023-2032(USD
    1. BILLION) 140
  246. ASIA-PACIFIC COMMODITY PLASTIC MARKET, BY COUNTRY,
  247. ASIA-PACIFIC COMMODITY PLASTIC MARKET, BY
    1. TYPE, 2023-2032(USD BILLION) 141
  248. ASIA-PACIFIC COMMODITY PLASTIC
  249. MARKET, BY TYPE, 2023-2032(MMT) 141
  250. ASIA-PACIFIC COMMODITY
  251. PLASTIC MARKET, BY APPLICATION, 2023-2032(USD BILLION) 142
    1. TABLE 186
  252. ASIA-PACIFIC COMMODITY PLASTIC MARKET, BY APPLICATION, 2023-2032(MMT) 143
  253. CHINA COMMODITY PLASTIC MARKET, BY TYPE, 2023-2032(USD BILLION) 143
  254. CHINA COMMODITY PLASTIC MARKET, BY TYPE, 2023-2032(MMT) 144
  255. CHINA COMMODITY PLASTIC MARKET, BY APPLICATION, 2023-2032(USD
    1. BILLION) 145
  256. CHINA COMMODITY PLASTIC MARKET, BY APPLICATION,
  257. JAPAN COMMODITY PLASTIC MARKET, BY TYPE,
  258. JAPAN COMMODITY PLASTIC MARKET,
    1. BY TYPE, 2023-2032(MMT) 147
  259. JAPAN COMMODITY PLASTIC MARKET,
    1. BY APPLICATION, 2023-2032(USD BILLION) 147
  260. JAPAN COMMODITY
  261. PLASTIC MARKET, BY APPLICATION, 2023-2032(MMT) 148
  262. INDIA COMMODITY
  263. PLASTIC MARKET, BY TYPE, 2023-2032(USD BILLION) 148
  264. INDIA COMMODITY
  265. PLASTIC MARKET, BY TYPE, 2023-2032(MMT) 149
  266. INDIA COMMODITY
  267. PLASTIC MARKET, BY APPLICATION, 2023-2032(USD BILLION) 150
    1. TABLE 198
  268. INDIA COMMODITY PLASTIC MARKET, BY APPLICATION, 2023-2032(MMT) 150
    1. TABLE
  269. REST OF ASIA-PACIFIC COMMODITY PLASTIC MARKET, BY TYPE, 2023-2032(USD BILLION)
  270. REST OF ASIA-PACIFIC COMMODITY PLASTIC MARKET, BY
    1. TYPE, 2023-2032(MMT) 152
  271. REST OF ASIA-PACIFIC COMMODITY PLASTIC
  272. MARKET, BY APPLICATION, 2023-2032(USD BILLION) 152
  273. REST OF
  274. ASIA-PACIFIC COMMODITY PLASTIC MARKET, BY APPLICATION, 2023-2032(MMT) 153
  275. ROW COMMODITY PLASTIC MARKET, BY COUNTRY, 2023-2032(USD BILLION) 154
  276. ROW COMMODITY PLASTIC MARKET, BY COUNTRY, 2023-2032(MMT) 154
  277. ROW COMMODITY PLASTIC MARKET, BY TYPE, 2023-2032(USD BILLION)
  278. ROW COMMODITY PLASTIC MARKET, BY TYPE, 2023-2032(MMT) 155
  279. ROW COMMODITY PLASTIC MARKET, BY APPLICATION, 2023-2032(USD BILLION)
  280. ROW COMMODITY PLASTIC MARKET, BY APPLICATION, 2023-2032(MMT)
  281. LATIN AMERICA COMMODITY PLASTIC MARKET, BY TYPE, 2023-2032(USD
    1. BILLION) 157
  282. LATIN AMERICA COMMODITY PLASTIC MARKET, BY TYPE,
  283. LATIN AMERICA COMMODITY PLASTIC MARKET,
    1. BY APPLICATION, 2023-2032(USD BILLION) 159
  284. LATIN AMERICA COMMODITY
  285. PLASTIC MARKET, BY APPLICATION, 2023-2032(MMT) 159
  286. MIDDLE EAST
  287. & AFRICA COMMODITY PLASTIC MARKET, BY TYPE, 2023-2032(USD BILLION) 160
  288. MIDDLE EAST & AFRICA COMMODITY PLASTIC MARKET, BY TYPE, 2023-2032(MMT)
  289. MIDDLE EAST & AFRICA COMMODITY PLASTIC MARKET, BY APPLICATION,
  290. MIDDLE EAST & AFRICA COMMODITY
  291. PLASTIC MARKET, BY APPLICATION, 2023-2032(MMT) 162  
  292. List of
    1. Figures
  293. GLOBAL COMMODITY PLASTIC MARKET OUTLOOK (2020-2022)
  294. RESRARCH PROCESS OF MRFR 16
  295. TOP DOWN
    1. & BOTTOM DOWN APPROACH 18 FIGURE 4 FORECAST MODEL 19
  296. MARKET
    1. DYNAMICS 20
  297. GROWTH DRIVERS: IMPACT ANALYSIS 20
    1. FIGURE
  298. GROWTH RESTRAINTS: IMPACT ANALYSIS 22
  299. VALUE CHAIN ANALYSIS
  300. PORTER’S FIVE FORCES ANALYSIS 26
    1. FIGURE
  301. GLOBAL COMMODITY PLASTIC MARKET SHARE, BY TYPE IN 2020 29
    1. FIGURE 11
  302. GLOBAL POLYETHYLENE MARKET FOR COMMODITY PLASTIC, BY REGION, 2020 (%) 31
  303. GLOBAL POLYPROPYLENE MARKET FOR COMMODITY PLASTIC, BY REGION, 2020 (%)
  304. GLOBAL POLYVINYL CHLORIDE MARKET FOR COMMODITY PLASTIC,
    1. BY REGION, 2020 (%) 44
  305. GLOBAL POLYETHYLENE TEREPHTHALATE MARKET
    1. FOR COMMODITY PLASTIC, BY REGION, 2020 (%) 50
  306. GLOBAL POLYSTYRENE
  307. MARKET FOR COMMODITY PLASTIC, BY REGION, 2020 (%) 56
  308. GLOBAL
  309. OTHER TYPES MARKET FOR COMMODITY PLASTIC, BY REGION, 2020 (%) 61
    1. FIGURE
  310. GLOBAL COMMODITY PLASTIC REVENUE MARKET SHARE (%), BY APPLICATION (2020) 67
  311. GLOBAL COMMODITY PLASTIC VOLUME MARKET SHARE, BY APPLICATION (2020)
  312. GLOBAL PACKAGING MARKET FOR COMMODITY PLASTIC, BY REGION,
  313. GLOBAL CONSUMER GOODS MARKET FOR COMMODITY PLASTIC,
    1. BY REGION, 2020 (%) 76
  314. GLOBAL ELECTRONICS MARKET FOR COMMODITY
    1. PLASTIC, BY REGION, 2020 (%) 82
  315. GLOBAL AUTOMOTIVE MARKET FOR
    1. COMMODITY PLASTIC, BY REGION, 2020 (%) 87
  316. GLOBAL TEXTILE MARKET
    1. FOR COMMODITY PLASTIC, BY REGION, 2020 (%) 93
  317. GLOBAL PHARMACEUTICALS
  318. MARKET FOR COMMODITY PLASTIC, BY REGION, 2020 (%) 98
  319. GLOBAL
  320. OTHER APPLICATIONS MARKET FOR COMMODITY PLASTIC, BY REGION, 2020 (%) 104
  321. GLOBAL COMMODITY PLASTIC MARKST SHARE BY REGION IN 2020 (%) 110
  322. EXPANSION: THE MAJOR STRATERGY ADOPTED BY, KEY PLAYERS, 2023-2032162
  323. BASF SE: RECENT FINANCIALS 167
  324. DOW CHEMICLS:
    1. RECENT FINANCIALS 172
  325. SABIC: RECENT FINANCILS 175
  326. ARKEMA SA: RECENT FINANCIALS 177
  327. MITSUI CHEMICALS:
    1. RECENT FINANCIALS 180
  328. LG CHEM: RECENT FINANCIALS 183
  329. MITSUBISHI CHEMICALS HOLDINGS CORPORATION: FINANCIAL UPDATES 186
  330. GLOBAL COMMODITY PLASTIC MARKET SHARE AND CAGR % (2020) 188

Commodity Plastic Type Outlook (USD Billion, 2018-2032)

  • Polyethylene
  • Polypropylene
  • Polyethylene Terephthalate
  • Polystyrene
  • Others

Commodity Plastic Application Outlook (USD Billion, 2018-2032)

  • Packaging
  • Consumer Goods
  • Electronics
  • Automotive
  • Textile
  • Pharmaceuticals
  • Others

Commodity Plastic Regional Outlook (USD Billion, 2018-2032)

  • North America Outlook (USD Billion, 2018-2032)

    • North America Commodity Plastic by Type
      • Polyethylene
      • Polypropylene
      • Polyethylene Terephthalate
      • Polystyrene
      • Others
    • North America Commodity Plastic by Application
      • Packaging
      • Consumer Goods
      • Electronics
      • Automotive
      • Textile
      • Pharmaceuticals
      • Others
    • US Outlook (USD Billion, 2018-2032)

    • US Commodity Plastic by Type
      • Polyethylene
      • Polypropylene
      • Polyethylene Terephthalate
      • Polystyrene
      • Others
    • US Commodity Plastic by Application
      • Packaging
      • Consumer Goods
      • Electronics
      • Automotive
      • Textile
      • Pharmaceuticals
      • Others
    • Canada Outlook (USD Billion, 2018-2032)

    • Canada Commodity Plastic by Type
      • Polyethylene
      • Polypropylene
      • Polyethylene Terephthalate
      • Polystyrene
      • Others
    • Canada Commodity Plastic by Application
      • Packaging
      • Consumer Goods
      • Electronics
      • Automotive
      • Textile
      • Pharmaceuticals
      • Others
  • Europe Outlook (USD Billion, 2018-2032)

    • Europe Commodity Plastic by Type
      • Polyethylene
      • Polypropylene
      • Polyethylene Terephthalate
      • Polystyrene
      • Others
    • Europe Commodity Plastic by Application
      • Packaging
      • Consumer Goods
      • Electronics
      • Automotive
      • Textile
      • Pharmaceuticals
      • Others
    • Germany Outlook (USD Billion, 2018-2032)

    • Germany Commodity Plastic by Type
      • Polyethylene
      • Polypropylene
      • Polyethylene Terephthalate
      • Polystyrene
      • Others
    • Germany Commodity Plastic by Application
      • Packaging
      • Consumer Goods
      • Electronics
      • Automotive
      • Textile
      • Pharmaceuticals
      • Others
    • France Outlook (USD Billion, 2018-2032)

    • France Commodity Plastic by Type
      • Polyethylene
      • Polypropylene
      • Polyethylene Terephthalate
      • Polystyrene
      • Others
    • France Commodity Plastic by Application
      • Packaging
      • Consumer Goods
      • Electronics
      • Automotive
      • Textile
      • Pharmaceuticals
      • Others
    • UK Outlook (USD Billion, 2018-2032)

    • UK Commodity Plastic by Type
      • Polyethylene
      • Polypropylene
      • Polyethylene Terephthalate
      • Polystyrene
      • Others
    • UK Commodity Plastic by Application
      • Packaging
      • Consumer Goods
      • Electronics
      • Automotive
      • Textile
      • Pharmaceuticals
      • Others
    • Italy Outlook (USD Billion, 2018-2032)

    • Italy Commodity Plastic by Type
      • Polyethylene
      • Polypropylene
      • Polyethylene Terephthalate
      • Polystyrene
      • Others
    • Italy Commodity Plastic by Application
      • Packaging
      • Consumer Goods
      • Electronics
      • Automotive
      • Textile
      • Pharmaceuticals
      • Others
    • Spain Outlook (USD Billion, 2018-2032)

    • Spain Commodity Plastic by Type
      • Polyethylene
      • Polypropylene
      • Polyethylene Terephthalate
      • Polystyrene
      • Others
    • Spain Commodity Plastic by Application
      • Packaging
      • Consumer Goods
      • Electronics
      • Automotive
      • Textile
      • Pharmaceuticals
      • Others
    • Rest Of Europe Outlook (USD Billion, 2018-2032)

    • Rest Of Europe Commodity Plastic by Type
      • Polyethylene
      • Polypropylene
      • Polyethylene Terephthalate
      • Polystyrene
      • Others
    • Rest Of Europe Commodity Plastic by Application
      • Packaging
      • Consumer Goods
      • Electronics
      • Automotive
      • Textile
      • Pharmaceuticals
      • Others
  • Asia-Pacific Outlook (USD Billion, 2018-2032)

    • Asia-Pacific Commodity Plastic by Type
      • Polyethylene
      • Polypropylene
      • Polyethylene Terephthalate
      • Polystyrene
      • Others
    • Asia-Pacific Commodity Plastic by Application
      • Packaging
      • Consumer Goods
      • Electronics
      • Automotive
      • Textile
      • Pharmaceuticals
      • Others
    • China Outlook (USD Billion, 2018-2032)

    • China Commodity Plastic by Type
      • Polyethylene
      • Polypropylene
      • Polyethylene Terephthalate
      • Polystyrene
      • Others
    • China Commodity Plastic by Application
      • Packaging
      • Consumer Goods
      • Electronics
      • Automotive
      • Textile
      • Pharmaceuticals
      • Others
    • Japan Outlook (USD Billion, 2018-2032)

    • Japan Commodity Plastic by Type
      • Polyethylene
      • Polypropylene
      • Polyethylene Terephthalate
      • Polystyrene
      • Others
    • Japan Commodity Plastic by Application
      • Packaging
      • Consumer Goods
      • Electronics
      • Automotive
      • Textile
      • Pharmaceuticals
      • Others
    • India Outlook (USD Billion, 2018-2032)

    • India Commodity Plastic by Type
      • Polyethylene
      • Polypropylene
      • Polyethylene Terephthalate
      • Polystyrene
      • Others
    • India Commodity Plastic by Application
      • Packaging
      • Consumer Goods
      • Electronics
      • Automotive
      • Textile
      • Pharmaceuticals
      • Others
    • Australia Outlook (USD Billion, 2018-2032)

    • Australia Commodity Plastic by Type
      • Polyethylene
      • Polypropylene
      • Polyethylene Terephthalate
      • Polystyrene
      • Others
    • Australia Commodity Plastic by Application
      • Packaging
      • Consumer Goods
      • Electronics
      • Automotive
      • Textile
      • Pharmaceuticals
      • Others
    • Rest of Asia-Pacific Outlook (USD Billion, 2018-2032)

    • Rest of Asia-Pacific Commodity Plastic by Type
      • Polyethylene
      • Polypropylene
      • Polyethylene Terephthalate
      • Polystyrene
      • Others
    • Rest of Asia-Pacific Commodity Plastic by Application
      • Packaging
      • Consumer Goods
      • Electronics
      • Automotive
      • Textile
      • Pharmaceuticals
      • Others
  • Rest of the World Outlook (USD Billion, 2018-2032)

    • Rest of the World Commodity Plastic by Type
      • Polyethylene
      • Polypropylene
      • Polyethylene Terephthalate
      • Polystyrene
      • Others
    • Rest of the World Commodity Plastic by Application
      • Packaging
      • Consumer Goods
      • Electronics
      • Automotive
      • Textile
      • Pharmaceuticals
      • Others
    • Middle East Outlook (USD Billion, 2018-2032)

    • Middle East Commodity Plastic by Type
      • Polyethylene
      • Polypropylene
      • Polyethylene Terephthalate
      • Polystyrene
      • Others
    • Middle East Commodity Plastic by Application
      • Packaging
      • Consumer Goods
      • Electronics
      • Automotive
      • Textile
      • Pharmaceuticals
      • Others
    • Africa Outlook (USD Billion, 2018-2032)

    • Africa Commodity Plastic by Type
      • Polyethylene
      • Polypropylene
      • Polyethylene Terephthalate
      • Polystyrene
      • Others
    • Africa Commodity Plastic by Application
      • Packaging
      • Consumer Goods
      • Electronics
      • Automotive
      • Textile
      • Pharmaceuticals
      • Others
    • Latin America Outlook (USD Billion, 2018-2032)

    • Latin America Commodity Plastic by Type
      • Polyethylene
      • Polypropylene
      • Polyethylene Terephthalate
      • Polystyrene
      • Others
    • Latin America Commodity Plastic by Application
      • Packaging
      • Consumer Goods
      • Electronics
      • Automotive
      • Textile
      • Pharmaceuticals
      • Others
Infographic

Free Sample Request

Kindly complete the form below to receive a free sample of this Report

Get Free Sample

Customer Strories

“I am very pleased with how market segments have been defined in a relevant way for my purposes (such as "Portable Freezers & refrigerators" and "last-mile"). In general the report is well structured. Thanks very much for your efforts.”

Victoria Milne

Founder

Compare Licence

×
Features License Type
Single User Multiuser License Enterprise User
Price $4,950 $5,950 $7,250
Maximum User Access Limit 1 User Upto 10 Users Unrestricted Access Throughout the Organization
Free Customization
Direct Access to Analyst
Deliverable Format
Platform Access
Discount on Next Purchase 10% 15% 15%
Printable Versions