×
  • Cat-intel
  • MedIntelliX
  • Resources
  • About Us
  • Hero Background
    English
    Chinese
    French
    Japanese
    Korean
    German
    Spanish

    Data Center Virtualization Market Share

    ID: MRFR/ICT/2316-HCR
    100 Pages
    Aarti Dhapte
    October 2025

    Data Center Virtualization Market Research Report: Information By Type (Server, Storage, Network, and Desktop), By organization Size (Small and Medium-Sized Enterprises (SMEs) and Large Enterprises), By Vertical (BFSI, IT & Telecommunication, Manufacturing & Automotive, Government, Healthcare, and Others), And By Region (North America, Europe, Asia-Pacific, And Rest Of The World) –Marke...

    Share:
    Download PDF ×

    We do not share your information with anyone. However, we may send you emails based on your report interest from time to time. You may contact us at any time to opt-out.

    Data Center Virtualization Market Infographic
    Purchase Options

    Market Share

    Data Center Virtualization Market Share Analysis

    The Data Center Virtualization market is influenced by a spectrum of factors that collectively mold its growth and impact its dynamics. A primary driving force is the relentless demand for increased efficiency and flexibility in data management. Data center virtualization, which involves creating virtual representations of computing resources, storage, and networks, allows organizations to optimize resource utilization, enhance scalability, and streamline data operations. This becomes especially critical in an era where businesses are navigating vast amounts of data and seeking agile solutions to meet ever-evolving computing needs.

    Cost considerations play a pivotal role in shaping the dynamics of the Data Center Virtualization market. The virtualization of data center infrastructure often translates into significant cost savings. By consolidating servers, reducing physical hardware requirements, and minimizing energy consumption, organizations can achieve cost efficiencies while maintaining or improving overall performance. The appeal of cost-effective solutions drives the adoption of data center virtualization across various industries.

    Scalability is another key factor influencing the Data Center Virtualization market. The ability to scale computing resources dynamically in response to changing demands is a critical advantage of virtualization. Businesses can adapt their data center capacities without the need for extensive physical upgrades, enabling them to meet the fluctuating requirements of their applications and workloads efficiently. This scalability factor contributes to the attractiveness of data center virtualization solutions.

    Security considerations are paramount in the Data Center Virtualization market, given the sensitivity of the data and applications hosted in virtualized environments. Virtualization security technologies, such as hypervisor security and network segmentation, are essential to protect against potential threats. The capability of data center virtualization solutions to provide robust security measures influences their adoption, particularly as organizations prioritize safeguarding their digital assets.

    Interoperability is a critical consideration in the Data Center Virtualization market. The ability of virtualized environments to seamlessly integrate with existing IT infrastructure and support diverse applications is essential for their successful deployment. Compatibility with different operating systems, applications, and hardware platforms enhances the flexibility and adaptability of data center virtualization solutions, making them more appealing to organizations with diverse technology stacks.

    Technological advancements and innovation are inherent to the Data Center Virtualization market. Continuous research and development efforts focus on enhancing the features and capabilities of virtualization technologies. Integration of artificial intelligence and machine learning, automation, and orchestration tools contributes to the evolution of data center virtualization, enabling more intelligent resource management, predictive analytics, and efficient workload optimization.

    Competition among data center virtualization solution providers shapes the overall landscape of the market. Industry leaders such as VMware, Microsoft, and Citrix, along with a host of other players, compete to offer comprehensive and scalable virtualization solutions. Strategic partnerships, collaborations, and acquisitions contribute to the competitive dynamics, influencing the choices available to businesses seeking data center virtualization solutions.

    Regulatory compliance and adherence to industry standards impact the Data Center Virtualization market. Organizations must ensure that their virtualized environments comply with data protection regulations and industry-specific requirements. The ability of data center virtualization solutions to facilitate compliance, secure sensitive data, and support auditing processes becomes a critical factor in their adoption, particularly in regulated industries such as finance and healthcare.

    Environmental sustainability is gaining prominence as a market factor. Green initiatives, such as energy-efficient data centers and environmentally conscious hardware designs, contribute to the overall appeal of data center virtualization solutions. Businesses increasingly consider the environmental impact of their technology choices, and virtualization aligns with the goal of achieving sustainability in data center operations.

    Author
    Aarti Dhapte
    Team Lead - Research

    She holds an experience of about 6+ years in Market Research and Business Consulting, working under the spectrum of Information Communication Technology, Telecommunications and Semiconductor domains. Aarti conceptualizes and implements a scalable business strategy and provides strategic leadership to the clients. Her expertise lies in market estimation, competitive intelligence, pipeline analysis, customer assessment, etc.

    Leave a Comment

    FAQs

    How much is the Data Center Virtualization market?

    The Data Center Virtualization market size was valued at USD 5.64 Billion in 2023.

    What is the growth rate of the Data Center Virtualization market?

    The market is projected to grow at a CAGR of 15.15% during the forecast period, 2024-2032.

    Which region held the largest market share in the Data Center Virtualization market?

    North America had the largest share in the market

    Who are the key players in the Data Center Virtualization market?

    The key players in the market are ATTO Technology, Inc. AT&T, Cisco Systems, Inc., Dell Inc., Fujitsu, HCL Technologies Limited, Hewlett Packard Enterprise Development LP,.

    Which organization size led the Data Center Virtualization market?

    The Large Enterprises category dominated the market in 2022.

    Which Vertical had the largest market share in the Data Center Virtualization market?

    The IT & Telecommunication had the largest share in the market.

    Market Summary

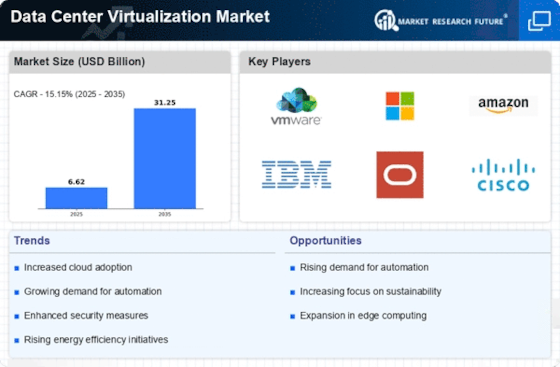
    As per MRFR analysis, the Data Center Virtualization Market Size was estimated at 6.62 USD Billion in 2024. The Data Center Virtualization industry is projected to grow from 7.623 USD Billion in 2025 to 31.25 USD Billion by 2035, exhibiting a compound annual growth rate (CAGR) of 15.15 during the forecast period 2025 - 2035.

    Key Market Trends & Highlights

    The Data Center Virtualization Market is experiencing robust growth driven by technological advancements and evolving business needs.

    • The market witnesses increased adoption of hybrid cloud solutions, particularly in North America, which remains the largest market.
    • Enhanced security measures are becoming a focal point for organizations, especially among small and medium-sized enterprises.
    • Energy efficiency and sustainability initiatives are gaining traction, particularly in the rapidly growing Asia-Pacific region.
    • Rising demand for scalability and cost reduction initiatives are key drivers propelling the market forward.

    Market Size & Forecast

    2024 Market Size 6.62 (USD Billion)
    2035 Market Size 31.25 (USD Billion)
    CAGR (2025 - 2035) 15.15%
    Largest Regional Market Share in 2024 North America

    Major Players

    <p>VMware (US), Microsoft (US), Amazon (US), IBM (US), Oracle (US), Cisco (US), Nutanix (US), Red Hat (US), Citrix (US), Hewlett Packard Enterprise (US)</p>

    Market Trends

    The Data Center Virtualization Market is currently experiencing a transformative phase, driven by the increasing demand for efficient resource management and cost reduction. Organizations are increasingly adopting virtualization technologies to optimize their IT infrastructure, enabling them to enhance operational efficiency and scalability. This shift is largely influenced by the growing need for cloud computing solutions, which necessitate robust virtualization strategies to support dynamic workloads and ensure seamless service delivery. Furthermore, the rise of remote work and digital transformation initiatives has accelerated the adoption of virtualization, as businesses seek to maintain agility and responsiveness in a rapidly evolving landscape. In addition, the Data Center Virtualization Market is witnessing advancements in technologies such as artificial intelligence and machine learning, which are being integrated into virtualization solutions. These innovations appear to enhance automation, improve resource allocation, and facilitate predictive analytics, thereby enabling organizations to make informed decisions regarding their IT environments. As the market continues to evolve, it seems likely that the focus will shift towards hybrid and multi-cloud strategies, allowing businesses to leverage the benefits of various cloud environments while maintaining control over their data and applications. Overall, the Data Center Virtualization Market is poised for substantial growth, driven by technological advancements and changing business needs.

    Increased Adoption of Hybrid Cloud Solutions

    Organizations are increasingly gravitating towards hybrid cloud models, which combine on-premises infrastructure with public cloud services. This trend allows businesses to maintain control over sensitive data while leveraging the scalability and flexibility of cloud resources. As a result, the Data Center Virtualization Market is likely to see a surge in demand for solutions that facilitate seamless integration between different environments.

    Focus on Enhanced Security Measures

    With the rise of cyber threats, there is a growing emphasis on security within the Data Center Virtualization Market. Companies are prioritizing solutions that offer robust security features, such as encryption and access controls, to protect their virtualized environments. This trend indicates a shift towards more secure virtualization practices, ensuring that organizations can safeguard their data and applications.

    Emphasis on Energy Efficiency and Sustainability

    As environmental concerns gain prominence, organizations are increasingly seeking energy-efficient virtualization solutions. The Data Center Virtualization Market is responding to this demand by developing technologies that reduce energy consumption and carbon footprints. This trend suggests a broader commitment to sustainability, as businesses aim to align their IT strategies with environmental goals.

    Data Center Virtualization Market Market Drivers

    Cost Reduction Initiatives

    Cost efficiency remains a pivotal driver in the Data Center Virtualization Market. Organizations are increasingly adopting virtualization technologies to reduce operational expenses associated with hardware and maintenance. By consolidating servers and optimizing resource allocation, companies can significantly lower their capital expenditures. Recent statistics indicate that businesses can save up to 30 percent on IT costs through effective virtualization strategies. This financial incentive is compelling, particularly for small to medium-sized enterprises that may have limited budgets. As the pressure to maintain profitability intensifies, the focus on cost reduction through virtualization is likely to continue shaping the landscape of the Data Center Virtualization Market.

    Rising Demand for Scalability

    The Data Center Virtualization Market is experiencing a notable surge in demand for scalability solutions. Organizations are increasingly seeking to expand their IT infrastructure without incurring substantial costs. Virtualization allows for the dynamic allocation of resources, enabling businesses to scale their operations efficiently. According to recent data, the virtualization market is projected to grow at a compound annual growth rate of approximately 15 percent over the next five years. This growth is driven by the need for businesses to adapt to fluctuating workloads and the desire to optimize resource utilization. As companies continue to embrace digital transformation, the ability to scale operations seamlessly becomes a critical factor in their success, thereby propelling the Data Center Virtualization Market forward.

    Growing Need for Remote Work Solutions

    The Data Center Virtualization Market is significantly influenced by the growing need for remote work solutions. As organizations adapt to flexible work arrangements, the demand for virtualized environments that support remote access has surged. Virtualization enables employees to access critical applications and data from any location, fostering productivity and collaboration. Recent data suggests that the remote work trend is likely to persist, with over 50 percent of companies planning to maintain flexible work policies. This shift necessitates robust virtualization solutions that can accommodate remote access securely and efficiently. Consequently, the Data Center Virtualization Market is poised for growth as businesses invest in technologies that support a distributed workforce.

    Advancements in Virtualization Technologies

    Technological advancements play a crucial role in shaping the Data Center Virtualization Market. Innovations in virtualization technologies, such as containerization and hyper-converged infrastructure, are enhancing the capabilities of data centers. These advancements allow for improved resource management, increased performance, and greater flexibility in deploying applications. Recent reports indicate that the adoption of hyper-converged infrastructure is expected to grow by over 25 percent in the coming years, reflecting the industry's shift towards more integrated solutions. As organizations seek to leverage cutting-edge technologies to optimize their operations, the Data Center Virtualization Market is likely to benefit from these ongoing advancements, driving further investment and development.

    Increased Focus on Disaster Recovery Solutions

    The Data Center Virtualization Market is witnessing a heightened emphasis on disaster recovery solutions. Organizations are recognizing the importance of ensuring business continuity in the face of unforeseen disruptions. Virtualization technologies facilitate robust disaster recovery strategies by enabling quick data backup and recovery processes. Recent surveys indicate that nearly 70 percent of businesses consider disaster recovery a top priority, further driving the demand for virtualization solutions. As companies seek to mitigate risks associated with data loss and downtime, the integration of virtualization into their disaster recovery plans becomes increasingly vital. This trend is expected to bolster the Data Center Virtualization Market as organizations invest in resilient infrastructure.

    Market Segment Insights

    By Type: Server (Largest) vs. Network (Fastest-Growing)

    <p>In the Data Center Virtualization Market, the segment distribution reveals that Server virtualization holds the largest market share, driven by its essential role in enhancing data center efficiency. Storage and Network segments follow, exhibiting varying degrees of influence based on organizational needs. Desktop virtualization, while significant, remains behind in overall market share, as enterprises increasingly favor solutions that deliver robust scalability and resource management. This trend underscores a clear preference for server-based solutions as fundamental to modern virtualization strategies.</p>

    <p>Technology: Server (Dominant) vs. Network (Emerging)</p>

    <p>The Server segment continues to dominate the Data Center Virtualization Market, owing to its pivotal role in centralizing processing power and resource management. Organizations increasingly rely on server virtualization to streamline their operations and improve workload efficiency. In contrast, the Network segment is emerging rapidly, fueled by advancements in software-defined networking (SDN) and the rising demand for enhanced connectivity and network automation. This growth reflects organizations' need to support dynamic workloads and improve operational flexibility, making network virtualization an increasingly vital facet of data center strategies.</p>

    By Organization Size: Small and Medium-Sized Enterprises (Largest) vs. Large Enterprises (Fastest-Growing)

    <p>In the Data Center Virtualization Market, Small and Medium-Sized Enterprises (SMEs) currently hold the largest share due to their increasing need for cost-efficient solutions and the agility offered by virtualization technologies. SMEs are leveraging these solutions to optimize their operations and improve scalability. Meanwhile, Large Enterprises are rapidly catching up as they invest in more extensive infrastructure and advanced virtualization tools to support their extensive operations in a competitive market, driving significant changes in market dynamics.</p>

    <p>SMEs (Dominant) vs. Large Enterprises (Emerging)</p>

    <p>Small and Medium-Sized Enterprises (SMEs) represent the dominant segment in the Data Center Virtualization Market, often characterized by their requirement for flexible and scalable IT solutions that provide a competitive edge. They typically adopt virtualization technologies to reduce costs and enhance operational efficiency as they scale. On the other hand, Large Enterprises are an emerging force. They are increasingly adopting advanced virtualization strategies to streamline their vast IT infrastructures, with a focus on innovation and cloud integration. This segment is marked by significant investments aimed at enhancing performance and increasing the ROI on IT expenditures.</p>

    By Vertical: IT & Telecommunication (Largest) vs. BFSI (Fastest-Growing)

    <p>In the Data Center Virtualization Market, the IT & Telecommunication sector holds the largest market share, underscoring its critical role in managing vast data requirements and providing seamless connectivity. This segment significantly influences market dynamics due to its extensive adoption of virtualization technologies, which optimize resource management and improve operational efficiency. Meanwhile, the BFSI sector is emerging as the fastest-growing portion of the market, catalyzed by increasing demands for agile and secure IT solutions to handle sensitive financial data and enhance customer service.</p>

    <p>IT & Telecommunication: Dominant vs. BFSI: Emerging</p>

    <p>The IT & Telecommunication sector stands as the dominant force within the Data Center Virtualization Market, driven by the necessity for ongoing innovation and infrastructure efficiency. This segment benefits from rapid technological adoption and the need for scalable solutions to cope with the growing demand for data services. Conversely, the BFSI segment is an emerging player, characterized by its focus on robust security measures and compliance with regulatory standards. The acceleration towards digital banking and financial technologies positions BFSI favorably, as institutions seek to leverage virtualization to enhance service delivery and data management capabilities.</p>

    Get more detailed insights about Data Center Virtualization Market Research Report- Global Forecast 2035

    Regional Insights

    By region, the study provides market insights into North America, Europe, Asia-Pacific and the Rest of the World. The North American, Data Center Virtualization market will dominate this market; The region has been at the forefront of adopting new technology, contributing significantly to the region's progress.

    Further, the major countries studied in the market report are The US, Canada, the UK, Italy, Spain, China, Japan, India, German, France, Australia, South Korea, and Brazil.

    Figure 2: DATA CENTER VIRTUALIZATION MARKET SHARE BY REGION 2022 (USD Billion)

    DATA CENTER VIRTUALIZATION MARKET SHARE BY REGION

    Source: Secondary Research, Primary Research, Market Research Future Database and Analyst Review

    Europe has the second-largest market share for Data Centre Virtualization. Cloud adoption is also significant in this region, with cloud service providers improving and growing their infrastructure by integrating virtualization applications and services. Furthermore, the German Data Centre Virtualization market dominated, while the UK Data Centre Virtualization market grew fastest in Europe.

    From 2023 to 2032, the Asia-Pacific Data Centre Virtualization Market is predicted to develop at the quickest CAGR. The region's expansion may be ascribed to causes such as increased data centers, improved digital infrastructure, corporate digitalization, increased acceptance of cloud services, and the cost-effective elements of data center virtualization. Furthermore, China's Data Centre Virtualization market had the highest market share, while India's Data Centre Virtualization market was the fastest expanding in the Asia-Pacific region.

    Key Players and Competitive Insights

    The Data Center Virtualization Market is currently characterized by a dynamic competitive landscape, driven by rapid technological advancements and increasing demand for efficient data management solutions. Major players such as VMware (US), Microsoft (US), and Amazon (US) are at the forefront, each adopting distinct strategies to enhance their market positioning. VMware (US) continues to focus on innovation, particularly in hybrid cloud solutions, while Microsoft (US) emphasizes its Azure platform's integration capabilities. Amazon (US), leveraging its extensive cloud infrastructure, aims to provide scalable virtualization solutions that cater to diverse business needs. Collectively, these strategies not only enhance their competitive edge but also contribute to a more integrated and efficient market environment.

    In terms of business tactics, companies are increasingly localizing their operations to better serve regional markets, optimizing supply chains to enhance efficiency and reduce costs. The competitive structure of the Data Center Virtualization Market appears moderately fragmented, with several key players exerting substantial influence. This fragmentation allows for a variety of solutions and innovations, fostering a competitive atmosphere that encourages continuous improvement and adaptation among market participants.

    In August 2025, VMware (US) announced a strategic partnership with a leading telecommunications provider to enhance its edge computing capabilities. This collaboration is poised to expand VMware's reach into new markets, enabling it to offer more robust solutions that cater to the growing demand for edge computing in data center virtualization. The partnership signifies VMware's commitment to staying ahead in a rapidly evolving technological landscape.

    In September 2025, Microsoft (US) unveiled a new suite of AI-driven tools integrated into its Azure platform, aimed at optimizing data center operations. This move not only reinforces Microsoft's position as a leader in cloud services but also highlights the increasing importance of artificial intelligence in data center management. By leveraging AI, Microsoft seeks to enhance operational efficiency and provide clients with predictive analytics capabilities, thereby solidifying its competitive advantage.

    In October 2025, Amazon (US) launched an innovative virtualization service that utilizes machine learning algorithms to optimize resource allocation in real-time. This service is expected to significantly reduce operational costs for businesses while improving performance metrics. Amazon's focus on integrating advanced technologies into its offerings reflects a broader trend within the industry, where companies are increasingly prioritizing technological innovation to differentiate themselves in a crowded market.

    As of October 2025, the Data Center Virtualization Market is witnessing a shift towards digitalization, sustainability, and AI integration. Strategic alliances among key players are becoming increasingly prevalent, fostering collaboration that enhances technological capabilities and market reach. Looking ahead, competitive differentiation is likely to evolve, with a pronounced shift from price-based competition to a focus on innovation, technology, and supply chain reliability. This transition underscores the necessity for companies to adapt and innovate continuously to maintain their competitive edge in an ever-changing market.

    Key Companies in the Data Center Virtualization Market market include

    Industry Developments

    • Q1 2025: What's next for data centers in 2025 - WWT In early 2025, companies are actively prioritizing their virtualization strategies, with many revisiting their on-premises virtualization solutions due to market shifts, new pricing strategies, and the introduction of new products and players. This trend is prompting organizations to re-evaluate their current hypervisor vendors and consider migrations or optimizations for their data center virtualization needs.

    Future Outlook

    Data Center Virtualization Market Future Outlook

    <p>The Data Center Virtualization Market is projected to grow at a 15.15% CAGR from 2024 to 2035, driven by increasing cloud adoption, operational efficiency, and demand for scalable solutions.</p>

    New opportunities lie in:

    • <p>Development of AI-driven resource allocation tools</p>
    • <p>Expansion of hybrid cloud integration services</p>
    • <p>Creation of advanced security frameworks for virtual environments</p>

    <p>By 2035, the market is expected to be robust, reflecting substantial growth and innovation.</p>

    Market Segmentation

    Data Center Virtualization Market Type Outlook

    • Server
    • Storage
    • Network
    • Desktop

    Data Center Virtualization Market Vertical Outlook

    • BFSI
    • IT & Telecommunication
    • Manufacturing & Automotive
    • Government
    • Healthcare
    • Others

    Data Center Virtualization Market Organization Size Outlook

    • Small and Medium-Sized Enterprises (SMEs)
    • Large Enterprises

    Report Scope

    MARKET SIZE 20246.62(USD Billion)
    MARKET SIZE 20257.623(USD Billion)
    MARKET SIZE 203531.25(USD Billion)
    COMPOUND ANNUAL GROWTH RATE (CAGR)15.15% (2024 - 2035)
    REPORT COVERAGERevenue Forecast, Competitive Landscape, Growth Factors, and Trends
    BASE YEAR2024
    Market Forecast Period2025 - 2035
    Historical Data2019 - 2024
    Market Forecast UnitsUSD Billion
    Key Companies ProfiledMarket analysis in progress
    Segments CoveredMarket segmentation analysis in progress
    Key Market OpportunitiesIntegration of artificial intelligence enhances efficiency and scalability in the Data Center Virtualization Market.
    Key Market DynamicsRising demand for efficient resource management drives innovation and competition in the Data Center Virtualization Market.
    Countries CoveredNorth America, Europe, APAC, South America, MEA

    FAQs

    How much is the Data Center Virtualization market?

    The Data Center Virtualization market size was valued at USD 5.64 Billion in 2023.

    What is the growth rate of the Data Center Virtualization market?

    The market is projected to grow at a CAGR of 15.15% during the forecast period, 2024-2032.

    Which region held the largest market share in the Data Center Virtualization market?

    North America had the largest share in the market

    Who are the key players in the Data Center Virtualization market?

    The key players in the market are ATTO Technology, Inc. AT&amp;T, Cisco Systems, Inc., Dell Inc., Fujitsu, HCL Technologies Limited, Hewlett Packard Enterprise Development LP,.

    Which organization size led the Data Center Virtualization market?

    The Large Enterprises category dominated the market in 2022.

    Which Vertical had the largest market share in the Data Center Virtualization market?

    The IT &amp; Telecommunication had the largest share in the market.

    1. SECTION I: EXECUTIVE SUMMARY AND KEY HIGHLIGHTS
      1. | 1.1 EXECUTIVE SUMMARY
      2. | | 1.1.1 Market Overview
      3. | | 1.1.2 Key Findings
      4. | | 1.1.3 Market Segmentation
      5. | | 1.1.4 Competitive Landscape
      6. | | 1.1.5 Challenges and Opportunities
      7. | | 1.1.6 Future Outlook
    2. SECTION II: SCOPING, METHODOLOGY AND MARKET STRUCTURE
      1. | 2.1 MARKET INTRODUCTION
      2. | | 2.1.1 Definition
      3. | | 2.1.2 Scope of the study
      4. | | | 2.1.2.1 Research Objective
      5. | | | 2.1.2.2 Assumption
      6. | | | 2.1.2.3 Limitations
      7. | 2.2 RESEARCH METHODOLOGY
      8. | | 2.2.1 Overview
      9. | | 2.2.2 Data Mining
      10. | | 2.2.3 Secondary Research
      11. | | 2.2.4 Primary Research
      12. | | | 2.2.4.1 Primary Interviews and Information Gathering Process
      13. | | | 2.2.4.2 Breakdown of Primary Respondents
      14. | | 2.2.5 Forecasting Model
      15. | | 2.2.6 Market Size Estimation
      16. | | | 2.2.6.1 Bottom-Up Approach
      17. | | | 2.2.6.2 Top-Down Approach
      18. | | 2.2.7 Data Triangulation
      19. | | 2.2.8 Validation
    3. SECTION III: QUALITATIVE ANALYSIS
      1. | 3.1 MARKET DYNAMICS
      2. | | 3.1.1 Overview
      3. | | 3.1.2 Drivers
      4. | | 3.1.3 Restraints
      5. | | 3.1.4 Opportunities
      6. | 3.2 MARKET FACTOR ANALYSIS
      7. | | 3.2.1 Value chain Analysis
      8. | | 3.2.2 Porter's Five Forces Analysis
      9. | | | 3.2.2.1 Bargaining Power of Suppliers
      10. | | | 3.2.2.2 Bargaining Power of Buyers
      11. | | | 3.2.2.3 Threat of New Entrants
      12. | | | 3.2.2.4 Threat of Substitutes
      13. | | | 3.2.2.5 Intensity of Rivalry
      14. | | 3.2.3 COVID-19 Impact Analysis
      15. | | | 3.2.3.1 Market Impact Analysis
      16. | | | 3.2.3.2 Regional Impact
      17. | | | 3.2.3.3 Opportunity and Threat Analysis
    4. SECTION IV: QUANTITATIVE ANALYSIS
      1. | 4.1 Information and Communications Technology, BY Type (USD Billion)
      2. | | 4.1.1 Server
      3. | | 4.1.2 Storage
      4. | | 4.1.3 Network
      5. | | 4.1.4 Desktop
      6. | 4.2 Information and Communications Technology, BY Organization Size (USD Billion)
      7. | | 4.2.1 Small and Medium-Sized Enterprises (SMEs)
      8. | | 4.2.2 Large Enterprises
      9. | 4.3 Information and Communications Technology, BY Vertical (USD Billion)
      10. | | 4.3.1 BFSI
      11. | | 4.3.2 IT & Telecommunication
      12. | | 4.3.3 Manufacturing & Automotive
      13. | | 4.3.4 Government
      14. | | 4.3.5 Healthcare
      15. | | 4.3.6 Others
      16. | 4.4 Information and Communications Technology, BY Region (USD Billion)
      17. | | 4.4.1 North America
      18. | | | 4.4.1.1 US
      19. | | | 4.4.1.2 Canada
      20. | | 4.4.2 Europe
      21. | | | 4.4.2.1 Germany
      22. | | | 4.4.2.2 UK
      23. | | | 4.4.2.3 France
      24. | | | 4.4.2.4 Russia
      25. | | | 4.4.2.5 Italy
      26. | | | 4.4.2.6 Spain
      27. | | | 4.4.2.7 Rest of Europe
      28. | | 4.4.3 APAC
      29. | | | 4.4.3.1 China
      30. | | | 4.4.3.2 India
      31. | | | 4.4.3.3 Japan
      32. | | | 4.4.3.4 South Korea
      33. | | | 4.4.3.5 Malaysia
      34. | | | 4.4.3.6 Thailand
      35. | | | 4.4.3.7 Indonesia
      36. | | | 4.4.3.8 Rest of APAC
      37. | | 4.4.4 South America
      38. | | | 4.4.4.1 Brazil
      39. | | | 4.4.4.2 Mexico
      40. | | | 4.4.4.3 Argentina
      41. | | | 4.4.4.4 Rest of South America
      42. | | 4.4.5 MEA
      43. | | | 4.4.5.1 GCC Countries
      44. | | | 4.4.5.2 South Africa
      45. | | | 4.4.5.3 Rest of MEA
    5. SECTION V: COMPETITIVE ANALYSIS
      1. | 5.1 Competitive Landscape
      2. | | 5.1.1 Overview
      3. | | 5.1.2 Competitive Analysis
      4. | | 5.1.3 Market share Analysis
      5. | | 5.1.4 Major Growth Strategy in the Information and Communications Technology
      6. | | 5.1.5 Competitive Benchmarking
      7. | | 5.1.6 Leading Players in Terms of Number of Developments in the Information and Communications Technology
      8. | | 5.1.7 Key developments and growth strategies
      9. | | | 5.1.7.1 New Product Launch/Service Deployment
      10. | | | 5.1.7.2 Merger & Acquisitions
      11. | | | 5.1.7.3 Joint Ventures
      12. | | 5.1.8 Major Players Financial Matrix
      13. | | | 5.1.8.1 Sales and Operating Income
      14. | | | 5.1.8.2 Major Players R&D Expenditure. 2023
      15. | 5.2 Company Profiles
      16. | | 5.2.1 VMware (US)
      17. | | | 5.2.1.1 Financial Overview
      18. | | | 5.2.1.2 Products Offered
      19. | | | 5.2.1.3 Key Developments
      20. | | | 5.2.1.4 SWOT Analysis
      21. | | | 5.2.1.5 Key Strategies
      22. | | 5.2.2 Microsoft (US)
      23. | | | 5.2.2.1 Financial Overview
      24. | | | 5.2.2.2 Products Offered
      25. | | | 5.2.2.3 Key Developments
      26. | | | 5.2.2.4 SWOT Analysis
      27. | | | 5.2.2.5 Key Strategies
      28. | | 5.2.3 Amazon (US)
      29. | | | 5.2.3.1 Financial Overview
      30. | | | 5.2.3.2 Products Offered
      31. | | | 5.2.3.3 Key Developments
      32. | | | 5.2.3.4 SWOT Analysis
      33. | | | 5.2.3.5 Key Strategies
      34. | | 5.2.4 IBM (US)
      35. | | | 5.2.4.1 Financial Overview
      36. | | | 5.2.4.2 Products Offered
      37. | | | 5.2.4.3 Key Developments
      38. | | | 5.2.4.4 SWOT Analysis
      39. | | | 5.2.4.5 Key Strategies
      40. | | 5.2.5 Oracle (US)
      41. | | | 5.2.5.1 Financial Overview
      42. | | | 5.2.5.2 Products Offered
      43. | | | 5.2.5.3 Key Developments
      44. | | | 5.2.5.4 SWOT Analysis
      45. | | | 5.2.5.5 Key Strategies
      46. | | 5.2.6 Cisco (US)
      47. | | | 5.2.6.1 Financial Overview
      48. | | | 5.2.6.2 Products Offered
      49. | | | 5.2.6.3 Key Developments
      50. | | | 5.2.6.4 SWOT Analysis
      51. | | | 5.2.6.5 Key Strategies
      52. | | 5.2.7 Nutanix (US)
      53. | | | 5.2.7.1 Financial Overview
      54. | | | 5.2.7.2 Products Offered
      55. | | | 5.2.7.3 Key Developments
      56. | | | 5.2.7.4 SWOT Analysis
      57. | | | 5.2.7.5 Key Strategies
      58. | | 5.2.8 Red Hat (US)
      59. | | | 5.2.8.1 Financial Overview
      60. | | | 5.2.8.2 Products Offered
      61. | | | 5.2.8.3 Key Developments
      62. | | | 5.2.8.4 SWOT Analysis
      63. | | | 5.2.8.5 Key Strategies
      64. | | 5.2.9 Citrix (US)
      65. | | | 5.2.9.1 Financial Overview
      66. | | | 5.2.9.2 Products Offered
      67. | | | 5.2.9.3 Key Developments
      68. | | | 5.2.9.4 SWOT Analysis
      69. | | | 5.2.9.5 Key Strategies
      70. | | 5.2.10 Hewlett Packard Enterprise (US)
      71. | | | 5.2.10.1 Financial Overview
      72. | | | 5.2.10.2 Products Offered
      73. | | | 5.2.10.3 Key Developments
      74. | | | 5.2.10.4 SWOT Analysis
      75. | | | 5.2.10.5 Key Strategies
      76. | 5.3 Appendix
      77. | | 5.3.1 References
      78. | | 5.3.2 Related Reports
    6. LIST OF FIGURES
      1. | 6.1 MARKET SYNOPSIS
      2. | 6.2 NORTH AMERICA MARKET ANALYSIS
      3. | 6.3 US MARKET ANALYSIS BY TYPE
      4. | 6.4 US MARKET ANALYSIS BY ORGANIZATION SIZE
      5. | 6.5 US MARKET ANALYSIS BY VERTICAL
      6. | 6.6 CANADA MARKET ANALYSIS BY TYPE
      7. | 6.7 CANADA MARKET ANALYSIS BY ORGANIZATION SIZE
      8. | 6.8 CANADA MARKET ANALYSIS BY VERTICAL
      9. | 6.9 EUROPE MARKET ANALYSIS
      10. | 6.10 GERMANY MARKET ANALYSIS BY TYPE
      11. | 6.11 GERMANY MARKET ANALYSIS BY ORGANIZATION SIZE
      12. | 6.12 GERMANY MARKET ANALYSIS BY VERTICAL
      13. | 6.13 UK MARKET ANALYSIS BY TYPE
      14. | 6.14 UK MARKET ANALYSIS BY ORGANIZATION SIZE
      15. | 6.15 UK MARKET ANALYSIS BY VERTICAL
      16. | 6.16 FRANCE MARKET ANALYSIS BY TYPE
      17. | 6.17 FRANCE MARKET ANALYSIS BY ORGANIZATION SIZE
      18. | 6.18 FRANCE MARKET ANALYSIS BY VERTICAL
      19. | 6.19 RUSSIA MARKET ANALYSIS BY TYPE
      20. | 6.20 RUSSIA MARKET ANALYSIS BY ORGANIZATION SIZE
      21. | 6.21 RUSSIA MARKET ANALYSIS BY VERTICAL
      22. | 6.22 ITALY MARKET ANALYSIS BY TYPE
      23. | 6.23 ITALY MARKET ANALYSIS BY ORGANIZATION SIZE
      24. | 6.24 ITALY MARKET ANALYSIS BY VERTICAL
      25. | 6.25 SPAIN MARKET ANALYSIS BY TYPE
      26. | 6.26 SPAIN MARKET ANALYSIS BY ORGANIZATION SIZE
      27. | 6.27 SPAIN MARKET ANALYSIS BY VERTICAL
      28. | 6.28 REST OF EUROPE MARKET ANALYSIS BY TYPE
      29. | 6.29 REST OF EUROPE MARKET ANALYSIS BY ORGANIZATION SIZE
      30. | 6.30 REST OF EUROPE MARKET ANALYSIS BY VERTICAL
      31. | 6.31 APAC MARKET ANALYSIS
      32. | 6.32 CHINA MARKET ANALYSIS BY TYPE
      33. | 6.33 CHINA MARKET ANALYSIS BY ORGANIZATION SIZE
      34. | 6.34 CHINA MARKET ANALYSIS BY VERTICAL
      35. | 6.35 INDIA MARKET ANALYSIS BY TYPE
      36. | 6.36 INDIA MARKET ANALYSIS BY ORGANIZATION SIZE
      37. | 6.37 INDIA MARKET ANALYSIS BY VERTICAL
      38. | 6.38 JAPAN MARKET ANALYSIS BY TYPE
      39. | 6.39 JAPAN MARKET ANALYSIS BY ORGANIZATION SIZE
      40. | 6.40 JAPAN MARKET ANALYSIS BY VERTICAL
      41. | 6.41 SOUTH KOREA MARKET ANALYSIS BY TYPE
      42. | 6.42 SOUTH KOREA MARKET ANALYSIS BY ORGANIZATION SIZE
      43. | 6.43 SOUTH KOREA MARKET ANALYSIS BY VERTICAL
      44. | 6.44 MALAYSIA MARKET ANALYSIS BY TYPE
      45. | 6.45 MALAYSIA MARKET ANALYSIS BY ORGANIZATION SIZE
      46. | 6.46 MALAYSIA MARKET ANALYSIS BY VERTICAL
      47. | 6.47 THAILAND MARKET ANALYSIS BY TYPE
      48. | 6.48 THAILAND MARKET ANALYSIS BY ORGANIZATION SIZE
      49. | 6.49 THAILAND MARKET ANALYSIS BY VERTICAL
      50. | 6.50 INDONESIA MARKET ANALYSIS BY TYPE
      51. | 6.51 INDONESIA MARKET ANALYSIS BY ORGANIZATION SIZE
      52. | 6.52 INDONESIA MARKET ANALYSIS BY VERTICAL
      53. | 6.53 REST OF APAC MARKET ANALYSIS BY TYPE
      54. | 6.54 REST OF APAC MARKET ANALYSIS BY ORGANIZATION SIZE
      55. | 6.55 REST OF APAC MARKET ANALYSIS BY VERTICAL
      56. | 6.56 SOUTH AMERICA MARKET ANALYSIS
      57. | 6.57 BRAZIL MARKET ANALYSIS BY TYPE
      58. | 6.58 BRAZIL MARKET ANALYSIS BY ORGANIZATION SIZE
      59. | 6.59 BRAZIL MARKET ANALYSIS BY VERTICAL
      60. | 6.60 MEXICO MARKET ANALYSIS BY TYPE
      61. | 6.61 MEXICO MARKET ANALYSIS BY ORGANIZATION SIZE
      62. | 6.62 MEXICO MARKET ANALYSIS BY VERTICAL
      63. | 6.63 ARGENTINA MARKET ANALYSIS BY TYPE
      64. | 6.64 ARGENTINA MARKET ANALYSIS BY ORGANIZATION SIZE
      65. | 6.65 ARGENTINA MARKET ANALYSIS BY VERTICAL
      66. | 6.66 REST OF SOUTH AMERICA MARKET ANALYSIS BY TYPE
      67. | 6.67 REST OF SOUTH AMERICA MARKET ANALYSIS BY ORGANIZATION SIZE
      68. | 6.68 REST OF SOUTH AMERICA MARKET ANALYSIS BY VERTICAL
      69. | 6.69 MEA MARKET ANALYSIS
      70. | 6.70 GCC COUNTRIES MARKET ANALYSIS BY TYPE
      71. | 6.71 GCC COUNTRIES MARKET ANALYSIS BY ORGANIZATION SIZE
      72. | 6.72 GCC COUNTRIES MARKET ANALYSIS BY VERTICAL
      73. | 6.73 SOUTH AFRICA MARKET ANALYSIS BY TYPE
      74. | 6.74 SOUTH AFRICA MARKET ANALYSIS BY ORGANIZATION SIZE
      75. | 6.75 SOUTH AFRICA MARKET ANALYSIS BY VERTICAL
      76. | 6.76 REST OF MEA MARKET ANALYSIS BY TYPE
      77. | 6.77 REST OF MEA MARKET ANALYSIS BY ORGANIZATION SIZE
      78. | 6.78 REST OF MEA MARKET ANALYSIS BY VERTICAL
      79. | 6.79 KEY BUYING CRITERIA OF INFORMATION AND COMMUNICATIONS TECHNOLOGY
      80. | 6.80 RESEARCH PROCESS OF MRFR
      81. | 6.81 DRO ANALYSIS OF INFORMATION AND COMMUNICATIONS TECHNOLOGY
      82. | 6.82 DRIVERS IMPACT ANALYSIS: INFORMATION AND COMMUNICATIONS TECHNOLOGY
      83. | 6.83 RESTRAINTS IMPACT ANALYSIS: INFORMATION AND COMMUNICATIONS TECHNOLOGY
      84. | 6.84 SUPPLY / VALUE CHAIN: INFORMATION AND COMMUNICATIONS TECHNOLOGY
      85. | 6.85 INFORMATION AND COMMUNICATIONS TECHNOLOGY, BY TYPE, 2024 (% SHARE)
      86. | 6.86 INFORMATION AND COMMUNICATIONS TECHNOLOGY, BY TYPE, 2024 TO 2035 (USD Billion)
      87. | 6.87 INFORMATION AND COMMUNICATIONS TECHNOLOGY, BY ORGANIZATION SIZE, 2024 (% SHARE)
      88. | 6.88 INFORMATION AND COMMUNICATIONS TECHNOLOGY, BY ORGANIZATION SIZE, 2024 TO 2035 (USD Billion)
      89. | 6.89 INFORMATION AND COMMUNICATIONS TECHNOLOGY, BY VERTICAL, 2024 (% SHARE)
      90. | 6.90 INFORMATION AND COMMUNICATIONS TECHNOLOGY, BY VERTICAL, 2024 TO 2035 (USD Billion)
      91. | 6.91 BENCHMARKING OF MAJOR COMPETITORS
    7. LIST OF TABLES
      1. | 7.1 LIST OF ASSUMPTIONS
      2. | | 7.1.1
      3. | 7.2 North America MARKET SIZE ESTIMATES; FORECAST
      4. | | 7.2.1 BY TYPE, 2025-2035 (USD Billion)
      5. | | 7.2.2 BY ORGANIZATION SIZE, 2025-2035 (USD Billion)
      6. | | 7.2.3 BY VERTICAL, 2025-2035 (USD Billion)
      7. | 7.3 US MARKET SIZE ESTIMATES; FORECAST
      8. | | 7.3.1 BY TYPE, 2025-2035 (USD Billion)
      9. | | 7.3.2 BY ORGANIZATION SIZE, 2025-2035 (USD Billion)
      10. | | 7.3.3 BY VERTICAL, 2025-2035 (USD Billion)
      11. | 7.4 Canada MARKET SIZE ESTIMATES; FORECAST
      12. | | 7.4.1 BY TYPE, 2025-2035 (USD Billion)
      13. | | 7.4.2 BY ORGANIZATION SIZE, 2025-2035 (USD Billion)
      14. | | 7.4.3 BY VERTICAL, 2025-2035 (USD Billion)
      15. | 7.5 Europe MARKET SIZE ESTIMATES; FORECAST
      16. | | 7.5.1 BY TYPE, 2025-2035 (USD Billion)
      17. | | 7.5.2 BY ORGANIZATION SIZE, 2025-2035 (USD Billion)
      18. | | 7.5.3 BY VERTICAL, 2025-2035 (USD Billion)
      19. | 7.6 Germany MARKET SIZE ESTIMATES; FORECAST
      20. | | 7.6.1 BY TYPE, 2025-2035 (USD Billion)
      21. | | 7.6.2 BY ORGANIZATION SIZE, 2025-2035 (USD Billion)
      22. | | 7.6.3 BY VERTICAL, 2025-2035 (USD Billion)
      23. | 7.7 UK MARKET SIZE ESTIMATES; FORECAST
      24. | | 7.7.1 BY TYPE, 2025-2035 (USD Billion)
      25. | | 7.7.2 BY ORGANIZATION SIZE, 2025-2035 (USD Billion)
      26. | | 7.7.3 BY VERTICAL, 2025-2035 (USD Billion)
      27. | 7.8 France MARKET SIZE ESTIMATES; FORECAST
      28. | | 7.8.1 BY TYPE, 2025-2035 (USD Billion)
      29. | | 7.8.2 BY ORGANIZATION SIZE, 2025-2035 (USD Billion)
      30. | | 7.8.3 BY VERTICAL, 2025-2035 (USD Billion)
      31. | 7.9 Russia MARKET SIZE ESTIMATES; FORECAST
      32. | | 7.9.1 BY TYPE, 2025-2035 (USD Billion)
      33. | | 7.9.2 BY ORGANIZATION SIZE, 2025-2035 (USD Billion)
      34. | | 7.9.3 BY VERTICAL, 2025-2035 (USD Billion)
      35. | 7.10 Italy MARKET SIZE ESTIMATES; FORECAST
      36. | | 7.10.1 BY TYPE, 2025-2035 (USD Billion)
      37. | | 7.10.2 BY ORGANIZATION SIZE, 2025-2035 (USD Billion)
      38. | | 7.10.3 BY VERTICAL, 2025-2035 (USD Billion)
      39. | 7.11 Spain MARKET SIZE ESTIMATES; FORECAST
      40. | | 7.11.1 BY TYPE, 2025-2035 (USD Billion)
      41. | | 7.11.2 BY ORGANIZATION SIZE, 2025-2035 (USD Billion)
      42. | | 7.11.3 BY VERTICAL, 2025-2035 (USD Billion)
      43. | 7.12 Rest of Europe MARKET SIZE ESTIMATES; FORECAST
      44. | | 7.12.1 BY TYPE, 2025-2035 (USD Billion)
      45. | | 7.12.2 BY ORGANIZATION SIZE, 2025-2035 (USD Billion)
      46. | | 7.12.3 BY VERTICAL, 2025-2035 (USD Billion)
      47. | 7.13 APAC MARKET SIZE ESTIMATES; FORECAST
      48. | | 7.13.1 BY TYPE, 2025-2035 (USD Billion)
      49. | | 7.13.2 BY ORGANIZATION SIZE, 2025-2035 (USD Billion)
      50. | | 7.13.3 BY VERTICAL, 2025-2035 (USD Billion)
      51. | 7.14 China MARKET SIZE ESTIMATES; FORECAST
      52. | | 7.14.1 BY TYPE, 2025-2035 (USD Billion)
      53. | | 7.14.2 BY ORGANIZATION SIZE, 2025-2035 (USD Billion)
      54. | | 7.14.3 BY VERTICAL, 2025-2035 (USD Billion)
      55. | 7.15 India MARKET SIZE ESTIMATES; FORECAST
      56. | | 7.15.1 BY TYPE, 2025-2035 (USD Billion)
      57. | | 7.15.2 BY ORGANIZATION SIZE, 2025-2035 (USD Billion)
      58. | | 7.15.3 BY VERTICAL, 2025-2035 (USD Billion)
      59. | 7.16 Japan MARKET SIZE ESTIMATES; FORECAST
      60. | | 7.16.1 BY TYPE, 2025-2035 (USD Billion)
      61. | | 7.16.2 BY ORGANIZATION SIZE, 2025-2035 (USD Billion)
      62. | | 7.16.3 BY VERTICAL, 2025-2035 (USD Billion)
      63. | 7.17 South Korea MARKET SIZE ESTIMATES; FORECAST
      64. | | 7.17.1 BY TYPE, 2025-2035 (USD Billion)
      65. | | 7.17.2 BY ORGANIZATION SIZE, 2025-2035 (USD Billion)
      66. | | 7.17.3 BY VERTICAL, 2025-2035 (USD Billion)
      67. | 7.18 Malaysia MARKET SIZE ESTIMATES; FORECAST
      68. | | 7.18.1 BY TYPE, 2025-2035 (USD Billion)
      69. | | 7.18.2 BY ORGANIZATION SIZE, 2025-2035 (USD Billion)
      70. | | 7.18.3 BY VERTICAL, 2025-2035 (USD Billion)
      71. | 7.19 Thailand MARKET SIZE ESTIMATES; FORECAST
      72. | | 7.19.1 BY TYPE, 2025-2035 (USD Billion)
      73. | | 7.19.2 BY ORGANIZATION SIZE, 2025-2035 (USD Billion)
      74. | | 7.19.3 BY VERTICAL, 2025-2035 (USD Billion)
      75. | 7.20 Indonesia MARKET SIZE ESTIMATES; FORECAST
      76. | | 7.20.1 BY TYPE, 2025-2035 (USD Billion)
      77. | | 7.20.2 BY ORGANIZATION SIZE, 2025-2035 (USD Billion)
      78. | | 7.20.3 BY VERTICAL, 2025-2035 (USD Billion)
      79. | 7.21 Rest of APAC MARKET SIZE ESTIMATES; FORECAST
      80. | | 7.21.1 BY TYPE, 2025-2035 (USD Billion)
      81. | | 7.21.2 BY ORGANIZATION SIZE, 2025-2035 (USD Billion)
      82. | | 7.21.3 BY VERTICAL, 2025-2035 (USD Billion)
      83. | 7.22 South America MARKET SIZE ESTIMATES; FORECAST
      84. | | 7.22.1 BY TYPE, 2025-2035 (USD Billion)
      85. | | 7.22.2 BY ORGANIZATION SIZE, 2025-2035 (USD Billion)
      86. | | 7.22.3 BY VERTICAL, 2025-2035 (USD Billion)
      87. | 7.23 Brazil MARKET SIZE ESTIMATES; FORECAST
      88. | | 7.23.1 BY TYPE, 2025-2035 (USD Billion)
      89. | | 7.23.2 BY ORGANIZATION SIZE, 2025-2035 (USD Billion)
      90. | | 7.23.3 BY VERTICAL, 2025-2035 (USD Billion)
      91. | 7.24 Mexico MARKET SIZE ESTIMATES; FORECAST
      92. | | 7.24.1 BY TYPE, 2025-2035 (USD Billion)
      93. | | 7.24.2 BY ORGANIZATION SIZE, 2025-2035 (USD Billion)
      94. | | 7.24.3 BY VERTICAL, 2025-2035 (USD Billion)
      95. | 7.25 Argentina MARKET SIZE ESTIMATES; FORECAST
      96. | | 7.25.1 BY TYPE, 2025-2035 (USD Billion)
      97. | | 7.25.2 BY ORGANIZATION SIZE, 2025-2035 (USD Billion)
      98. | | 7.25.3 BY VERTICAL, 2025-2035 (USD Billion)
      99. | 7.26 Rest of South America MARKET SIZE ESTIMATES; FORECAST
      100. | | 7.26.1 BY TYPE, 2025-2035 (USD Billion)
      101. | | 7.26.2 BY ORGANIZATION SIZE, 2025-2035 (USD Billion)
      102. | | 7.26.3 BY VERTICAL, 2025-2035 (USD Billion)
      103. | 7.27 MEA MARKET SIZE ESTIMATES; FORECAST
      104. | | 7.27.1 BY TYPE, 2025-2035 (USD Billion)
      105. | | 7.27.2 BY ORGANIZATION SIZE, 2025-2035 (USD Billion)
      106. | | 7.27.3 BY VERTICAL, 2025-2035 (USD Billion)
      107. | 7.28 GCC Countries MARKET SIZE ESTIMATES; FORECAST
      108. | | 7.28.1 BY TYPE, 2025-2035 (USD Billion)
      109. | | 7.28.2 BY ORGANIZATION SIZE, 2025-2035 (USD Billion)
      110. | | 7.28.3 BY VERTICAL, 2025-2035 (USD Billion)
      111. | 7.29 South Africa MARKET SIZE ESTIMATES; FORECAST
      112. | | 7.29.1 BY TYPE, 2025-2035 (USD Billion)
      113. | | 7.29.2 BY ORGANIZATION SIZE, 2025-2035 (USD Billion)
      114. | | 7.29.3 BY VERTICAL, 2025-2035 (USD Billion)
      115. | 7.30 Rest of MEA MARKET SIZE ESTIMATES; FORECAST
      116. | | 7.30.1 BY TYPE, 2025-2035 (USD Billion)
      117. | | 7.30.2 BY ORGANIZATION SIZE, 2025-2035 (USD Billion)
      118. | | 7.30.3 BY VERTICAL, 2025-2035 (USD Billion)
      119. | 7.31 PRODUCT LAUNCH/PRODUCT DEVELOPMENT/APPROVAL
      120. | | 7.31.1
      121. | 7.32 ACQUISITION/PARTNERSHIP
      122. | | 7.32.1

    Data Center Virtualization Market Segmentation

    Data Center Virtualization Type Outlook (USD Billion, 2018-2032)

    • Server
    • Storage
    • Network
    • Desktop

    Data Center Virtualization Organization Size Outlook (USD Billion, 2018-2032)

    • Small and Medium-Sized Enterprises (SMEs)
    • Large Enterprises

    Data Center Virtualization Vertical Outlook (USD Billion, 2018-2032)

    • BFSI
    • IT & Telecommunication
    • Manufacturing & Automotive
    • Government
    • Healthcare
    • Others

    Data Center Virtualization Regional Outlook (USD Billion, 2018-2032)

    • North America Outlook (USD Billion, 2018-2032)

      • North America Data Center Virtualization by Type
        • Server
        • Storage
        • Network
        • Desktop
      • North America Data Center Virtualization by Organization Size
        • Small and Medium-Sized Enterprises (SMEs)
        • Large Enterprises
      • North America Data Center Virtualization by Vertical
        • BFSI
        • IT & Telecommunication
        • Manufacturing & Automotive
        • Government
        • Healthcare
        • Others
      • US Outlook (USD Billion, 2018-2032)

      • US Data Center Virtualization by Type
        • Server
        • Storage
        • Network
        • Desktop
      • US Data Center Virtualization by Organization Size
        • Small and Medium-Sized Enterprises (SMEs)
        • Large Enterprises
      • US Data Center Virtualization by Vertical
        • BFSI
        • IT & Telecommunication
        • Manufacturing & Automotive
        • Government
        • Healthcare
        • Others
      • CANADA Outlook (USD Billion, 2018-2032)

      • CANADA Data Center Virtualization by Type
        • Server
        • Storage
        • Network
        • Desktop
      • CANADA Data Center Virtualization by Organization Size
        • Small and Medium-Sized Enterprises (SMEs)
        • Large Enterprises
      • CANADA Data Center Virtualization by Vertical
        • BFSI
        • IT & Telecommunication
        • Manufacturing & Automotive
        • Government
        • Healthcare
        • Others
    • Europe Outlook (USD Billion, 2018-2032)

      • Europe Data Center Virtualization by Type
        • Server
        • Storage
        • Network
        • Desktop
      • Europe Data Center Virtualization by Organization Size
        • Small and Medium-Sized Enterprises (SMEs)
        • Large Enterprises
      • Europe Data Center Virtualization by Vertical
        • BFSI
        • IT & Telecommunication
        • Manufacturing & Automotive
        • Government
        • Healthcare
        • Others
      • Germany Outlook (USD Billion, 2018-2032)

      • Germany Data Center Virtualization by Type
        • Server
        • Storage
        • Network
        • Desktop
      • Germany Data Center Virtualization by Organization Size
        • Small and Medium-Sized Enterprises (SMEs)
        • Large Enterprises
      • Germany Data Center Virtualization by Vertical
        • BFSI
        • IT & Telecommunication
        • Manufacturing & Automotive
        • Government
        • Healthcare
        • Others
      • France Outlook (USD Billion, 2018-2032)

      • France Data Center Virtualization by Type
        • Server
        • Storage
        • Network
        • Desktop
      • France Data Center Virtualization by Organization Size
        • Small and Medium-Sized Enterprises (SMEs)
        • Large Enterprises
      • France Data Center Virtualization by Vertical
        • BFSI
        • IT & Telecommunication
        • Manufacturing & Automotive
        • Government
        • Healthcare
        • Others
      • UK Outlook (USD Billion, 2018-2032)

      • UK Data Center Virtualization by Type
        • Server
        • Storage
        • Network
        • Desktop
      • UK Data Center Virtualization by Organization Size
        • Small and Medium-Sized Enterprises (SMEs)
        • Large Enterprises
      • UK Data Center Virtualization by Vertical
        • BFSI
        • IT & Telecommunication
        • Manufacturing & Automotive
        • Government
        • Healthcare
        • Others
      • ITALY Outlook (USD Billion, 2018-2032)

      • ITALY Data Center Virtualization by Type
        • Server
        • Storage
        • Network
        • Desktop
      • ITALY Data Center Virtualization by Organization Size
        • Small and Medium-Sized Enterprises (SMEs)
        • Large Enterprises
      • ITALY Data Center Virtualization by Vertical
        • BFSI
        • IT & Telecommunication
        • Manufacturing & Automotive
        • Government
        • Healthcare
        • Others
      • SPAIN Outlook (USD Billion, 2018-2032)

      • Spain Data Center Virtualization by Type
        • Server
        • Storage
        • Network
        • Desktop
      • Spain Data Center Virtualization by Organization Size
        • Small and Medium-Sized Enterprises (SMEs)
        • Large Enterprises
      • Spain Data Center Virtualization by Vertical
        • BFSI
        • IT & Telecommunication
        • Manufacturing & Automotive
        • Government
        • Healthcare
        • Others
      • Rest Of Europe Outlook (USD Billion, 2018-2032)

      • Rest Of Europe Data Center Virtualization by Type
        • Server
        • Storage
        • Network
        • Desktop
      • Rest Of Europe Data Center Virtualization by Organization Size
        • Small and Medium-Sized Enterprises (SMEs)
        • Large Enterprises
      • Rest Of Europe Data Center Virtualization by Vertical
        • BFSI
        • IT & Telecommunication
        • Manufacturing & Automotive
        • Government
        • Healthcare
        • Others
    • Asia-Pacific Outlook (USD Billion, 2018-2032)

      • Asia-Pacific Data Center Virtualization by Type
        • Server
        • Storage
        • Network
        • Desktop
      • Asia-Pacific Data Center Virtualization by Organization Size
        • Small and Medium-Sized Enterprises (SMEs)
        • Large Enterprises
      • Asia-Pacific Data Center Virtualization by Vertical
        • BFSI
        • IT & Telecommunication
        • Manufacturing & Automotive
        • Government
        • Healthcare
        • Others
      • China Outlook (USD Billion, 2018-2032)

      • China Data Center Virtualization by Type
        • Server
        • Storage
        • Network
        • Desktop
      • China Data Center Virtualization by Organization Size
        • Small and Medium-Sized Enterprises (SMEs)
        • Large Enterprises
      • China Data Center Virtualization by Vertical
        • BFSI
        • IT & Telecommunication
        • Manufacturing & Automotive
        • Government
        • Healthcare
        • Others
      • Japan Outlook (USD Billion, 2018-2032)

      • Japan Data Center Virtualization by Type
        • Server
        • Storage
        • Network
        • Desktop
      • Japan Data Center Virtualization by Organization Size
        • Small and Medium-Sized Enterprises (SMEs)
        • Large Enterprises
      • Japan Data Center Virtualization by Vertical
        • BFSI
        • IT & Telecommunication
        • Manufacturing & Automotive
        • Government
        • Healthcare
        • Others
      • India Outlook (USD Billion, 2018-2032)

      • India Data Center Virtualization by Type
        • Server
        • Storage
        • Network
        • Desktop
      • India Data Center Virtualization by Organization Size
        • Small and Medium-Sized Enterprises (SMEs)
        • Large Enterprises
      • India Data Center Virtualization by Vertical
        • BFSI
        • IT & Telecommunication
        • Manufacturing & Automotive
        • Government
        • Healthcare
        • Others
      • Australia Outlook (USD Billion, 2018-2032)

      • Australia Data Center Virtualization by Type
        • Server
        • Storage
        • Network
        • Desktop
      • Australia Data Center Virtualization by Organization Size
        • Small and Medium-Sized Enterprises (SMEs)
        • Large Enterprises
      • Australia Data Center Virtualization by Vertical
        • BFSI
        • IT & Telecommunication
        • Manufacturing & Automotive
        • Government
        • Healthcare
        • Others
      • Rest of Asia-Pacific Outlook (USD Billion, 2018-2032)

      • Rest of Asia-Pacific Data Center Virtualization by Type
        • Server
        • Storage
        • Network
        • Desktop
      • Rest of Asia-Pacific Data Center Virtualization by Organization Size
        • Small and Medium-Sized Enterprises (SMEs)
        • Large Enterprises
      • Rest of Asia-Pacific Data Center Virtualization by Vertical
        • BFSI
        • IT & Telecommunication
        • Manufacturing & Automotive
        • Government
        • Healthcare
        • Others
    • Rest of the World Outlook (USD Billion, 2018-2032)

      • Rest of the World Data Center Virtualization by Type
        • Server
        • Storage
        • Network
        • Desktop
      • Rest of the World Data Center Virtualization by Organization Size
        • Small and Medium-Sized Enterprises (SMEs)
        • Large Enterprises
      • Rest of the World Data Center Virtualization by Vertical
        • BFSI
        • IT & Telecommunication
        • Manufacturing & Automotive
        • Government
        • Healthcare
        • Others
      • Middle East Outlook (USD Billion, 2018-2032)

      • Middle East Data Center Virtualization by Type
        • Server
        • Storage
        • Network
        • Desktop
      • Middle East Data Center Virtualization by Organization Size
        • Small and Medium-Sized Enterprises (SMEs)
        • Large Enterprises
      • Middle East Data Center Virtualization by Vertical
        • BFSI
        • IT & Telecommunication
        • Manufacturing & Automotive
        • Government
        • Healthcare
        • Others
      • Africa Outlook (USD Billion, 2018-2032)

      • Africa Data Center Virtualization by Type
        • Server
        • Storage
        • Network
        • Desktop
      • Africa Data Center Virtualization by Organization Size
        • Small and Medium-Sized Enterprises (SMEs)
        • Large Enterprises
      • Africa Data Center Virtualization by Vertical
        • BFSI
        • IT & Telecommunication
        • Manufacturing & Automotive
        • Government
        • Healthcare
        • Others
      • Latin America Outlook (USD Billion, 2018-2032)

      • Latin America Data Center Virtualization by Type
        • Server
        • Storage
        • Network
        • Desktop
      • Latin America Data Center Virtualization by Organization Size
        • Small and Medium-Sized Enterprises (SMEs)
        • Large Enterprises
      • Latin America Data Center Virtualization by Vertical
        • BFSI
        • IT & Telecommunication
        • Manufacturing & Automotive
        • Government
        • Healthcare
        • Others
    Infographic

    Free Sample Request

    Kindly complete the form below to receive a free sample of this Report

    Get Free Sample

    Customer Strories

    “I am very pleased with how market segments have been defined in a relevant way for my purposes (such as "Portable Freezers & refrigerators" and "last-mile"). In general the report is well structured. Thanks very much for your efforts.”

    Victoria Milne

    Founder
    Case Study
    Chemicals and Materials

    Compare Licence

    ×
    Features License Type
    Single User Multiuser License Enterprise User
    Price $4,950 $5,950 $7,250
    Maximum User Access Limit 1 User Upto 10 Users Unrestricted Access Throughout the Organization
    Free Customization
    Direct Access to Analyst
    Deliverable Format
    Platform Access
    Discount on Next Purchase 10% 15% 15%
    Printable Versions